From Arctic winter blasts to unusual fall warmth, and from droughty stretches to heavy rains, 2025 delivered both temperature whiplash and precipitation ping-pong across the state.
For a more detailed look at standout events of the year, check out our list of Wisconsin’s top 10 weather and climate events of 2025. For more information on each month and season, visit our Climate Summaries page.
Temperature Whiplash
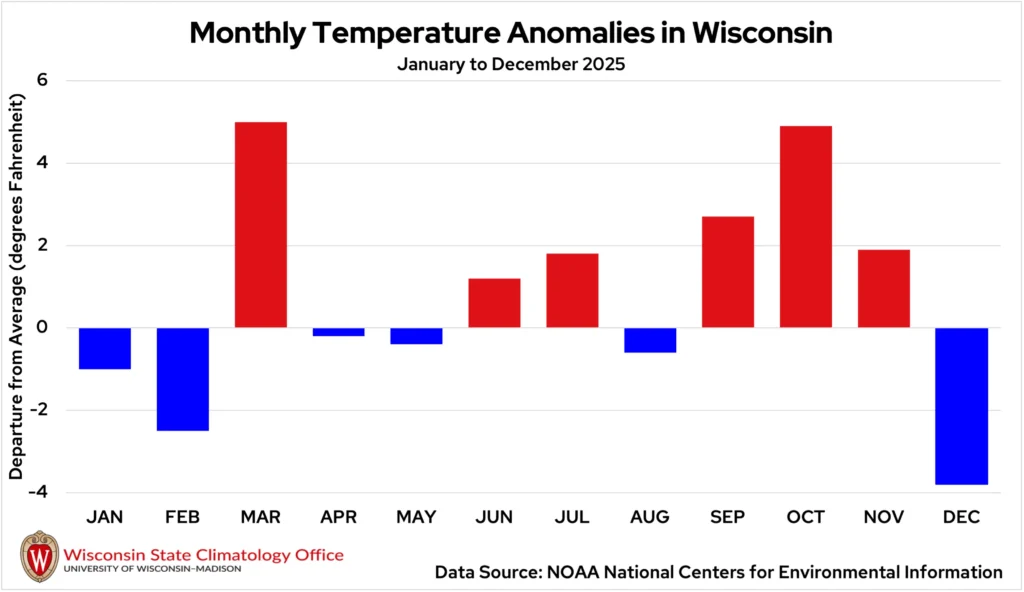
Temperatures in Wisconsin swung sharply throughout the year, with a cold start giving way to repeated stretches of unusual warmth.
January and February delivered multiple blasts of cold, but were followed by a very warm March. The especially warm fall season finished as the seventh warmest on record. December closed out the year on a colder note — 3.8 degrees colder than normal, making it the state’s coldest month (relative to normal) since April 2022 (Figure 1).
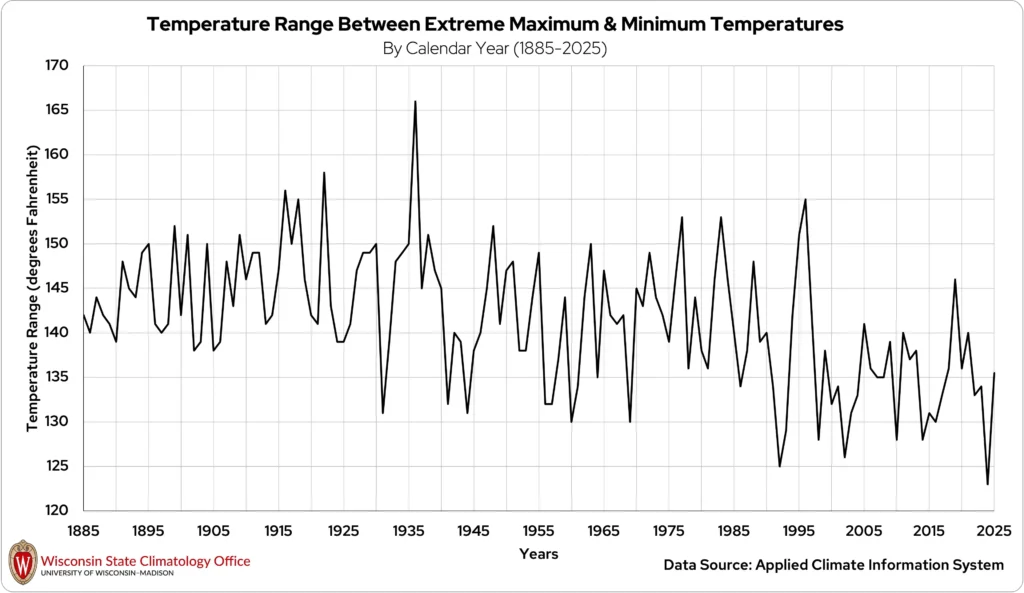
The coldest temperature of the year was 37.5 degrees below zero in Knight (Iron County) on January 20, while the warmest reading was 98 degrees at the Kenosha Airport (Kenosha County) on June 23. Together, these extremes produced an annual statewide temperature range of 136 degrees.
Historically, annual ranges often exceeded the 130-degree mark. However, recent decades have featured a narrowing of this range, reflecting fewer occurrences of extreme cold (minus 30 degrees or colder) and extreme heat (100 degrees or warmer) (Figure 2).
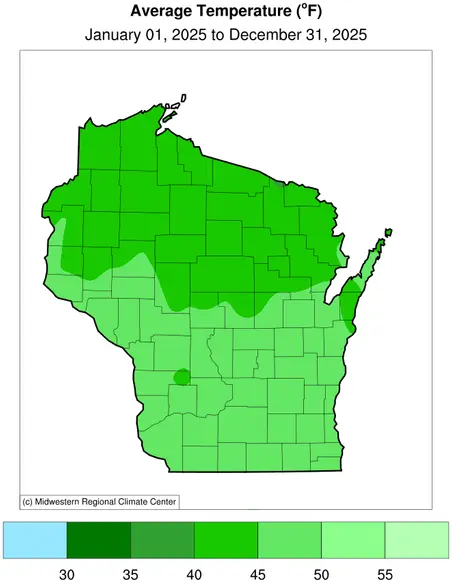
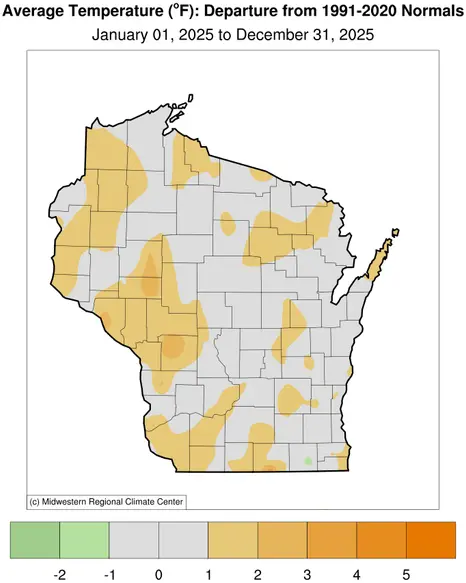
Despite the swings, the warm months outpaced cool ones overall, with a statewide average temperature of 44.6 degrees for the year. This is 0.8 degrees warmer than normal, ranking as Wisconsin’s nineteenth warmest year since records began in 1895 (Figure 3).
Precipitation Ping-Pong: Round 3
For the third straight year, precipitation in Wisconsin followed a “ping-pong” pattern, with shifts between very dry and very wet months.
The year opened with the third driest January on record, followed by the sixth wettest March. Conditions then flipped to a very dry May, but soon gave way to a wet early summer. By fall, dryness settled in, making it the eighth driest fall on record statewide (Figure 4).
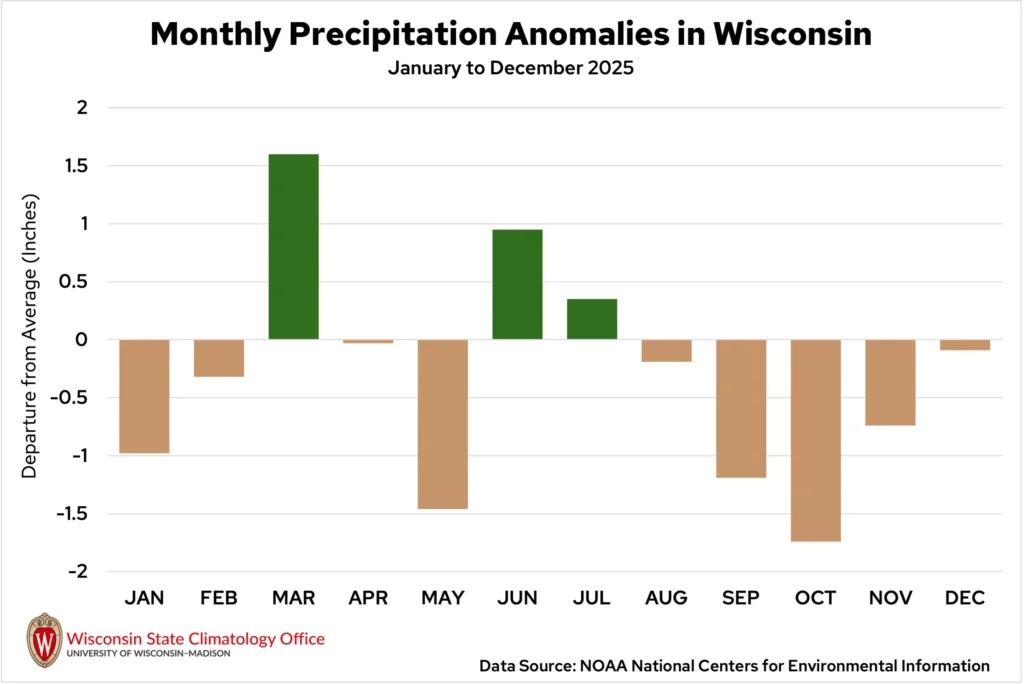
An extraordinary single-day rainfall event punctuated these sharp contrasts. Between August 9 and 10, 14.55 inches of rain fell on Milwaukee’s north side, setting a new Wisconsin 24-hour rainfall record.
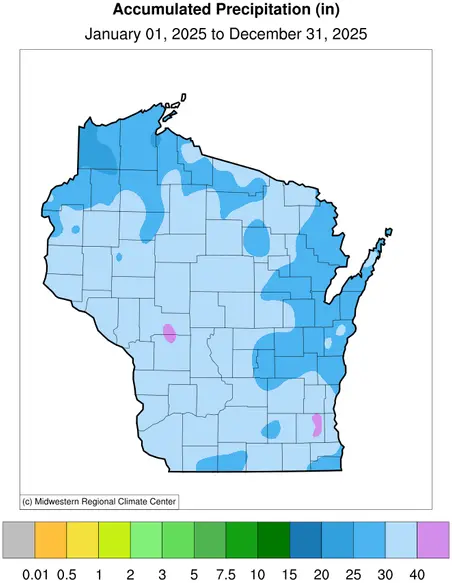
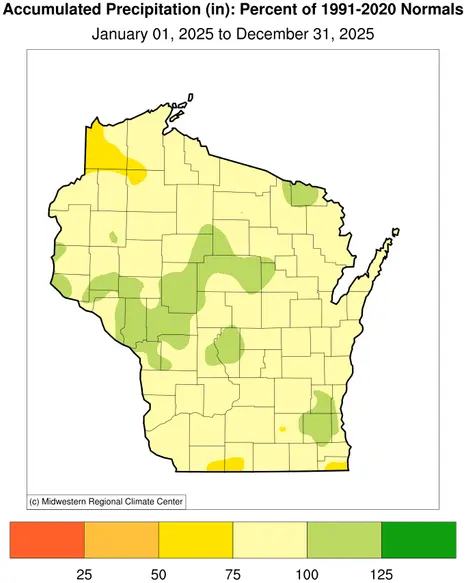
Annual precipitation totals varied widely across the state. Waukesha County recorded 36.28 inches for the year, while Douglas County finished with 23.01 inches. This underscores the strong regional contrasts that accompanied the monthly swings.
Despite the volatility, Wisconsin averaged 30.61 inches of precipitation in 2025, about 3.44 inches below normal (Figure 5).

This report is a product of the Wisconsin State Climatology Office. For questions and comments, please contact us by email (stclim@aos.wisc.edu) or phone (608-263-2374).