With modest temperatures, hit-or-miss showers, and bouts of severe weather, April 2025 shaped up to be Wisconsin’s most normal April since 2009.
Climate Statistics by Division
To view a summary of April’s key climate statistics for each of Wisconsin’s nine climate divisions, check out the detailed table at the end of this report. This table includes average temperature, heating degree days, total precipitation, and snowfall. For each variable, you’ll find both the observed April values and how they compared to the long-term average from 1991 to 2020. These comparisons help highlight where the month was warmer, cooler, wetter, or drier than usual.
A Normal April
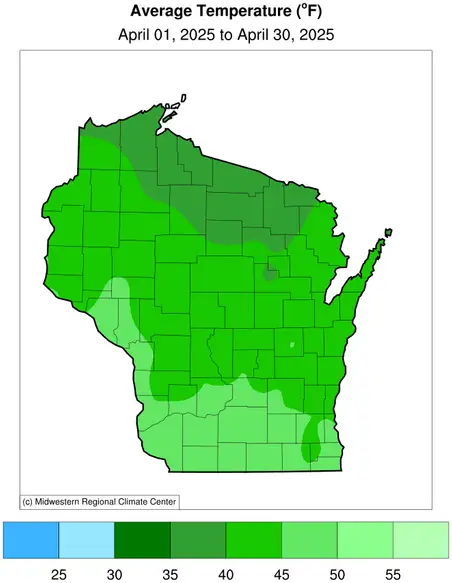
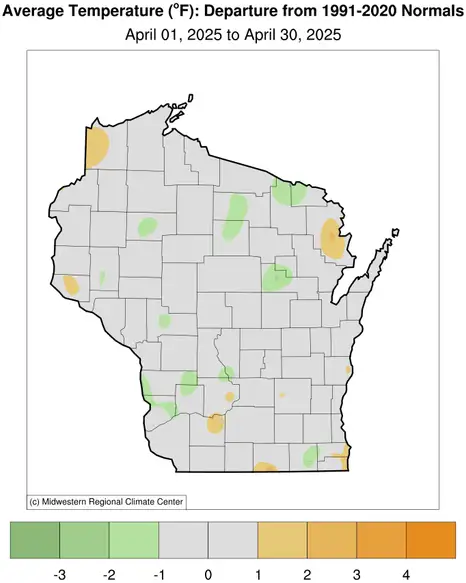
April brought relatively steady spring-like weather to Wisconsin, with statewide averages of 42.9 degrees (Fahrenheit) and 3.17 inches of precipitation, just 0.2 degrees and 0.03 inches below normal (Figures 1 and 2). Such tiny anomalies stand out in a time when most months have been several degrees warmer and several inches wetter or drier than average. In the past twelve months, April was only the fifth month to fall within one degree of normal — and just the fourth to average below normal (Figure 3).
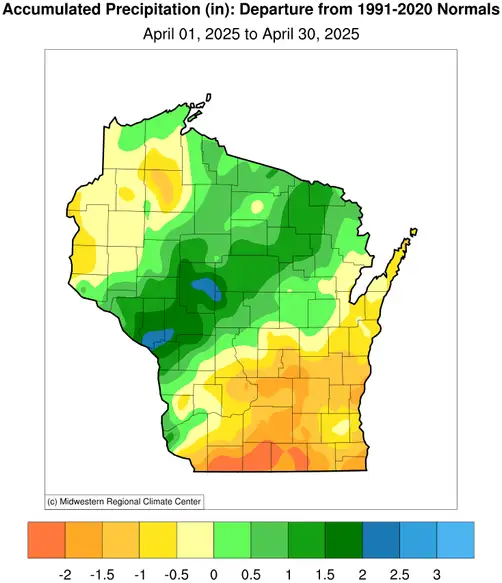
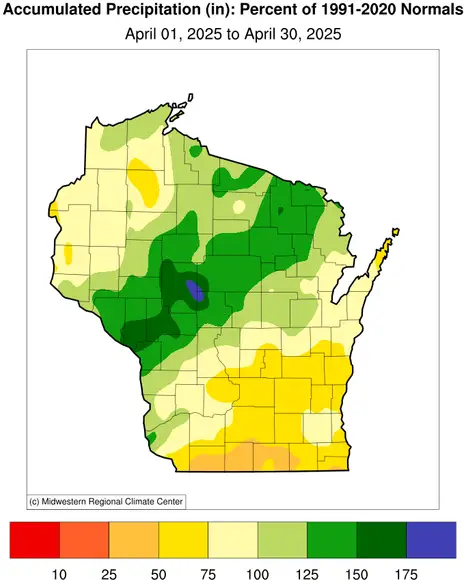
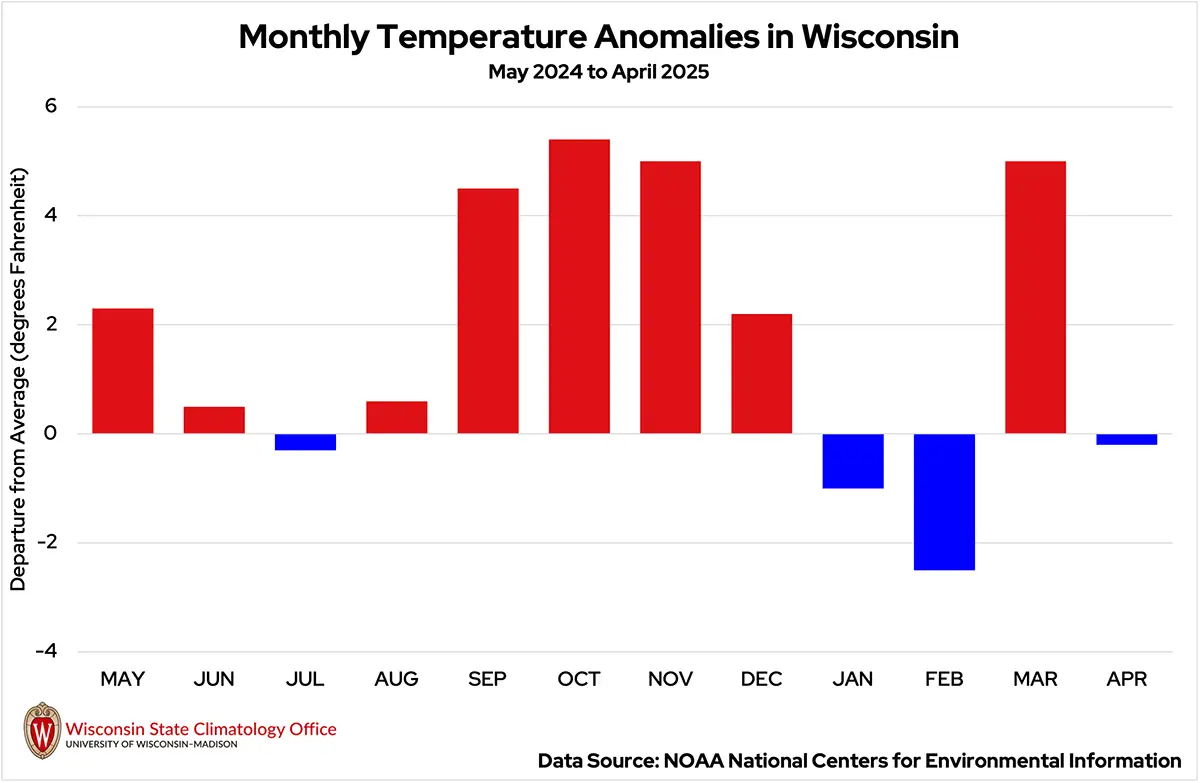
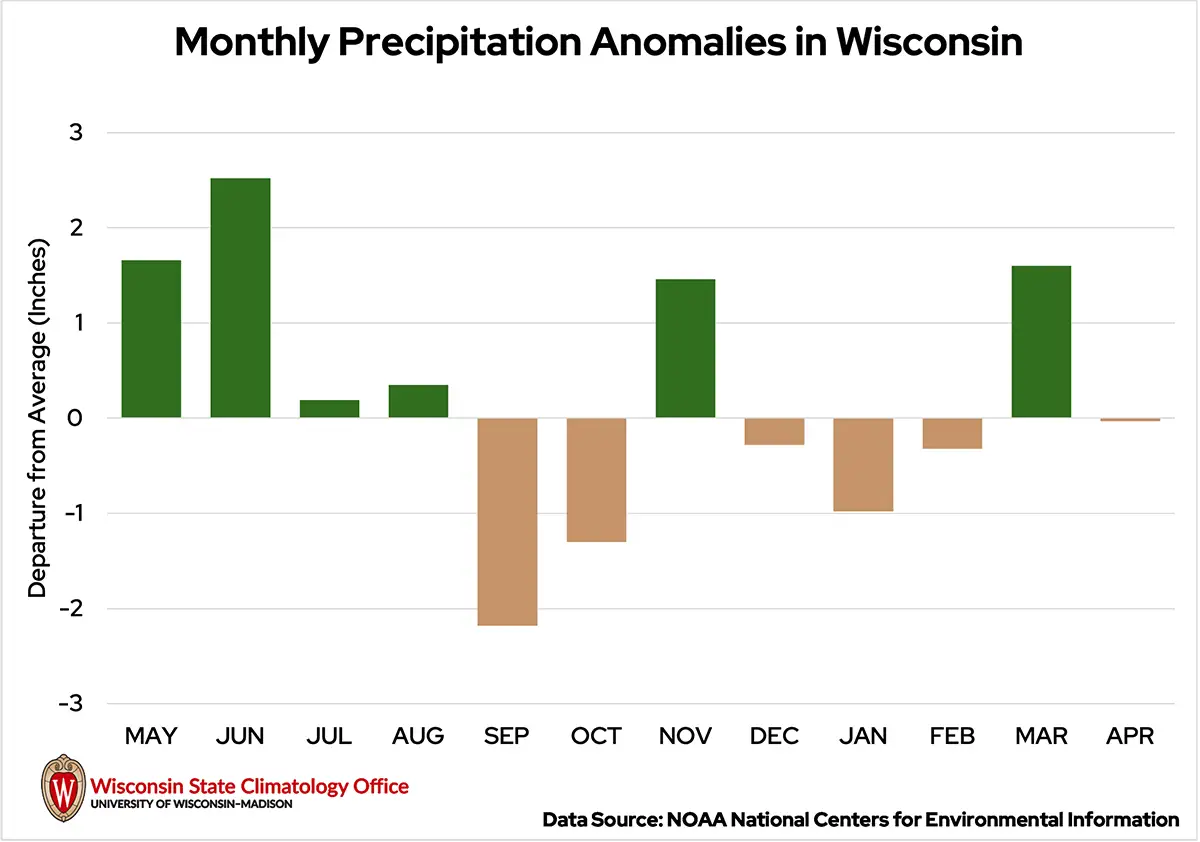
Even more remarkable, last month’s precipitation anomaly was the smallest of the past twelve months — the closest the state has come to typical monthly totals in a year. The combination of a barely noticeable 0.2-degree statewide temperature anomaly and a miniscule 0.03-inch precipitation anomaly makes this the most “normal” April in Wisconsin since 2009. This is a rare feat in a time when normal is not so normal anymore.
April’s Gradual Warm-Up
Unlike recent months, last month avoided major temperature swings, instead showing a gradual warming trend. One of the coldest days was April 8, when temperatures plunged to five degrees near Manitowish (Iron County), which was the state’s coldest recording of the month. Temperatures even dipped to 17 degrees in both Madison and Wausau — about 12 to 16 degrees below normal.
But the month ended on a summer-like note: Madison hit 82 degrees on April 28, about 20 degrees above the daily average and on par with a typical July afternoon (thankfully, without the July humidity). Milwaukee reached 80 degrees the same day, right on schedule for its first 80-degree day of the season, while Kenosha (at the regional airport in Kenosha County) topped out at 86 degrees — the state’s warmest reading of the month.
By the end of April, several locations recorded what could be their final spring freeze of 32 degrees or colder. Recent freezes ranged from April 12 in Milwaukee (30 degrees) to April 30 in Eau Claire (32 degrees). That said, the average last 32-degree freezes across Wisconsin typically occur in late April to late May, according to the Midwestern Regional Climate Center’s Freeze Date Tool, which is based on historical observations — so another dip below freezing remains possible (Table 1).
For those tracking the risk of additional spring frosts and freezes, the new National Weather Service Frost Freeze Decision Support Tool forecasts the probability of conditions conducive for frost or freeze in Wisconsin over the next seven days.
| Location | Last April 2025 Freeze of 32 degrees or Colder | Average Last Spring Freeze of 32 degrees |
|---|---|---|
| Milwaukee | April 12 (30 degrees) | April 25 |
| Madison | April 16 (27 degrees) | April 30 |
| La Crosse | April 20 (30 degrees) | May 1 |
| Green Bay | April 16 (31 degrees) | May 5 |
| Eau Claire | April 30 (32 degrees) | May 7 |
| Wausau | April 22 (31 degrees) | May 9 |
April Showers … or Sprinkles
The month started off wet, with widespread showers and thunderstorms across the state. Heavy rain in the southern half of the state on April 2 created ponding in fields, with totals ranging from a half-inch in the west to over an inch in the east.
A line of strong thunderstorms was accompanied by heavy downpours during the morning rush hour of April 18. Flash flooding occurred on a few downtown streets in Milwaukee, and low-lying sections of the nearby interstate had to be temporarily closed due to ponding water. The Milwaukee airport received 0.88 inches of rain in about an hour.
On April 20 to 22, showers marched from La Crosse County to Taylor County (northwest of Wausau), dropping anywhere from one to two inches of rain. La Crosse received 1.66 inches of rain on April 20, breaking the city’s previous 1968 daily record of 1.57 inches.
La Crosse ended April with over five inches of rain, 1.45 inches wetter than normal, while Milwaukee received under three inches, 1.09 inches drier than normal. Despite these large differences in monthly totals, La Crosse only had two more days with measurable precipitation than Milwaukee. This reflects the intensity of the rains that fell in the western part of the state through the month.
Ta-Ta, Snow!
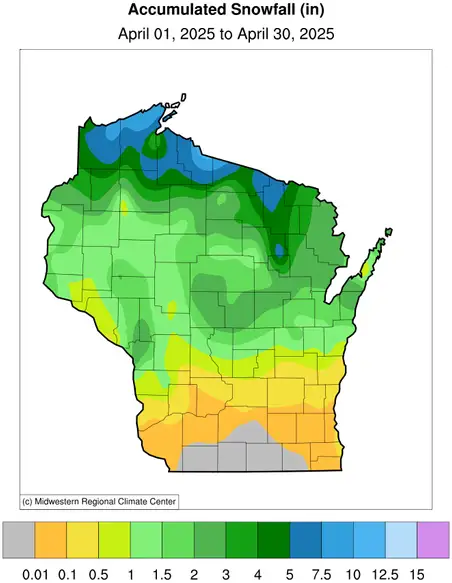
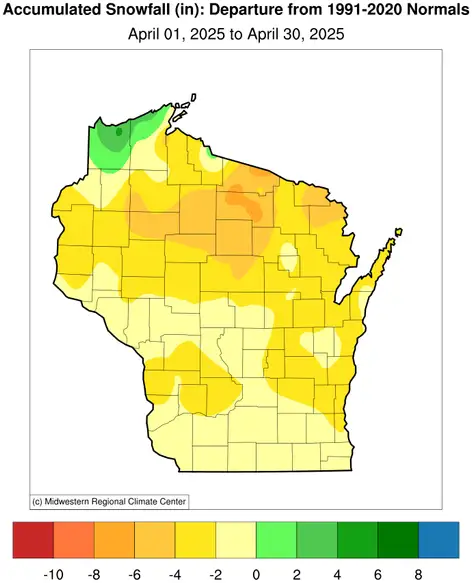
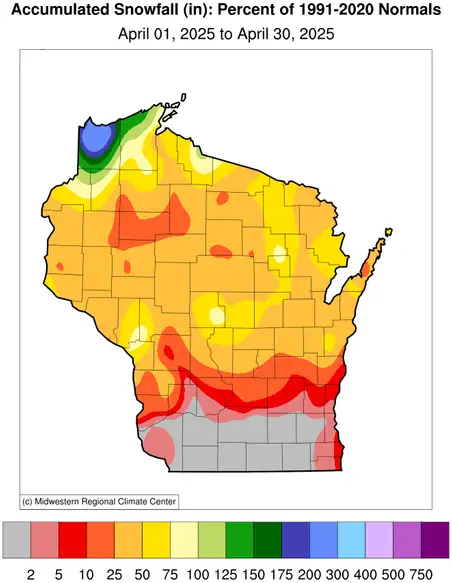
April is typically the beginning of the end of the snow season in Wisconsin. The southern and central parts of the state remained largely snow-free, but northern Wisconsin still saw some of the white stuff. Despite totals between five to seven inches for the month, this was still below average for most northern communities by one to four inches (Figure 4). Only parts of Douglas and Bayfield counties measured slightly higher snow amounts than typical, thanks to a winter system that dropped four to six inches of snow on April 2 and 3.
Springing into Severe Weather Season
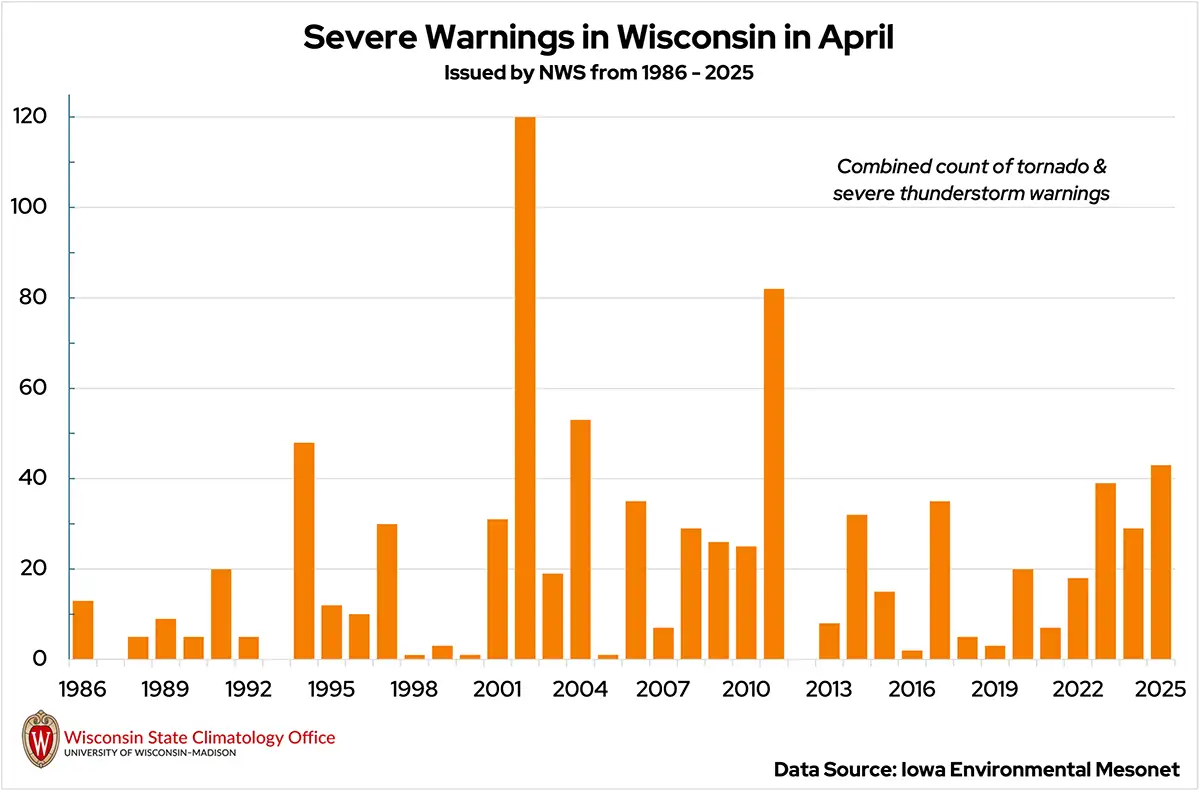
While it’s not uncommon for a few severe thunderstorms to develop during March, April is more often when severe weather season begins to ramp up. Last month, 35 severe thunderstorm warnings were issued across the state, and eight tornado warnings for a combined total of 43 warnings, roughly double the 1986–2024 average of 21 warnings. This was the highest number of severe warnings during April since 2011 when 82 warnings were issued (Figure 5).
A complex of storms on April 2 prompted both the first severe storm and tornado warnings of the month in the state. Weak rotation warranted two tornado warnings: one in northern Rock and southern Dane County, and another in northern Dane and southern Columbia County. No tornadoes were confirmed, and no significant damage was reported.
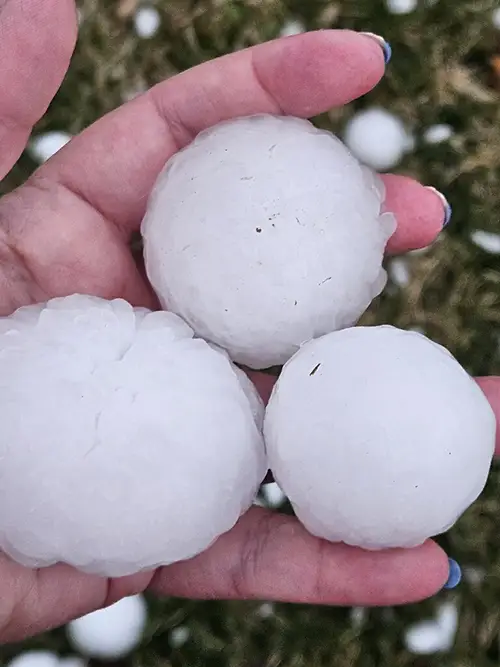
Large hail pounded southern Wisconsin on April 18 as a line of severe storms rolled through. Baseball-sized hailstones — as large as 2.75 inches — were reported near Platteville (Grant County), New Glarus (Green County), and Edgerton (Rock and Dane Counties) (Image 1). These reports prompted the National Weather Service in Milwaukee to issue its first “destructive” severe thunderstorm warning due to hail for parts of Dane, Jefferson, and Rock Counties. Once the storm had passed, residents walked outside to see the damage: shattered car windows, dented house siding, and damaged roofs (Image 2).

On April 28, morning thunderstorms in the central part of the state preempted the main event later in the evening. A warm and humid environment fueled an organized line of thunderstorms as it crossed the border from Minnesota into western Wisconsin. Seven tornadoes touched down in the state, five south of Eau Claire and two east of Wausau (Table 2). Based on the damage the National Weather Service observed, all were rated low on the Enhanced Fujita scale, and no injuries were reported.
| Location | Enhanced Fujita (EF) Rating | Estimate Maximum Winds | Damage Reported |
|---|---|---|---|
| North of Mondovi (Buffalo Co. to Eau Claire Co.) | EF-1 | 95 mph | Damage to homes, uprooted and snapped trees. |
| Cleghorn (Eau Claire Co.) | EF-1 | 95 mph | Multiple uprooted, twisted pine trees and a destroyed pole barn. |
| East of Foster (Eau Claire Co.) | EF-0 | 80 mph | Minor tree and structure damage. |
| Augusta (Eau Claire Co.) | EF-0 | 80 mph | Damage to outbuilding roofs and trees. |
| Fairchild (Eau Claire Co.) | EF-1 | 90 mph | Hundreds of broken trees and damage to the roofs of homes and outbuildings. |
| Birnamwood (Marathon & Shawano Co.) | EF-0 | 80 mph | Damage to the roof of an outbuilding and uprooted trees. |
| Mattoon (Shawano Co.) | EF-0 | 80 mph | Uprooted trees and minor exterior damage to buildings. |
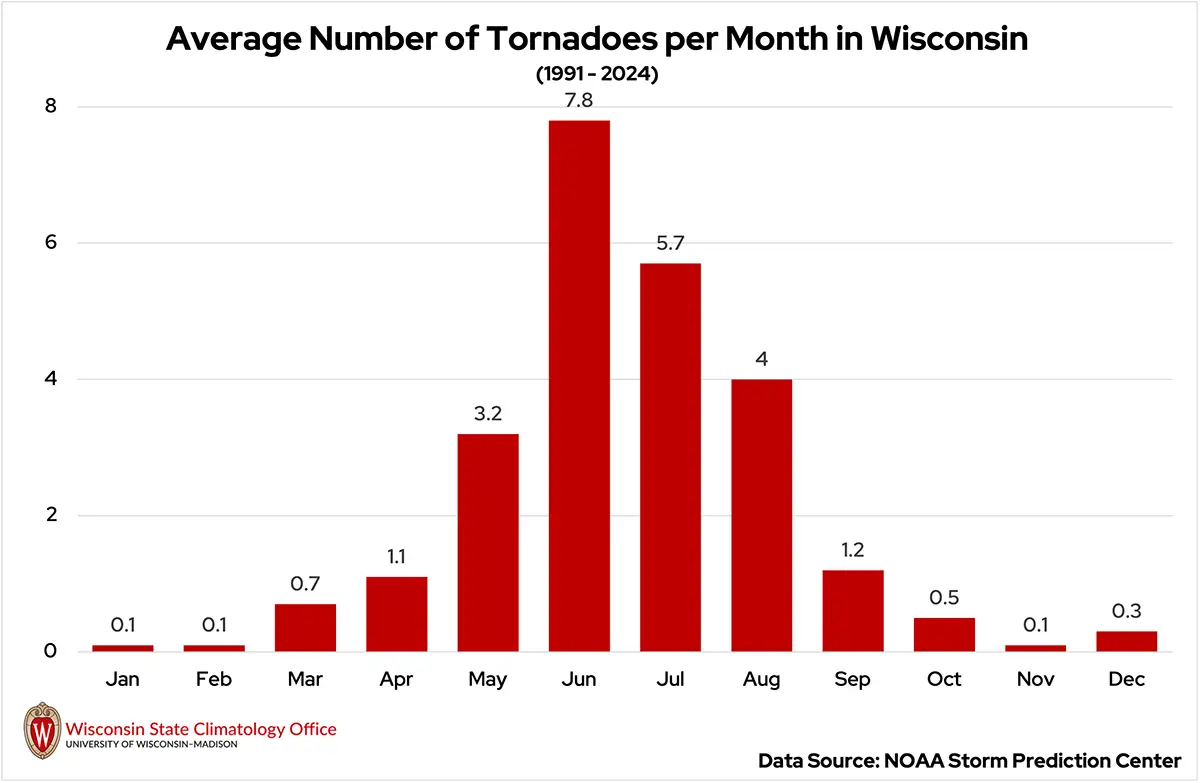
The April 28 tornadoes were the first in the state this year, and they occurred later than in recent years: 2024 (February 8), 2023 (March 31), 2022 (March 5) (Figure 6). The confirmation of seven tornadoes also makes the outbreak the third-largest single-day tornado outbreak in Wisconsin during the month of April, behind the 15-tornado outbreak on April 10, 2011, and the 10-tornado outbreak of April 27, 1984.
In addition to tornadoes, multiple reports of small hail and wind gusts from 50 to 60 miles per hour came in across the central part of the state, resulting in a tree that caught fire and fell on a power line just south of Wausau (Marathon County).
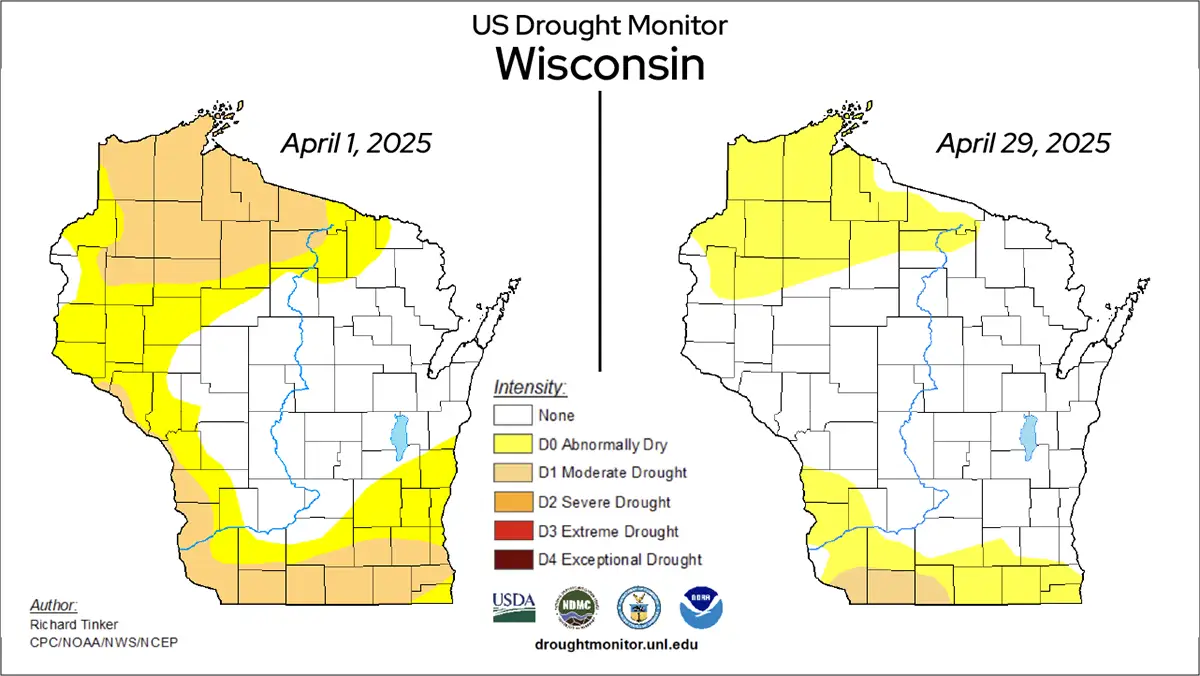
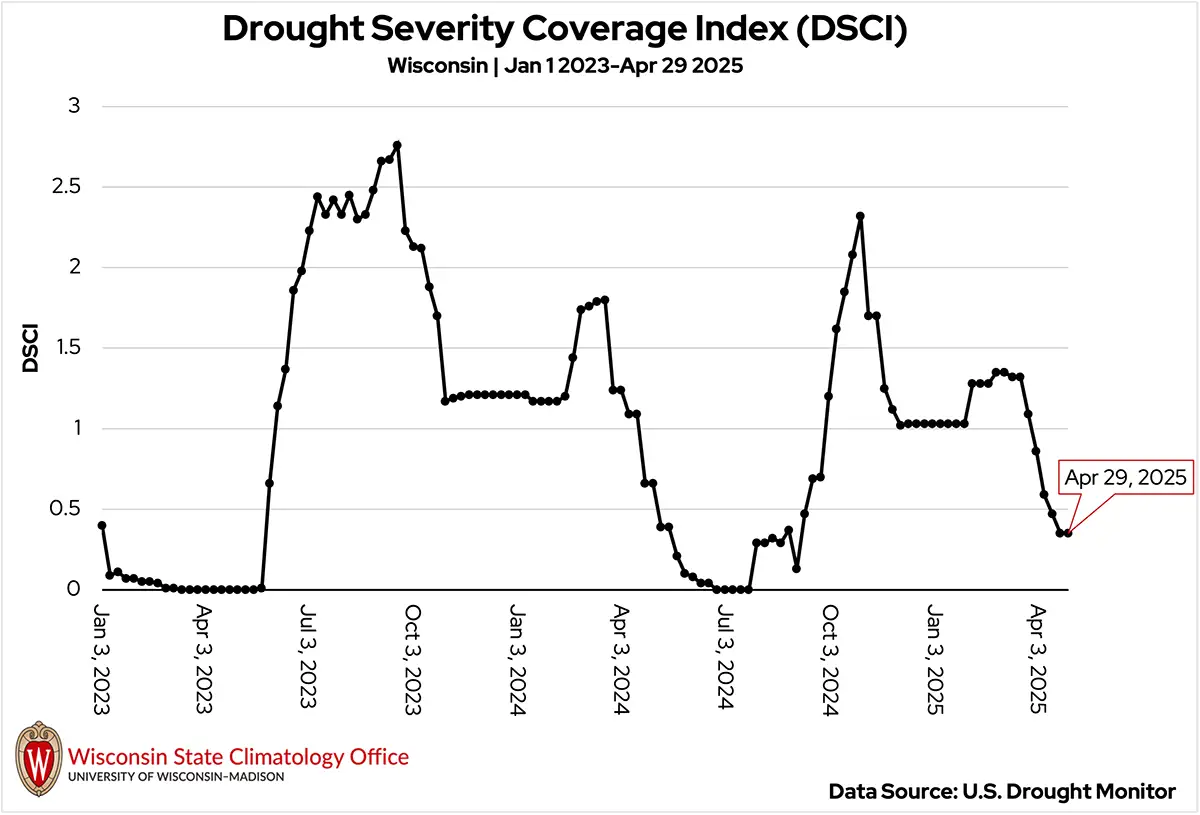
Fires Amid Drought Relief
April showers have gradually improved drought conditions in Wisconsin. As of April 1, abnormal dryness (D0) and moderate drought (D1) lingered across far southern, western, and northern Wisconsin (Figure 7). But by April 29, the abnormal dryness coverage shrank considerably across most of those regions, while drought persisted only across Grant, Lafayette, and Green counties in southwest Wisconsin. The Drought Severity Coverage Index (DSCI) shows continued statewide improvements (Figure 8).
Despite the improvements in drought, dry and windy conditions have led to a significant number of wildfires. In mid-April, the Wisconsin Department of Natural Resources (DNR) suspended burn permits in 24 counties due to high fire danger. Despite the burn restrictions, over 290 fires broke out across the state in April, burning 542 acres. Typically, Wisconsin sees around 864 wildfires annually, burning about 1,800 acres.
However, 2025 has already seen more than double the number of fires for this time of year, largely due to unusually warm and dry winter conditions with little snow cover. In addition to wildfires, mild winter conditions led to an early start for prescribed prairie burns in some areas, though gusty April winds made execution tricky. For up-to-date fire danger information and burn restrictions, check the DNR’s Wisburn Dashboard.
Still Blowing Strong
Historically, April brings the strongest winds to Wisconsin, and this year was no exception, with last month bringing notably gusty conditions across the state — though not as extreme as the record-setting winds of March. All six of Wisconsin’s first-order stations ranked in the top 10 for April average wind gusts (in miles per hour) since 1973 (Table 3).
Milwaukee topped the list for average wind gusts at 31 miles per hour, ranking as the city’s fifth highest on record. Eau Claire, Wausau, and Madison ranked as fourth-highest historically, recording average gusts of 28.5, 28.8, and 29.8 miles per hour, respectively. The number of days with wind gusts of 30 miles per hour or more was particularly striking in Madison, which logged 13 such days — its second highest count on record, just behind 2014 with 14 days.
Milwaukee recorded the most days last month at 14, tying for sixth highest. The remaining first-order stations also posted relatively high rankings, highlighting how persistently windy last month was across the state (Table 4).
April Monthly Average Wind Gusts (miles per hour)
| Location | 1973-2025 Average | 2025 | Rank |
|---|---|---|---|
| Milwaukee | 26.3 | 31.0 | 5 |
| Madison | 24.9 | 29.8 | 4 |
| La Crosse | 21.6 | 28.3 | 6 (tie) |
| Green Bay | 23.2 | 29.1 | 10 |
| Eau Claire | 22.8 | 28.5 | 4 |
| Wausau | 22.1 | 28.8 | 4 |
Days with Wind Gusts at least 30 miles per hour
| Location | 1973-2025 Average | 2025 | Rank |
|---|---|---|---|
| Milwaukee | 10.7 | 14 | 6 (tie) |
| Madison | 8.2 | 13 | 2 |
| La Crosse | 6.0 | 12 | 5 |
| Green Bay | 8.0 | 11 | 12 |
| Eau Claire | 6.2 | 12 | 4 |
| Wausau | 6.0 | 12 | 6 |
Spring Challenges
Spring fieldwork advanced across southern Wisconsin in April as warmer temperatures thawed the soils. Though rain occasionally delayed progress, farmers took advantage of dry stretches to begin planting, spreading manure, and prepping fields. Overall, planting was off to a mixed but promising start, with crops like soybeans and potatoes slightly ahead of schedule but corn and oats slightly behind, as of late April.
In specialty crops, apple growers faced an early-season challenge as warm, wet conditions led to high levels of apple scab infection. Disease management was a top priority, though spring rains complicated protectant applications. Meanwhile, grapes and blueberries entered bud swell by month’s end, with growers closely monitoring for pests and disease. Rain also improved pasture conditions, benefiting livestock.
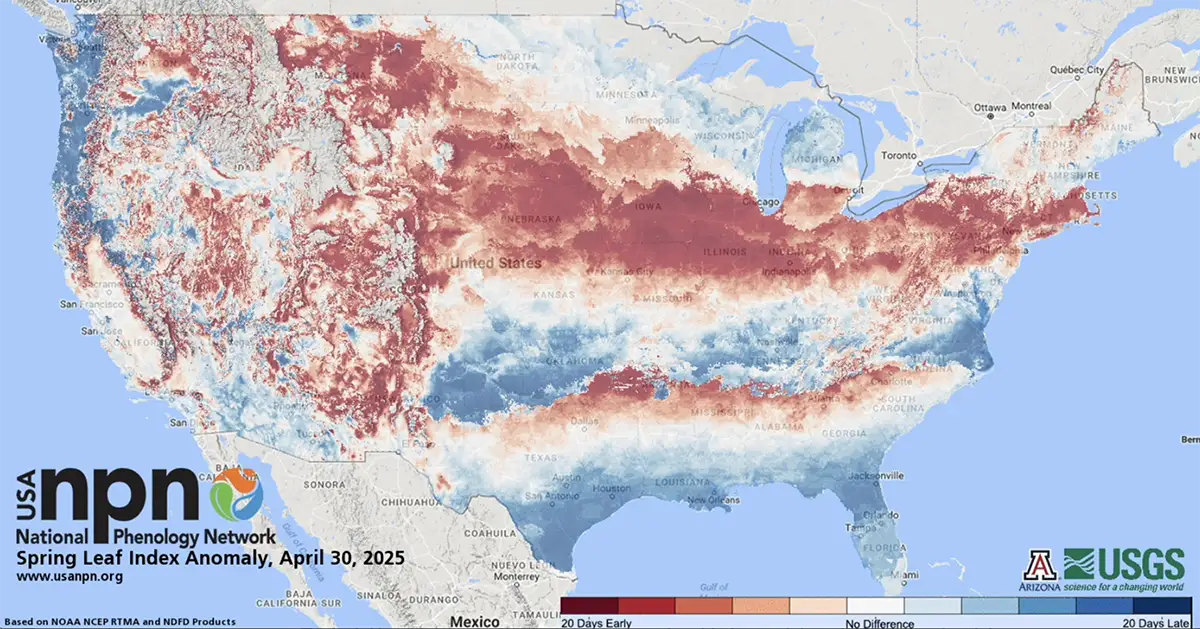
The USA National Phenology Network shows that leaf-out — or leaf development — began slightly ahead of schedule in southern and western Wisconsin, though sub-freezing temperatures around the second week of April temporarily slowed progress (Figure 9). By the end of April, most of the state had surpassed the first leaf stage.
Outlook
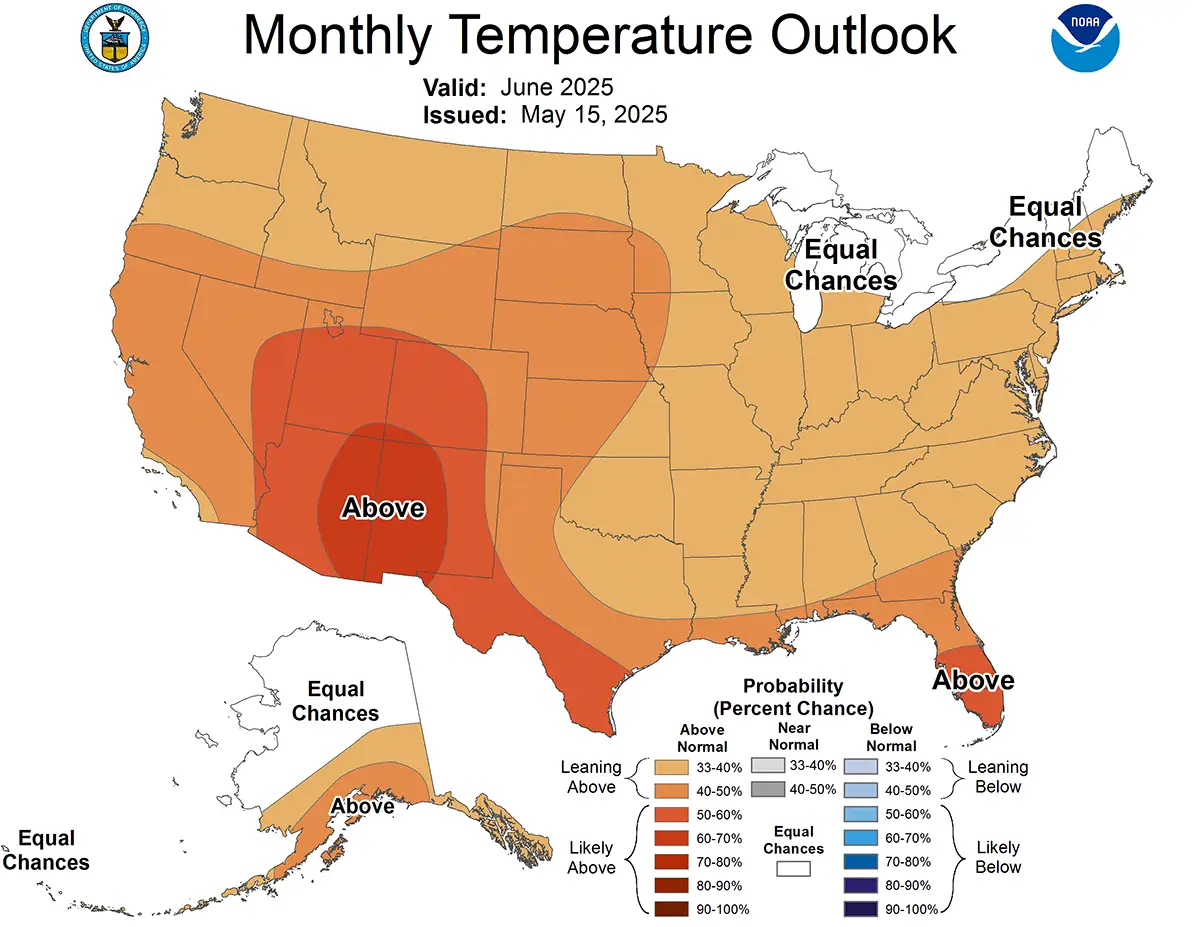
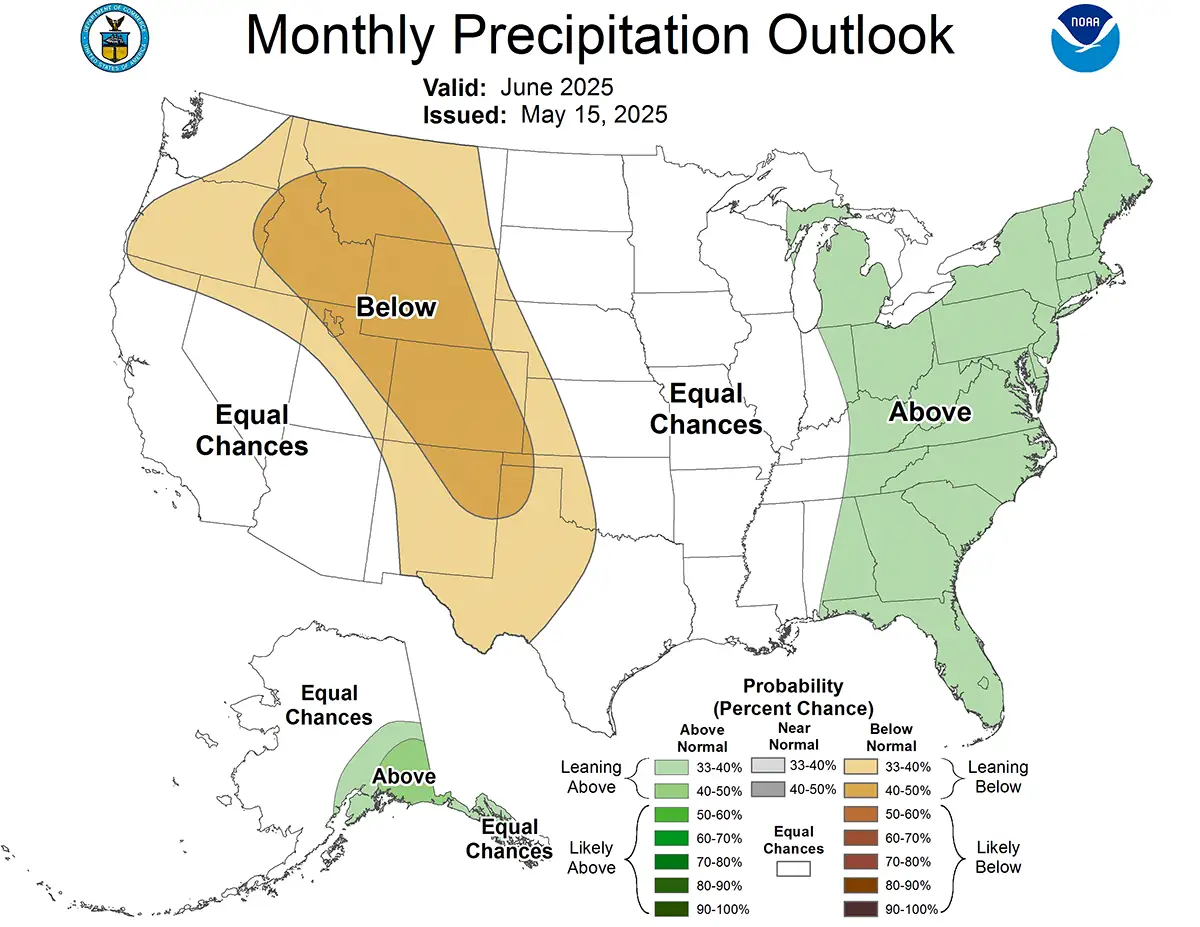
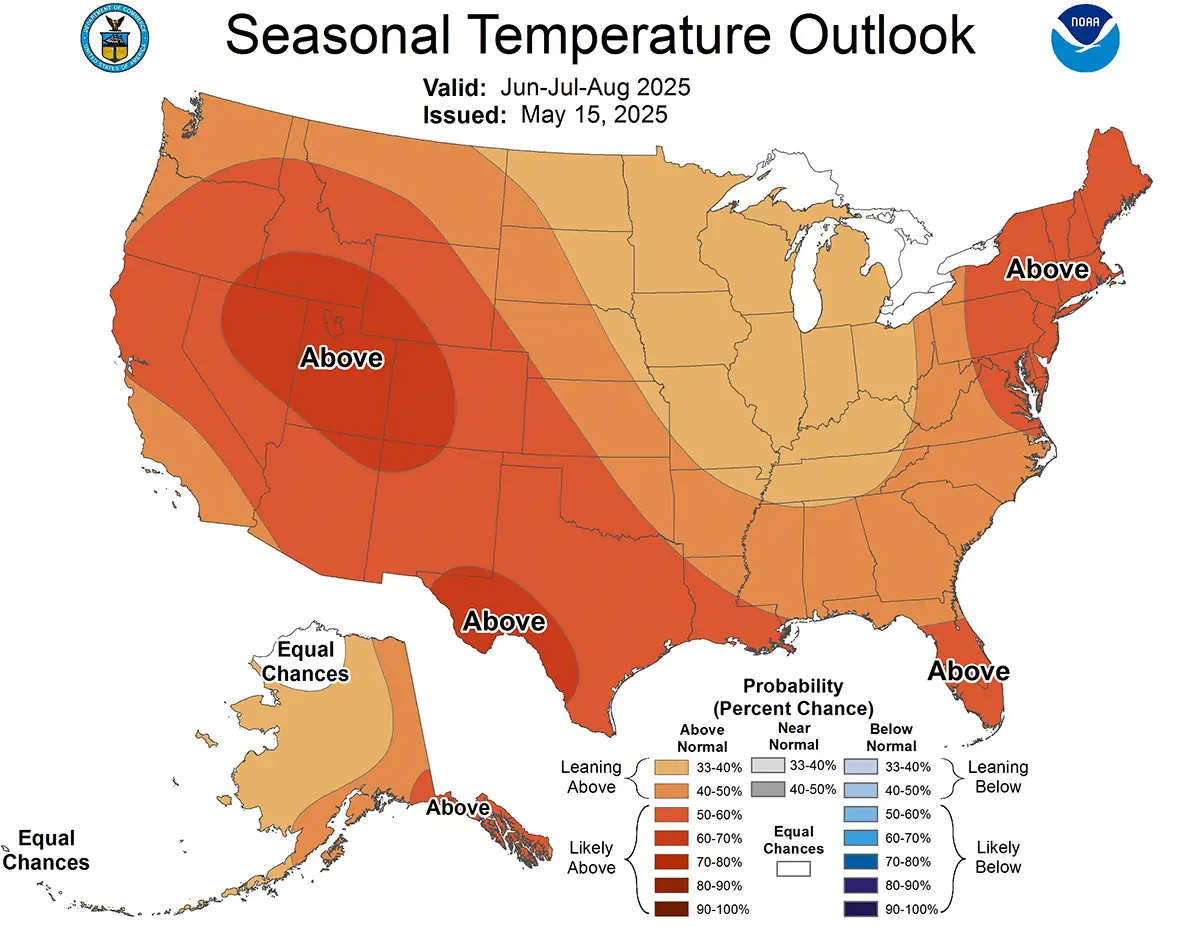
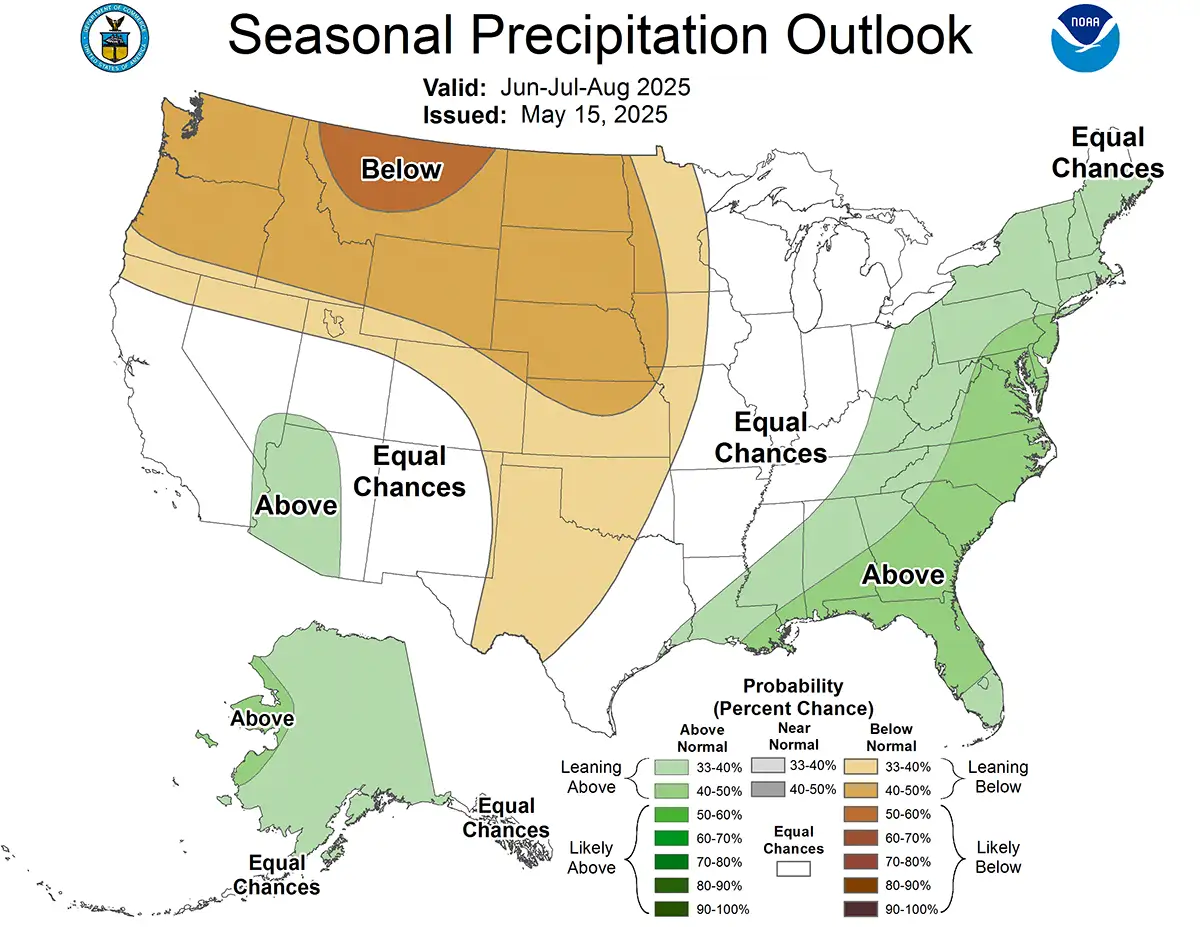
Looking ahead to June, there is a subtle signal that Wisconsin could see warmer-than-normal temperatures (Figure 10). As for precipitation, the outlook remains uncertain — there is no strong indication whether the state will be wetter or drier than normal. This pattern continues into the summer, with June through August expected to bring a slight lean toward warmth, but no clear clues on rainfall (Figure 11).
Climate Corner
Q: When is it windiest in Wisconsin — and why?
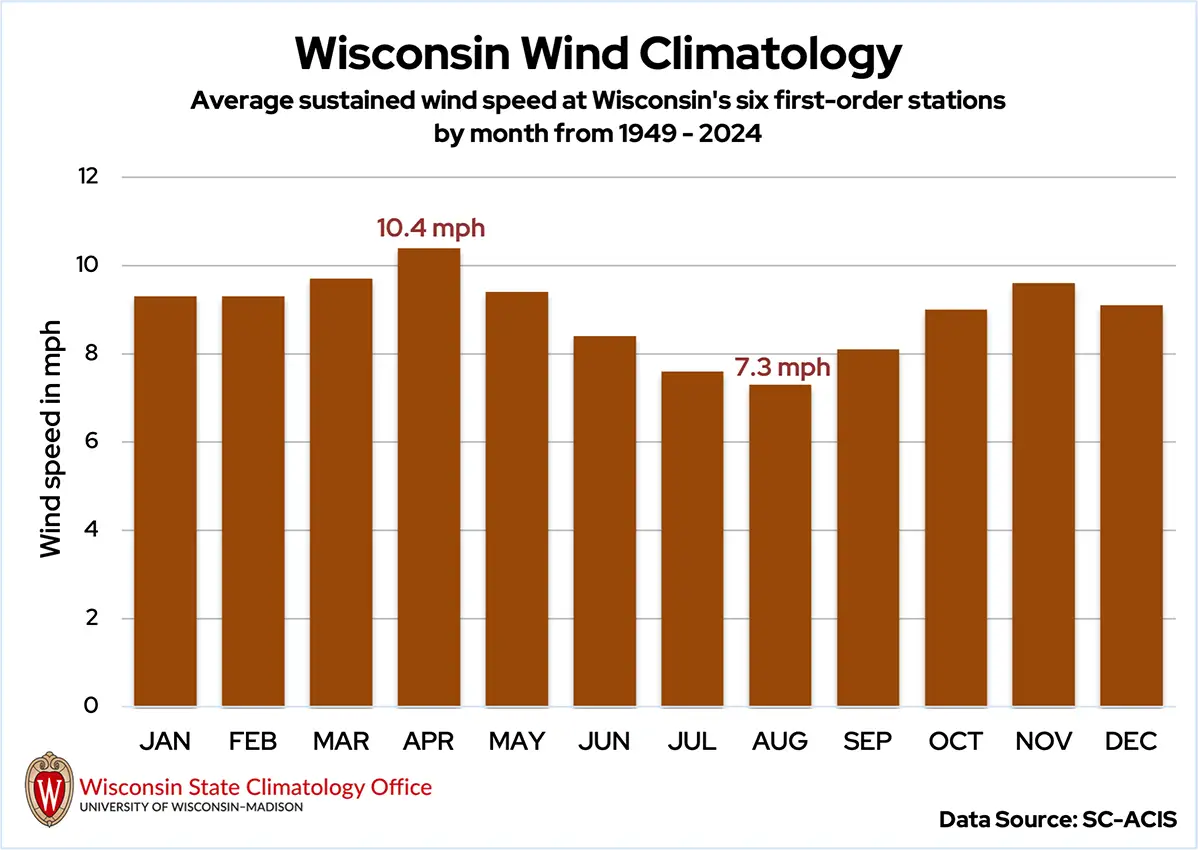
A: April is typically the windiest month in Wisconsin, based on average sustained wind speeds recorded at airport weather stations across the state over the last 75 years (Figure 12). November also sees a jump in wind speeds, while August is consistently the calmest month. Seasonal patterns matter too: spring tends to be windier than summer due to stronger temperature contrasts and more active weather patterns.
Sustained winds — measured as a two-minute average about 30 feet above ground — are influenced by the position of high and low pressure systems and the movement of storms across the Midwest. In spring, storms frequently pass over or near Wisconsin, tightening the pressure gradient and increasing wind speeds. By summer, storm systems shift farther north, relaxing the pressure difference and calming winds across the state.
Q: Is it becoming windier in Wisconsin?
A: It’s complicated. While it might feel like it’s windier these days, some studies suggest that average wind speeds have actually declined since the 1950s. However, long-term comparisons are tricky due to changes in wind sensor heights and types, wind gust duration, land use, and reporting. These factors make it difficult to determine whether observed changes are due to the atmosphere or the instruments measuring the wind. Our office is actively exploring this question and hopes to provide a clearer picture as we dig deeper into the data.
Climate Statistics by Division
Temperature (°F)
| April 2025 | ||
|---|---|---|
| Division | Avg | Dept |
| Northwest | 41.0 | -0.3 |
| North Central | 39.8 | -0.6 |
| Northeast | 40.4 | -0.5 |
| West Central | 44.9 | 0.1 |
| Central | 44.6 | 0.4 |
| East Central | 43.6 | 0.3 |
| Southwest | 46.2 | -0.1 |
| South Central | 46.4 | 0.3 |
| Southeast | 45.6 | 0.2 |
| State | 42.9 | -0.2 |
Heating Degree Days
| April 2025 | Since July 1, 2024 | |||
|---|---|---|---|---|
| Division | Avg | Dept | Avg | Dept |
| Northwest | 720 | 10 | 7,747 | -545 |
| North Central | 756 | 19 | 7,875 | -508 |
| Northeast | 738 | 15 | 7,522 | -542 |
| West Central | 603 | -5 | 7,009 | -552 |
| Central | 612 | -11 | 6,823 | -610 |
| East Central | 642 | -9 | 6,671 | -578 |
| Southwest | 564 | 3 | 6,527 | -475 |
| South Central | 558 | -10 | 6,318 | -562 |
| Southeast | 582 | -5 | 6,257 | -460 |
| State | 612 | -4 | 6,642 | -522 |
Liquid-Equivalent Precipitation (Inches)
| April 2025 | Since Nov. 1, 2024 | |||
|---|---|---|---|---|
| Division | Avg | Dept | Avg | Dept |
| Northwest | 2.75 | -0.06 | 9.98 | 0.49 |
| North Central | 3.73 | 0.81 | 13.27 | 2.87 |
| Northeast | 3.5 | 0.6 | 15.18 | 4.73 |
| West Central | 3.99 | 0.66 | 11.99 | 1.54 |
| Central | 3.43 | 0.08 | 13.89 | 2.93 |
| East Central | 2.57 | -0.6 | 12.38 | 0.94 |
| Southwest | 3.17 | -0.67 | 12.95 | 0.73 |
| South Central | 2.0 | -1.65 | 10.43 | -2.14 |
| Southeast | 2.37 | -1.3 | 10.75 | -2.31 |
| State | 3.17 | -0.03 | 12.33 | 1.45 |
Snowfall (Inches)
| March 2025 | ||
|---|---|---|
| Division | Avg | Dept |
| Northwest | 3.7 | -1.1 |
| North Central | 2.7 | -4.0 |
| Northeast | 2.7 | -3.5 |
| West Central | 1.5 | -1.7 |
| Central | 1.6 | -1.9 |
| East Central | 0.8 | -2.2 |
| Southwest | 0.1 | -1.8 |
| South Central | 0 | -1.5 |
| Southeast | 0 | -1.7 |
| State | 1.9 | -2.3 |
This report is a product of the Wisconsin State Climatology Office. For questions and comments, please contact us by email (stclim@aos.wisc.edu) or phone (608-263-2374).