Wisconsin has been dealing with its first major heatwave of the summer 2025 season. Temperatures topped 90 degrees on multiple days across the Badger State over the past week. Dew points have also been reaching into the 70s, making things feel quite muggy outside!
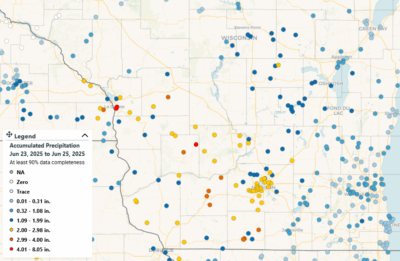
This heatwave was accompanied by a substantial rain event in southern Wisconsin that dropped multiple inches of rainfall between June 22 and 24. Over the past week (June 19-25), most of southwest and south central Wisconsin experienced between 150 and 300 percent of normal precipitation!
What does all this heat and moisture mean for Wisconsin’s field crops?
Crop Progress is Picking Up
As of June 22, corn and soybean emergence in the state was reported to be approximately 95 percent complete. This is where we would expect our crops to be in late June. Winter wheat, another major field crop in the state, is reported at 91 percent headed (meaning that the seed head has fully emerged).
Crop progress is primarily a function of growing degree days (GDD), which is a measure of accumulated heat since the beginning of the growing cycle. We calculate growing degree days by subtracting the base temperature for growth from the daily average temperature. Accumulated GDDs are calculated by adding daily GDD for every day from planting up to the current day. The crops will hit different growth stages after a certain number of GDDs are reached.
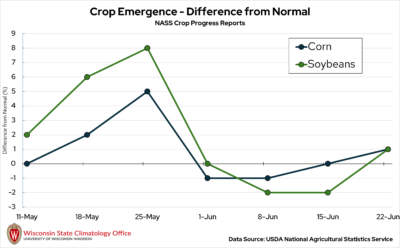
Temperatures in the state during late May and early June were below normal, which led to a reduction in accumulated GDD compared to normal, and thus crop progress slowed down. Corn and soybean emergence were running behind normal from June 1 until June 22 (following several hot days before June 22). On June 22, progress was reported to be slightly above average.
Impacts of Higher Temperatures
Higher temperatures and the crops being in their vegetative phase also mean increased water demand by the crops and the atmosphere. This loss of water to the atmosphere from the crops and soil is what is referred to as evapotranspiration (evaporation + transpiration). The crops release water to the atmosphere through their stomata during photosynthesis (transpiration), and water is evaporated from the soil and plant surfaces during the day.
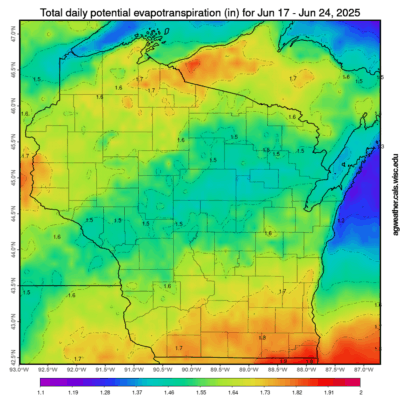
Estimates of the amount of water lost via evapotranspiration over the past week are approximately one to two inches across the state. Loss of water via evapotranspiration typically increases as the temperature rises, but high humidity in the air (such as we have experienced) helps mitigate water loss. Pollination (corn) and flowering (soybean) are critical times for moisture and can greatly reduce yield if there is a major deficit at those stages.
Impacts of Extreme Rain Events
The heavy rainfall that we experienced recently, along with the high humidity, poses some challenges to cropping systems.
The crop canopy is not closed (closed means that the leaves are completely covering the area in between crop rows) in corn and soybean fields at this stage of the season. Thus, there may be bare soil exposed to heavy rainfall, which can lead to erosion issues.
This is the time of year when nitrogen (N) is being applied via sidedressing. Excess moisture in the fields could cause delays in getting N applied. Also, if N has recently been applied, then the potential for leaching is increased with heavy rain events.
The excess moisture and humidity can also create favorable conditions for crop diseases. Wet and humid conditions favor diseases like corn tar spot, soybean white mold, and stripe rust in winter wheat. You can find updates on the current crop disease status in Wisconsin via the Badger Crop Doc news articles.
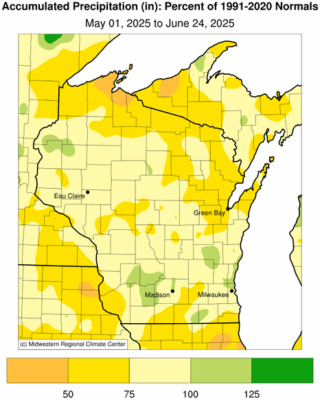
However, despite the potential challenges, the rainfall over the last several days has been more of a blessing than a curse. Precipitation totals across most of Wisconsin since the beginning of May had been below average before last week.
As of June 24, precipitation totals are now closer to average or even above average where totals were higher (since May 1). You can see how current soil moisture levels were impacted by the recent rainfall by exploring data for your nearest Wisconet station.
Want to learn more?
If you would like to read more about weather impacts on cropping systems in Wisconsin, please check out the Ag Weather Outlook for Wisconsin (AgWOW). AgWOW is published weekly throughout the growing season in collaboration with the UW-Madison Division of Extension’s Crops & Soils Program.
This is a product of the Wisconsin State Climatology Office. For questions and comments, please contact us by email (stclim@aos.wisc.edu) or phone (608-263-2374).