The first month of winter began with a burst of severe cold and lingering November snow, then flipped to temperature swings, gusty storms, and mixed precipitation.
A Cold Blast to Start
December wasted no time reminding Wisconsinites what winter can deliver, opening with an unusually intense cold spell.
From December 1 to 14, temperatures across Wisconsin averaged just 12 degrees — about 12 degrees colder than normal for that time of year — producing conditions more typical of mid-January than early December.
Over 100 daily low minimum and maximum temperature records were tied or broken in Wisconsin during the first two weeks of the month (Figure 1).
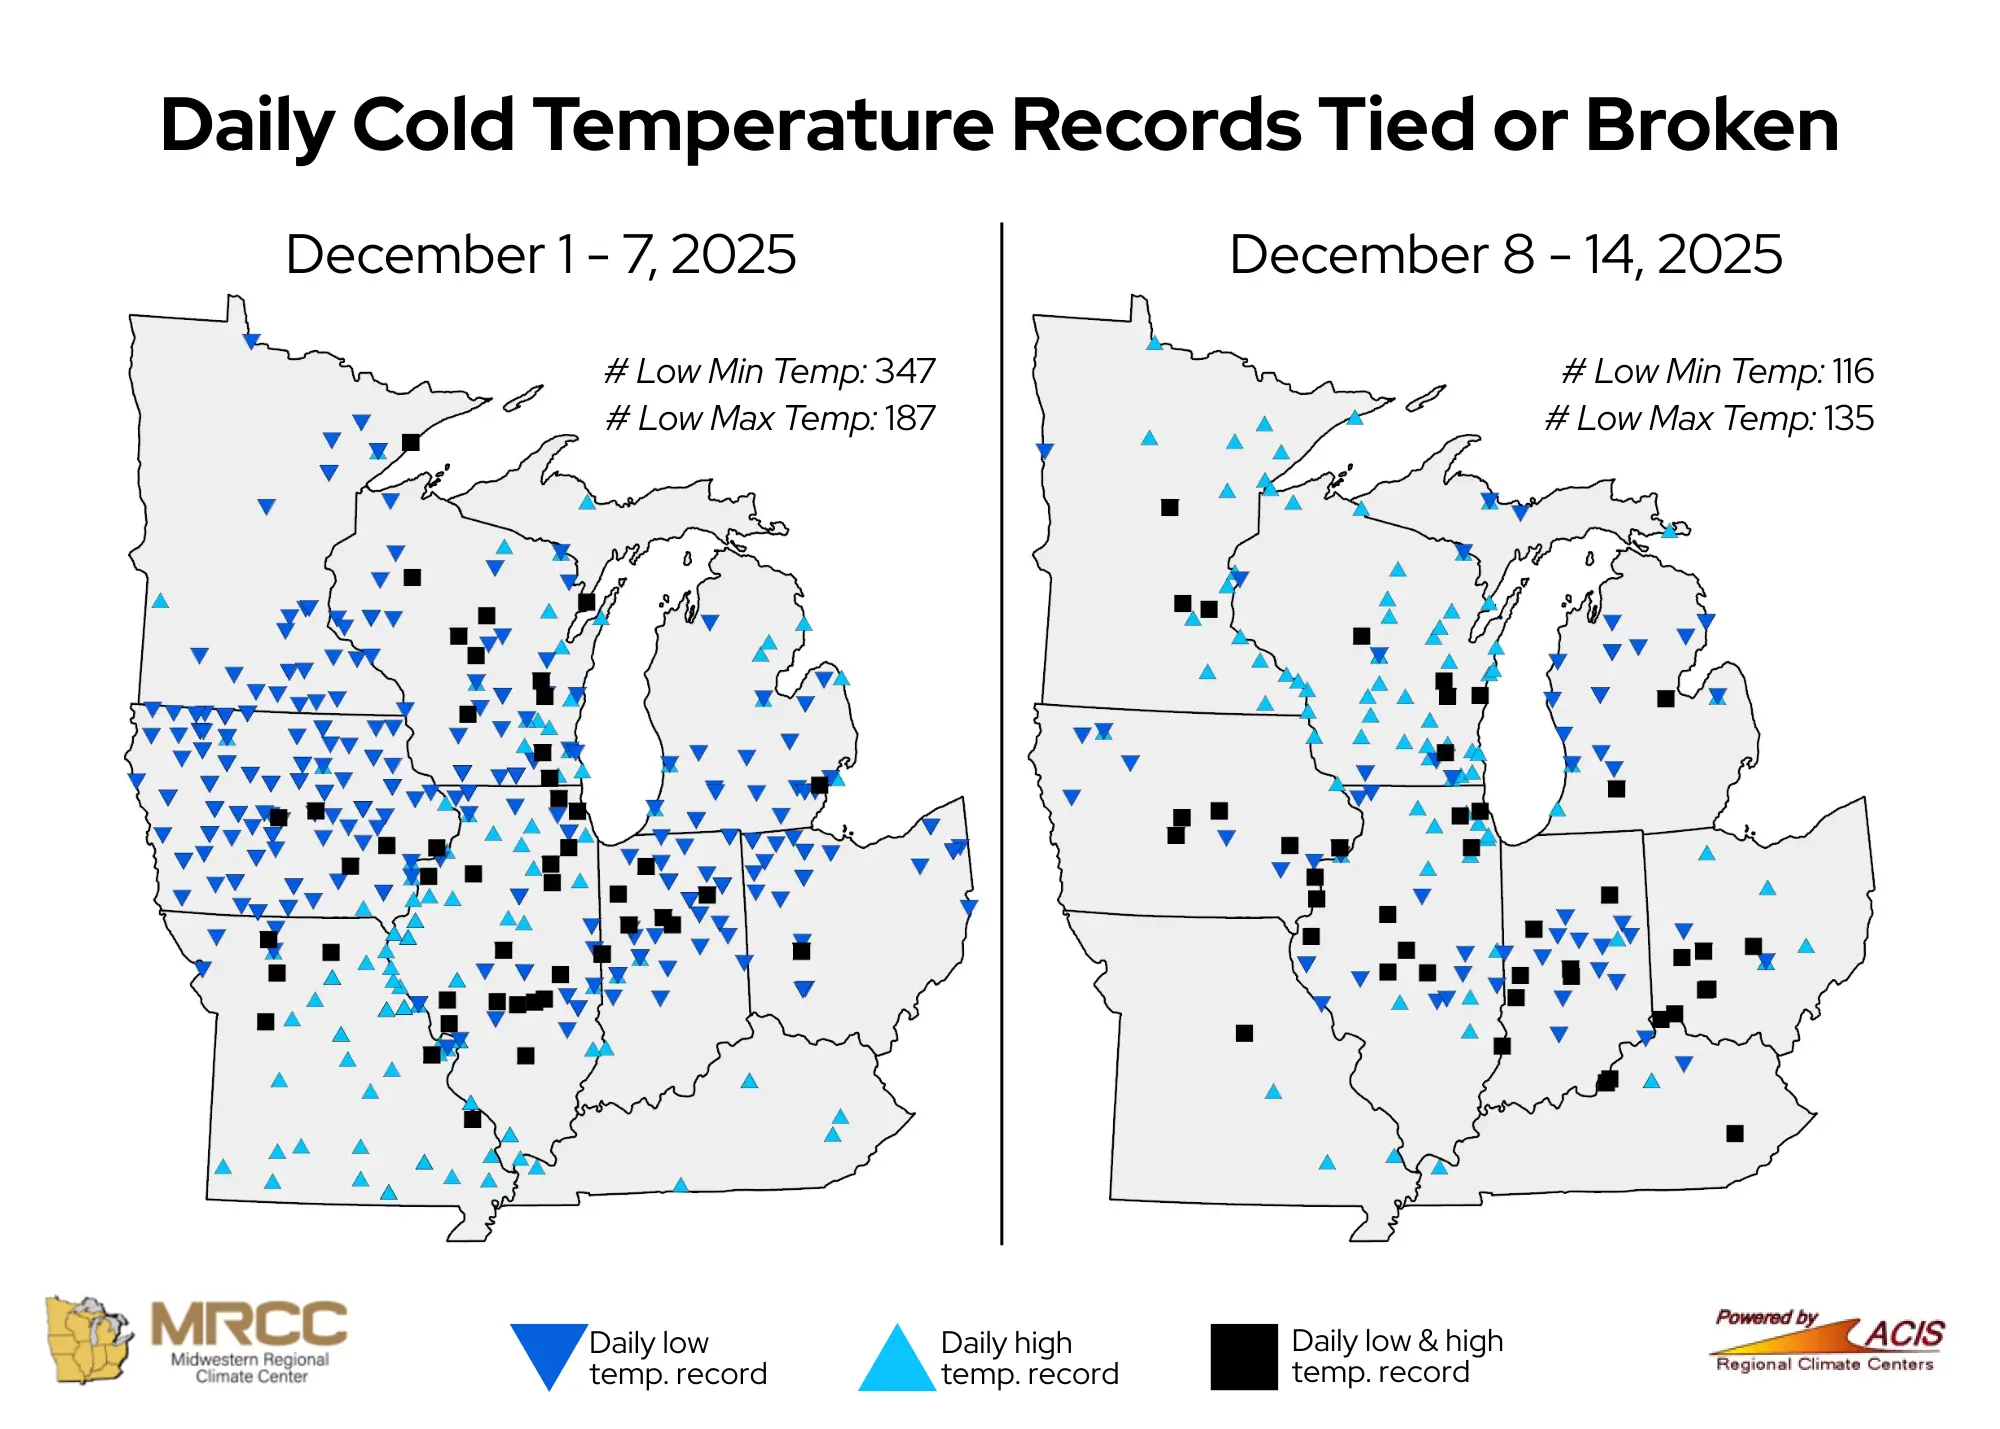
Ashland (Ashland County) did not see above-freezing temperatures for the 14-day period. This is the longest sub-freezing stretch in Ashland for the first two weeks of December since 2010.
Between December 1 and 8, not a single Wisconet station in the state climbed above freezing. Many locations recorded their first sub-zero temperatures of the season on December 4, including Madison, which saw its earliest sub-zero reading since 1985.
The cold peaked around December 14, when daytime highs struggled to surpass the single digits in some areas and overnight lows plunged well below zero in the north. Milwaukee saw its earliest single-digit high since 1995 on December 14. Eagle River (Vilas County) set a daily record low minimum temperature of minus 12 degrees on December 14. Butternut (Ashland County) recorded the state’s coldest temperature of the month — a frigid 23 degrees below zero.
Prolonged early-December cold coincided with a nearly two-times increase in emergency department visits for cold-related illness. Increases linked to homelessness and carbon monoxide poisoning were also noted by the Department of Health Services. Note that the data are considered preliminary and subject to change because of how emergency department data are collected and reported.
A sharp warmup followed the Arctic blast, with rain, melting snow, and strong winds. In stark contrast to just days earlier, Eagle River reached a near-record daily high of 38 degrees on December 17 and 18. For southern Wisconsin, the Racine Batten Airport (Racine County) was one of two locations to record the state’s warmest temperature of the month — 50 degrees on December 18.
However, it wasn’t long until temperatures dropped roughly 20 to 40 degrees between the early morning hours of December 18 and 19.
Then, the final days before Christmas felt more like late fall, running about 10 to 12 degrees warmer than normal across the state. Paddock Lake (Kenosha County) reported 50 degrees on December 23.
But that mild stretch ended abruptly on December 28, when a cold front swept through. Wisconsin returned to more seasonable winter conditions to close out the year.
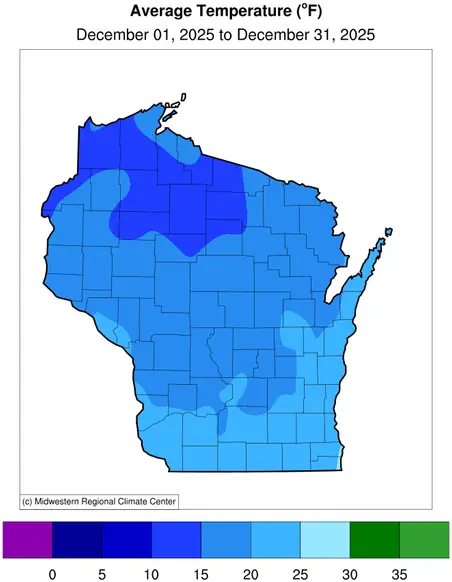
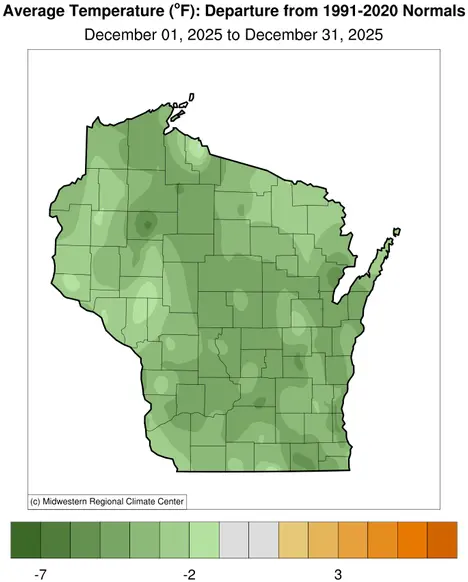
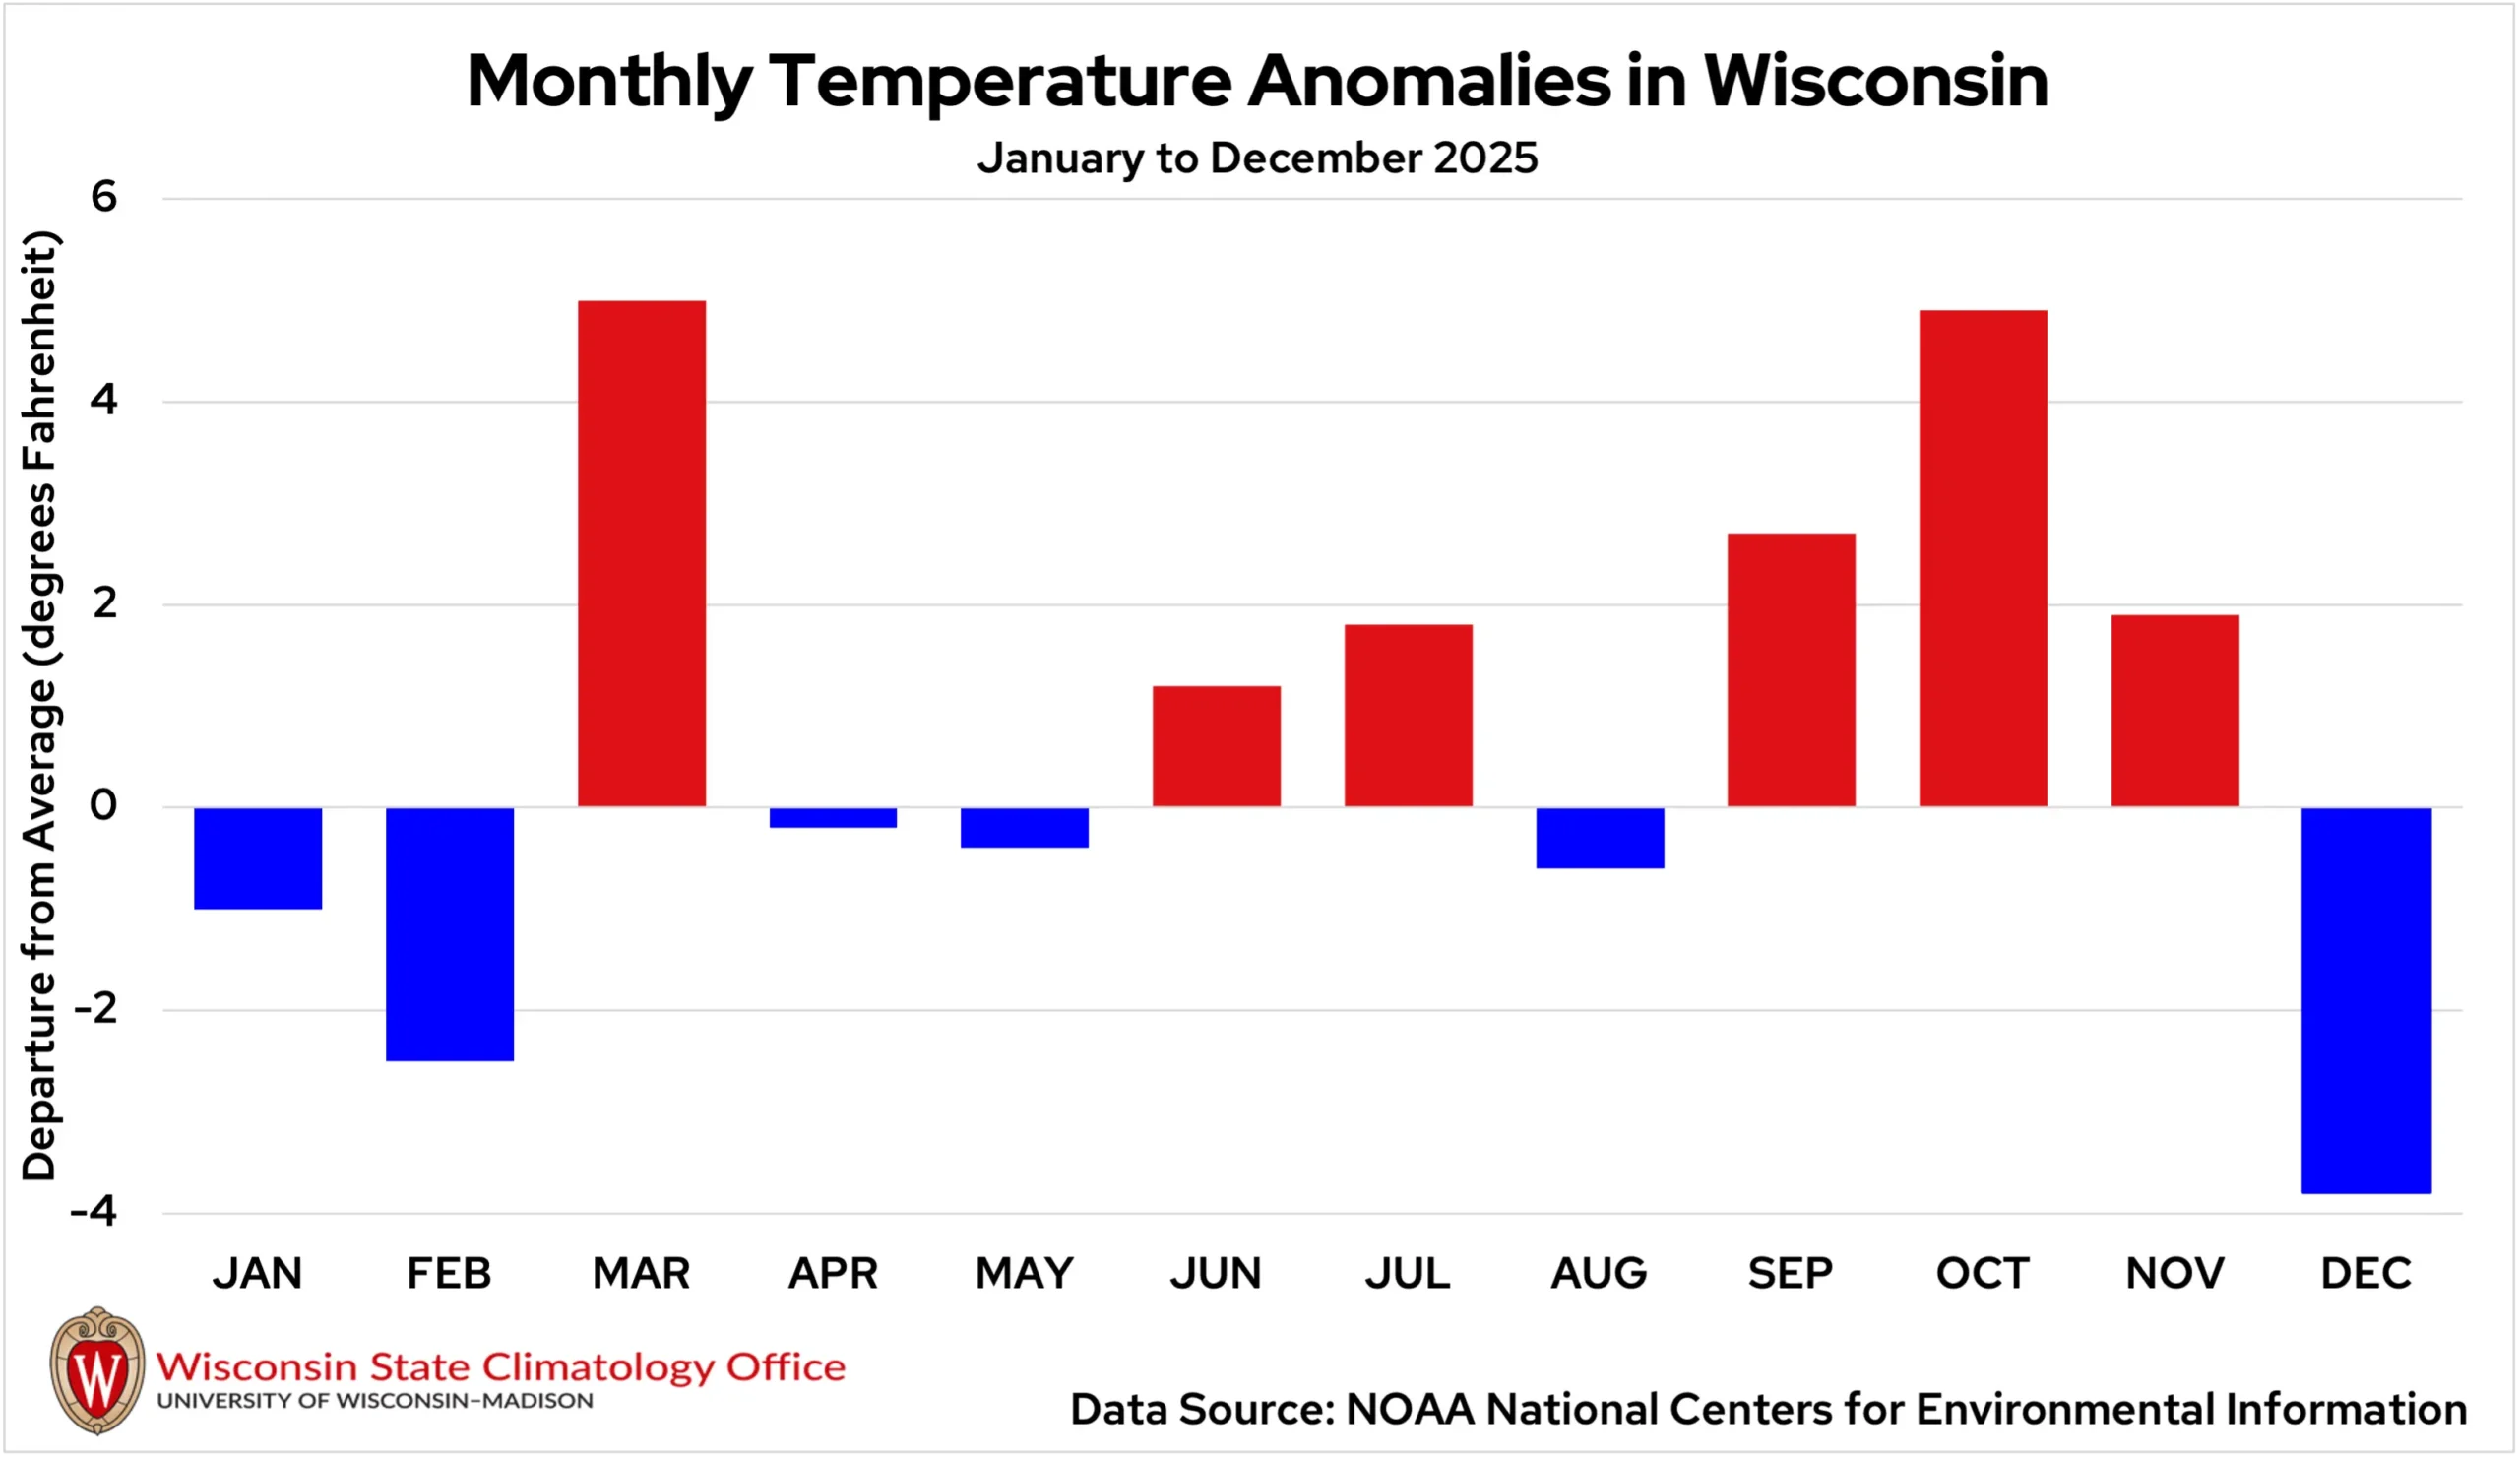
Overall, December averaged 17.6 degrees, 3.8 degrees colder than normal (Figure 2). This marks the first cooler-than-normal month since August and the coldest temperature anomaly the state has seen since April 2022 (Figure 3).
Snow Brings High Hopes
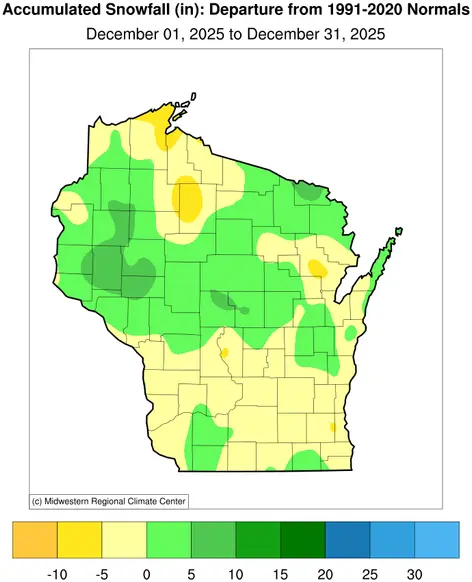
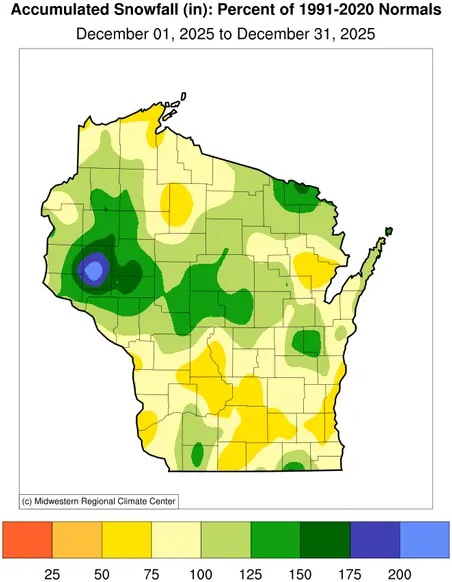
After late November snowstorms gave Wisconsin its snowiest start to December since 2003, snow-enthusiasts had high hopes for what the rest of the month might bring. Unfortunately, many regions were left wanting as numerous Alberta Clippers amounted to measly snow totals (Figure 4).
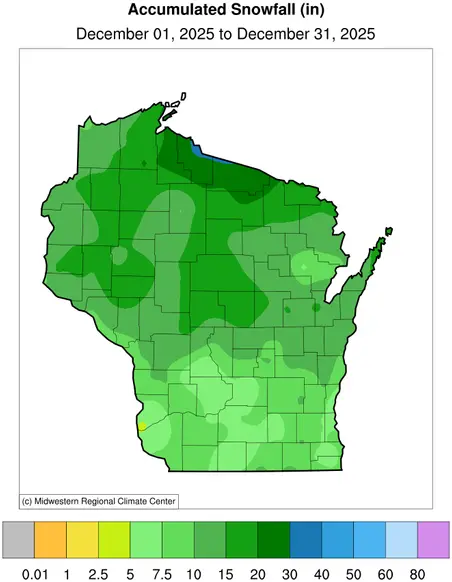
From December 9 to 10, central Wisconsin received a half-foot of fresh snow. This was welcomed snowfall after the region had missed out on the big late November storms.
A low-pressure system on December 18 proved to be more of a nuisance than a snow-producer as it moved through Wisconsin. Mild temperatures during the morning allowed for drizzle and fog across much of the state. A cold front sweeping through dropped temperatures, creating a flash freeze in parts of Sawyer, Price, and Ashland counties. Light snow fell over the icy roads, amounting to isolated totals of three to six inches in the far north. The rest of the state felt the freeze, but only saw around one inch of snow.
As early holiday travelers hit the roads on December 22, those in western and central Wisconsin had icy conditions to contend with. A stationary front brought freezing rain and a wintry mix to the region during the morning, leading to slide-offs and crashes on the busy interstates.
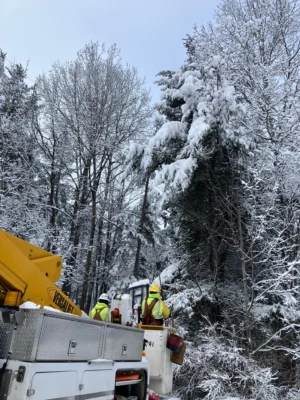
Following the Christmas holiday, much of the state saw rain turn to sleet, then snow as a cold front pushed through on December 28. Behind the front, strong winds took down powerlines that were already weighed down by ice. Widespread power outages were seen in northern Wisconsin (Image 1). Snow blowing across open roads created additional icing and lowered visibility for travelers.
The highest snow totals from this storm were seen in far northern Wisconsin. The town of Saxon in Iron County reported 17 inches. This was the largest 24-hour snowfall across Wisconsin in December 2025. Totals around a half foot were measured in central Wisconsin. The Chippewa Valley Regional Airport in Eau Claire recorded 8.5 inches, nearly doubling the city’s daily record of 4.4 inches from December 28, 1966. At the end of the month, Iron County had the deepest snow cover in the state with 23 inches.
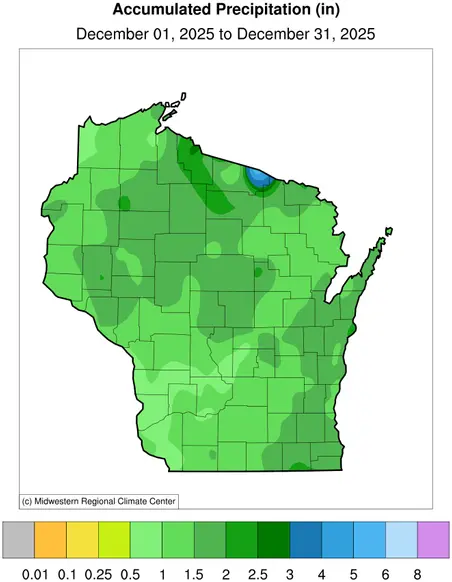
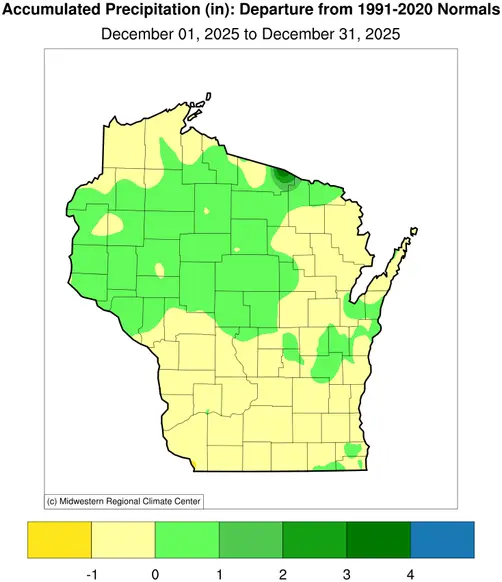
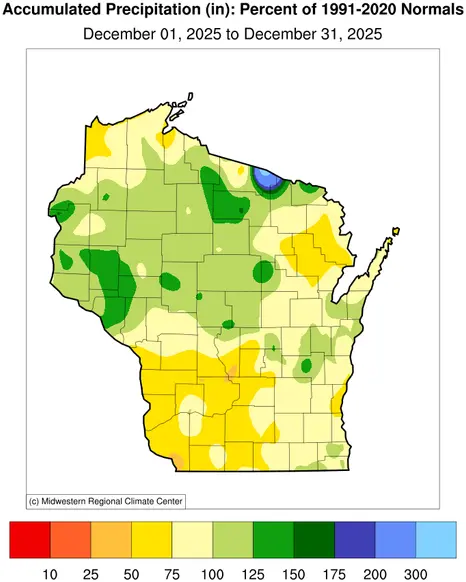
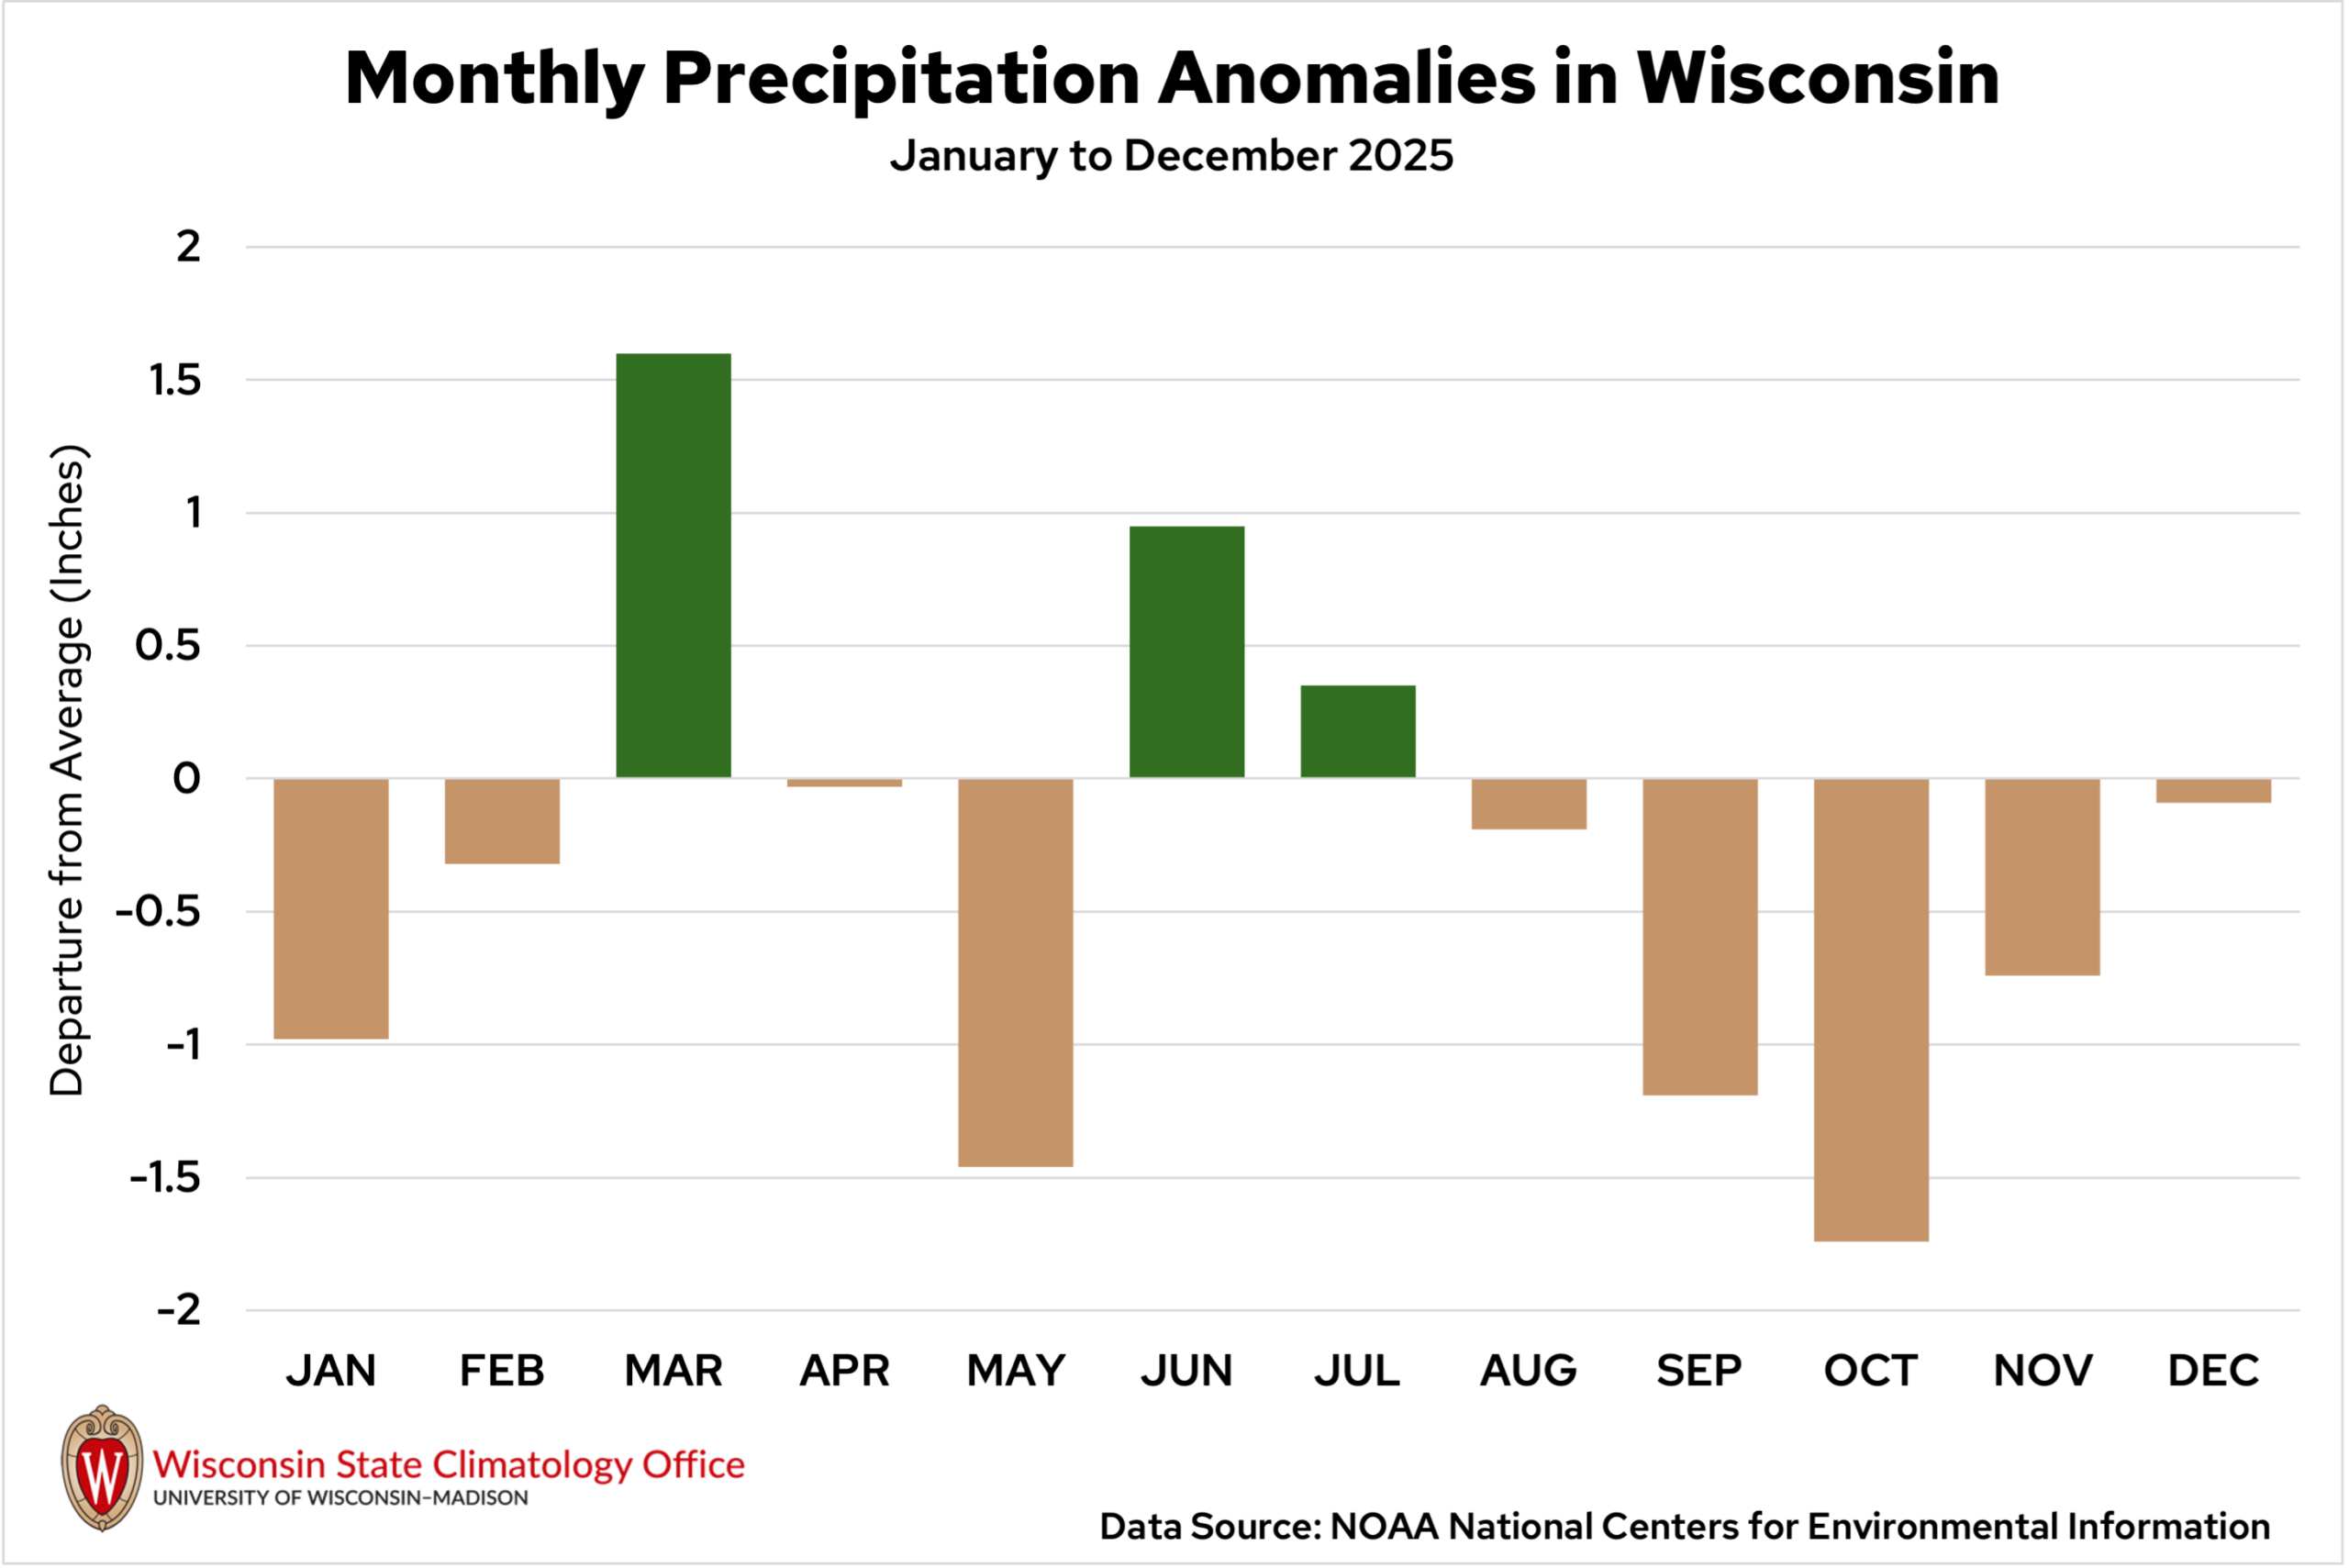
As a whole, the month of December was slightly drier than average across Wisconsin. The statewide average precipitation total was 1.43 inches — just 0.09 inches drier than average (Figure 5).
Drought Doesn’t Budge
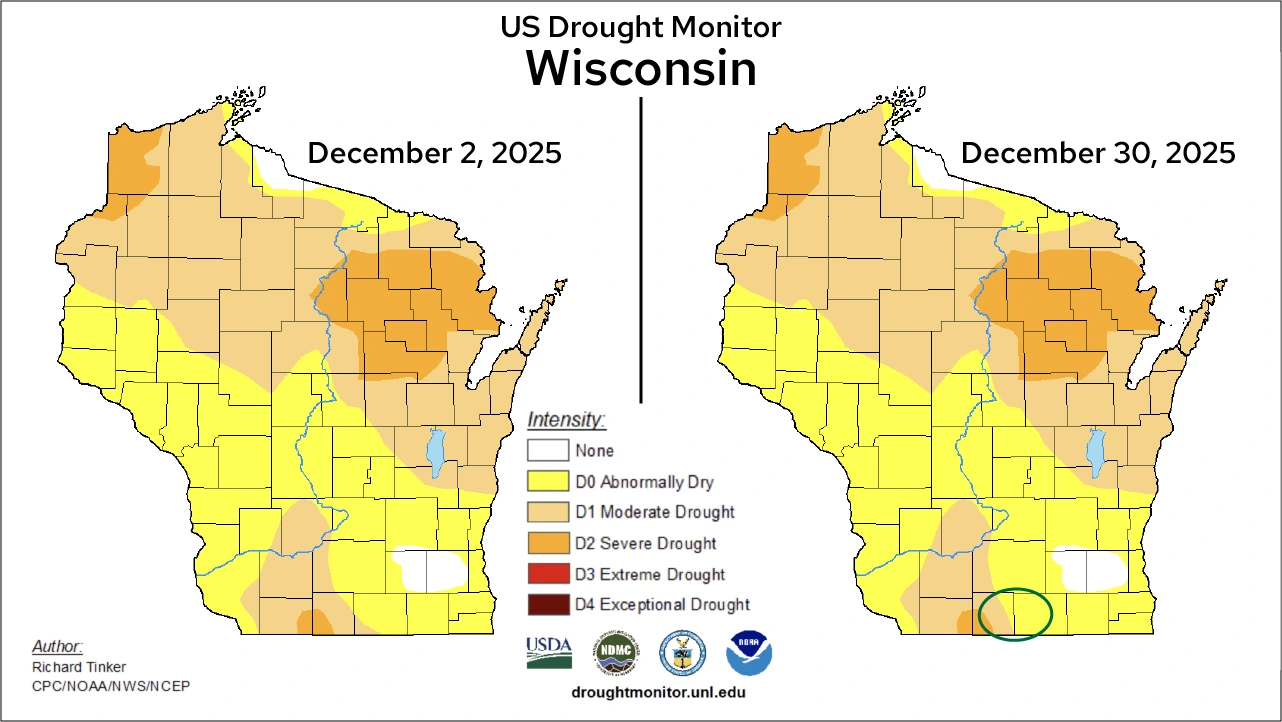
The month of December began with areas of severe drought (D2) in parts of northwest, northeast, and south central Wisconsin. Nearly the entire state was abnormally dry (D0), while moderate drought (D1) was widespread across the northern region. By the end of the month, the U.S. Drought Monitor map was nearly unchanged. Only a small reduction in drought coverage was observed in part of Green and Rock counties in southern Wisconsin (Figure 6).
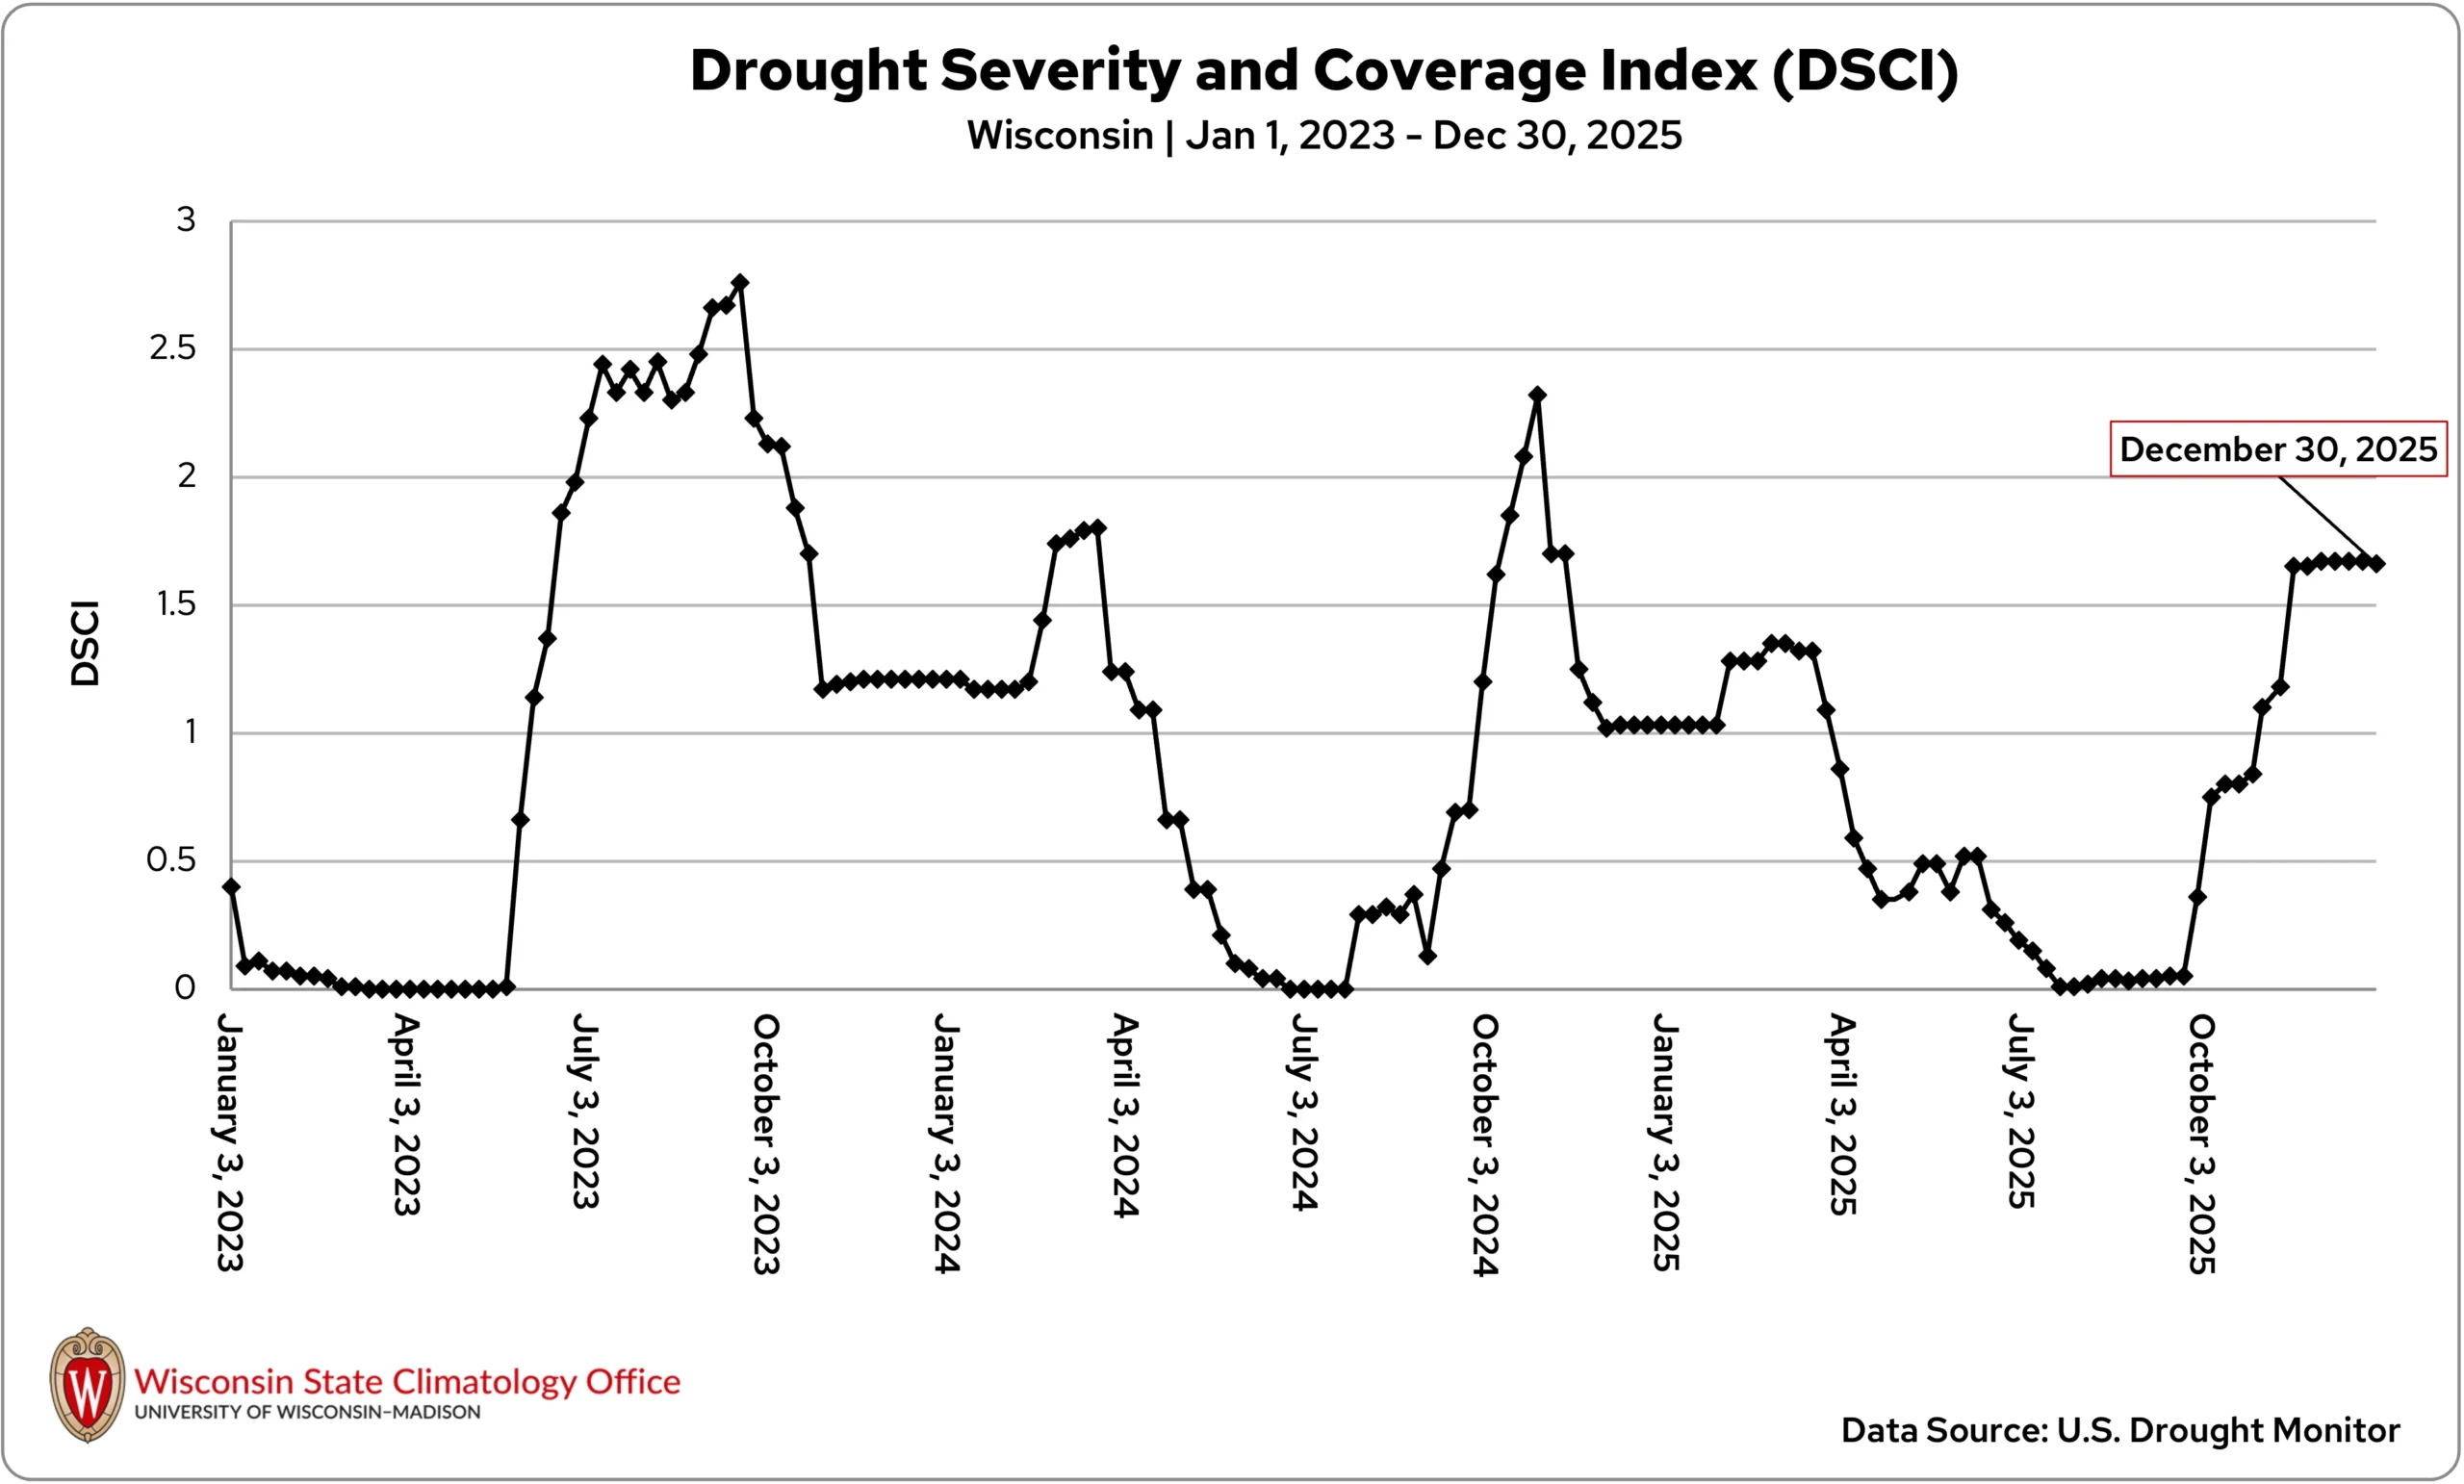
Wisconsin’s Drought Severity and Coverage Index (DSCI) remained virtually unchanged through December (Figure 7). With a value of 166, this is Wisconsin’s highest DSCI value at the end of a year since December 2012.
Tracking Lake Ice
The State Climatology Office continued its long-standing monitoring of ice conditions on Madison’s lakes — Mendota, Monona, and Wingra — each of which responded differently to December’s changing weather.
The smallest of the three lakes, Lake Wingra, froze over early in the month, becoming ice-covered by December 1. This was about two days later than its typical (median) freeze date, following the chilly end to November.
Lake Monona followed on December 12, roughly three days earlier than what is typical, as persistent cold held on through mid-December.
However, Lake Mendota proved more stubborn — not completely unexpected, being the largest of the three lakes. Despite the early-month cold, winds kept much of the lake ice-free. A mid- to late-month warmup brought rain and gusty conditions that halted ice formation.
Although colder weather helped rebuild some ice in late December, Mendota was not fully frozen before the end of the year. The lake ultimately froze on New Year’s Day, 2026. For reference, Mendota’s median freeze date is December 21.
Hold Onto Your Hat!
December was a notably windy month across Wisconsin, with several strong storm systems bringing frequent gusty conditions.
The windiest stretch occurred from mid-to-late December, with gusts exceeding 40 miles per hour at several Wisconet stations. Blanchardville (Green County) measured a 42.3 mile per hour gust on December 18, De Pere (Brown County) a 51.9 mile per hour gust on December 20, and a 45.2 mile per hour gust in Lost Lake (Dodge County) on December 29.
Overall, the month ranked among the gustiest Decembers on record in the state. At all six of Wisconsin’s first-order weather stations, December 2025 was one of the four windiest Decembers since 1991, based on average wind gusts.
Climate Corner
Any true Midwesterner knows that when it comes to winter weather, wind makes all the difference. Even though we’ve been feeling winter’s bite for decades, the “wind chill factor” is a relatively new metric incorporated by the NWS in the last 30 years. Our very own “Dr. Data” delves into Wisconsin’s most extreme chills in this month’s Climate Ed-ucation.
Climate Stats by Division: December 2025
Temperature (degrees Fahrenheit)
Color Key
-
Dark blue: Record coolest
-
Royal blue: Bottom ⅒
-
Light blue: Bottom ⅓
-
White: Normal
-
Light orange: Top ⅓
-
Orange: Top ⅒
-
Red: Record warmest
| Division | Avg | Dept |
|---|---|---|
| Northwest | 14.4Normal | -3.9Normal |
| North Central | 15.0:Normal | -3.7:Normal |
| Northeast | 16.8:Normal | -3.9:Normal |
| West Central | 17.5:Normal | -3.5:Normal |
| Central | 18.4:Normal | -4.0:Normal |
| East Central | 20.4:Normal | -3.9:Normal |
| Southwest | 20.2:Normal | -3.8:Normal |
| South Central | 21.1:Normal | -3.8:Normal |
| Southeast | 22.3:Normal | -4.0:Normal |
| State | 17.6:Normal | -3.8:Normal |
Snowfall (inches)
Color Key
-
Purple: Below Normal
-
White: Normal
-
Beige: Above Normal
| Division | Avg | Dept |
|---|---|---|
| Northwest | 16.1Above Normal | 2.2Above Normal |
| North Central | 18.9:Above Normal | 1.6:Above Normal |
| Northeast | 12.3:Below Normal | -0.3:Below Normal |
| West Central | 13.3:Above Normal | 2.8:Above Normal |
| Central | 9.9:Below Normal | -1.2:Below Normal |
| East Central | 11.4:Above Normal | 0.3:Above Normal |
| Southwest | 7.5:Below Normal | -2.6:Below Normal |
| South Central | 7.4:Below Normal | -2.9:Below Normal |
| Southeast | 7.9:Below Normal | -1.9:Below Normal |
| State | 12.9:Above Normal | 0.3:Above Normal |
Liquid-Equivalent Precipitation (Inches)
Color Key
-
Dark brown: Record driest
-
Light brown: Bottom ⅒
-
Beige: Bottom ⅓
-
White: Normal
-
Light green: Top ⅓
-
Green: Top ⅒
-
Dark green: Record wettest
| December 2025 | Since Nov. 1, 2025 | |||
|---|---|---|---|---|
| Division | Avg | Dept | Avg | Dept |
| Northwest | 1.48: Top ⅓ | 0.14: Top ⅓ | 2.88: Normal | -0.29: Normal |
| North Central | 1.77: Top ⅓ | 0.25: Top ⅓ | 3.19: Normal | -0.29: Normal |
| Northeast | 1.43: Normal | -0.13: Normal | 2.62: Normal | -0.91: Normal |
| West Central | 1.30: Normal | -0.03: Normal | 2.67: Normal | -0.50: Normal |
| Central | 1.30: Normal | -0.23: Normal | 2.47: Bottom ⅓ | -0.98: Bottom ⅓ |
| East Central | 1.58: Normal | -0.09: Normal | 2.60: Bottom ⅓ | -1.16: Bottom ⅓ |
| Southwest | 0.93: Bottom ⅓ | -0.63: Bottom ⅓ | 2.27: Bottom ⅓ | -1.48: Bottom ⅓ |
| South Central | 1.20:Normal | -0.51:Normal | 2.52: Bottom ⅓ | -1.43: Bottom ⅓ |
| Southeast | 1.68: Normal | -0.19:Normal | 3.20 Normal | -0.88 Normal |
| State | 1.43:Normal | -0.09Normal | 2.75 Normal | -0.76 Normal |
Monthly, seasonal, and annual temperature and precipitation values and rankings published in this report are from NOAA’s National Centers for Environmental Information at the time of posting this climate summary. Values and rankings can change after publishing our climate summaries. To check the most recent values and rankings, visit NOAA’s National Centers for Environmental Information Climate at a Glance Tool.
This report is a product of the Wisconsin State Climatology Office. For questions and comments, please contact us by email (stclim@aos.wisc.edu) or phone (608-263-2374).