Climate change is often described in terms of numbers — degrees of warming or inches of rainfall — but those numbers can be hard to picture. What does it feel like for Wisconsin’s climate to warm by a few degrees or for precipitation patterns to shift over time?
The Analog Climate Explorer (ACE), developed by Nelson Institute for Environmental Studies student Courtney Vanorio in collaboration with the Wisconsin State Climatology Office, helps make those changes more understandable.
Using county-level climate data from NOAA’s National Centers for Environmental Information, ACE finds modern-day “analogs” — places across the United States that currently experience the conditions that a Wisconsin county experienced in the past.
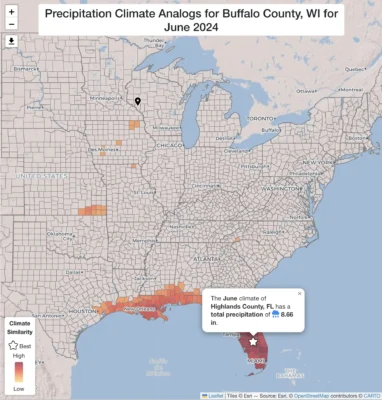
For example, Buffalo County’s total precipitation in June of 2024 most closely resembles the present-day precipitation average of Highlands County, Florida!
That month, Wisconsin experienced unusually wet conditions, ranking as the state’s third-wettest June on record. The analog map vividly shows just how tropical Wisconsin’s climate felt that month.
You can explore annual, seasonal, or monthly data and focus on temperature and precipitation together or individually.
With data reaching back to 1895, ACE lets users see how Wisconsin’s climate has changed over more than a century — offering a glimpse of the conditions our ancestors experienced when they first settled here.
By linking Wisconsin’s past conditions to present-day climates elsewhere, ACE helps users interpret the magnitude of climate variations and changes over time. It’s a tool that bridges data and experience, providing a fresh way to understand how our state’s climate has evolved.
Explore the Analog Climate Explorer Watch the Tutorial
This is a product of the Wisconsin State Climatology Office. For questions and comments, please contact us by email (stclim@aos.wisc.edu) or phone (608-263-2374).