February encapsulated the unpredictability of Wisconsin’s winter weather, as extreme cold gave way to a surprising burst of warmth, while snowstorms transformed the landscape into a winter wonderland.
A Chilly Month
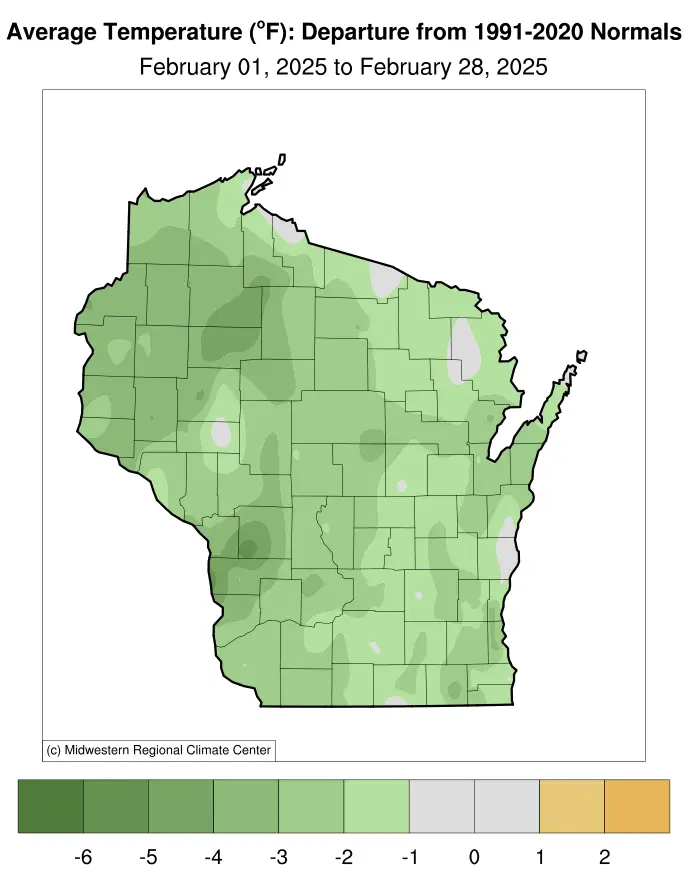
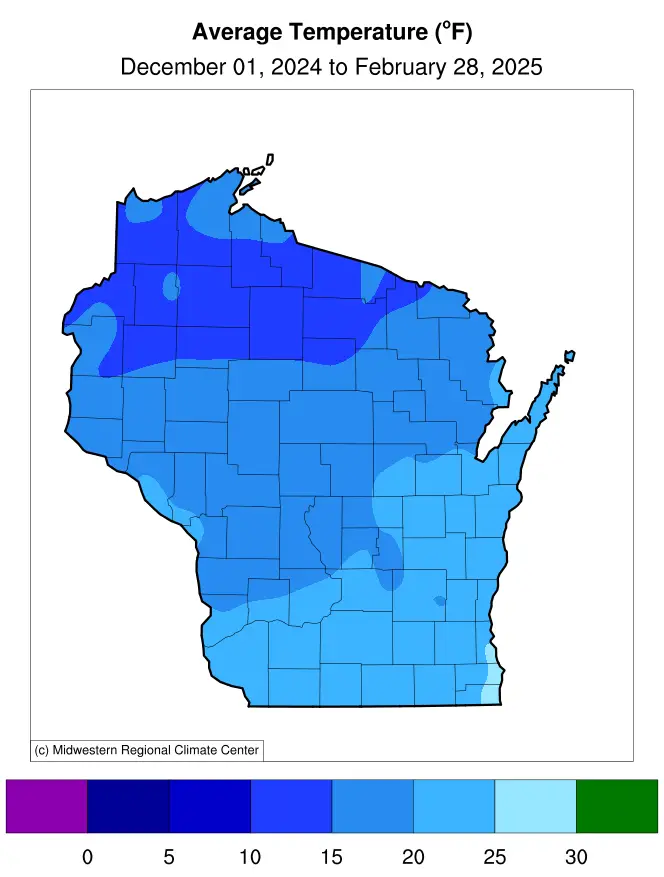
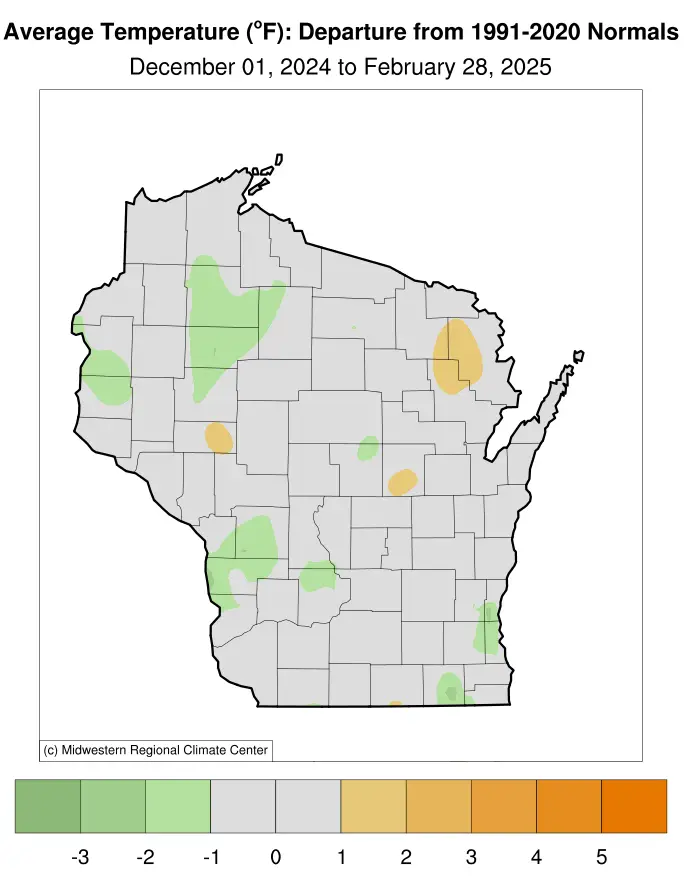
February in Wisconsin was marked by an impressive cold stretch followed by a sudden burst of warmth to close out the month. The state’s average temperature for the month was 16.6 degrees (Fahrenheit), just below the 1991 to 2020 normal of 19.2 degrees (Figure 1). This made for a rare instance of below-normal temperatures in recent years – it was only the fourth below-normal month since the start of 2023. For the winter overall (December through February), the average temperature was 18.1 degrees, just 0.4 degrees below normal (Figure 2).
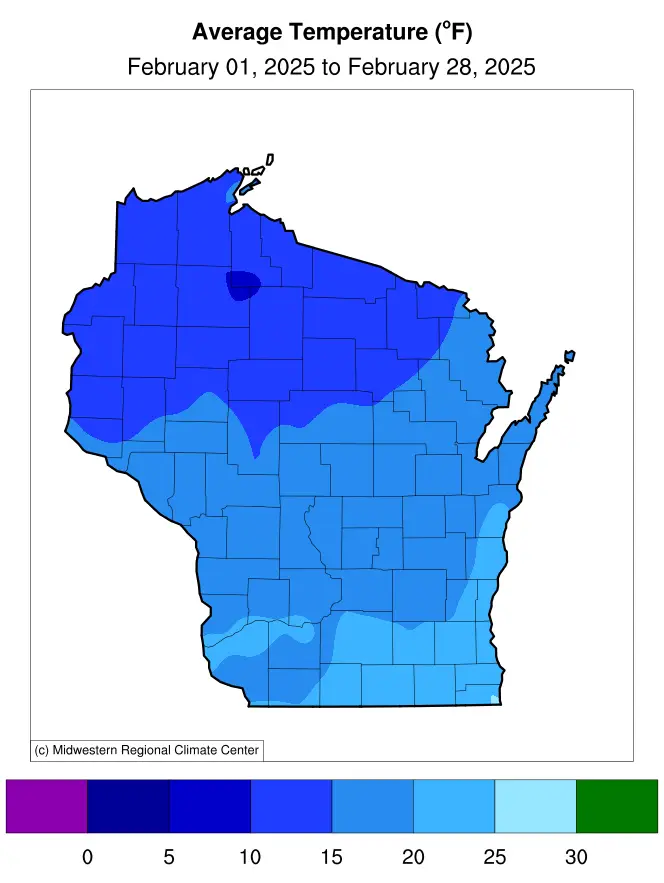
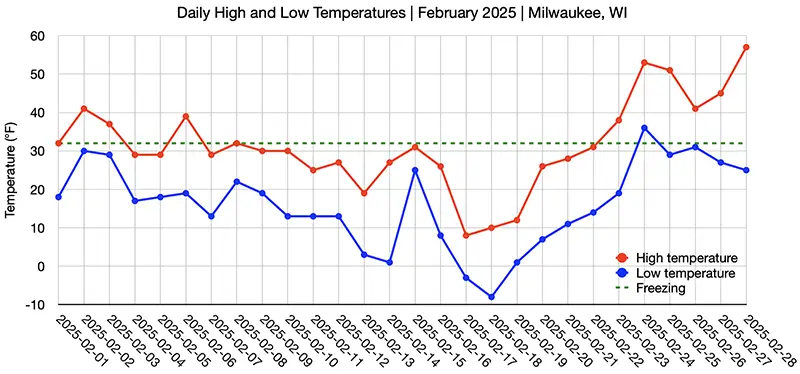
Although February began with sustained cold, featuring subfreezing highs for at least 15 consecutive days across much of the state, the month ended on an entirely different note (Figure 3). After February 23, temperatures surged, with the statewide high temperature for February reaching 59 degrees on February 28 in Kenosha (Kenosha County), marking a stark contrast to the extreme cold earlier in the month. Wisconsin’s lowest temperature of February, minus 29 degrees, was recorded in Couderay (Sawyer County) on February 18.
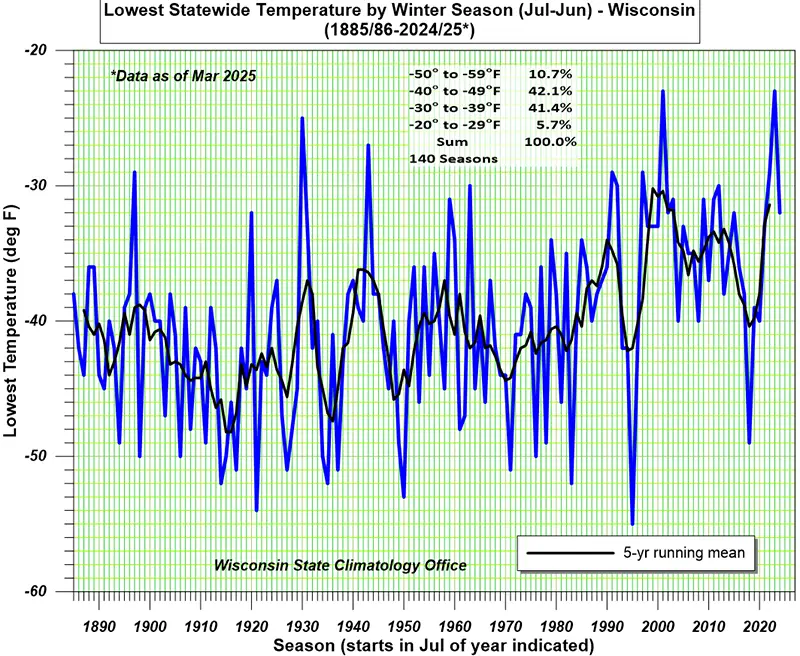
For context, Montana had one of its top 15 coldest Februaries on record, with an average of 13.5 degrees compared to their normal 23.5 degrees. This makes Wisconsin’s slightly colder-than-normal temperatures less extreme by comparison. Even so, Wisconsin’s coldest winter temperatures are warming. This winter’s minimum of minus 32 degrees in Butternut (Ashland County) on January 20 was warmer than 89 percent of all winters since 1885, signaling a shift in how extreme cold behaves in the region (Figure 4). In the end, winter averaged 18.1 degrees, just 0.4 degrees below normal.
Dry Spell Continues
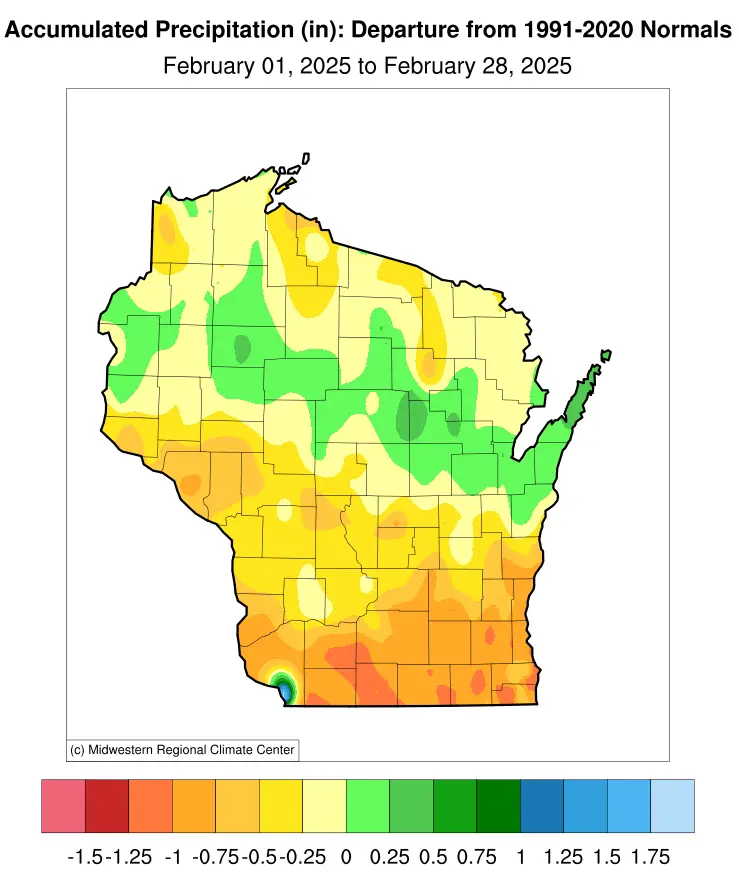
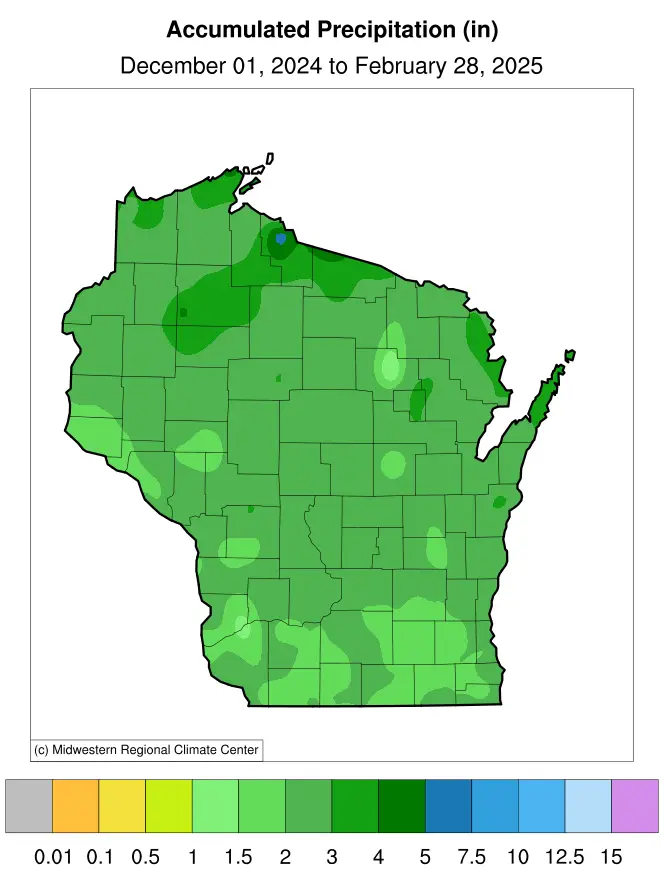
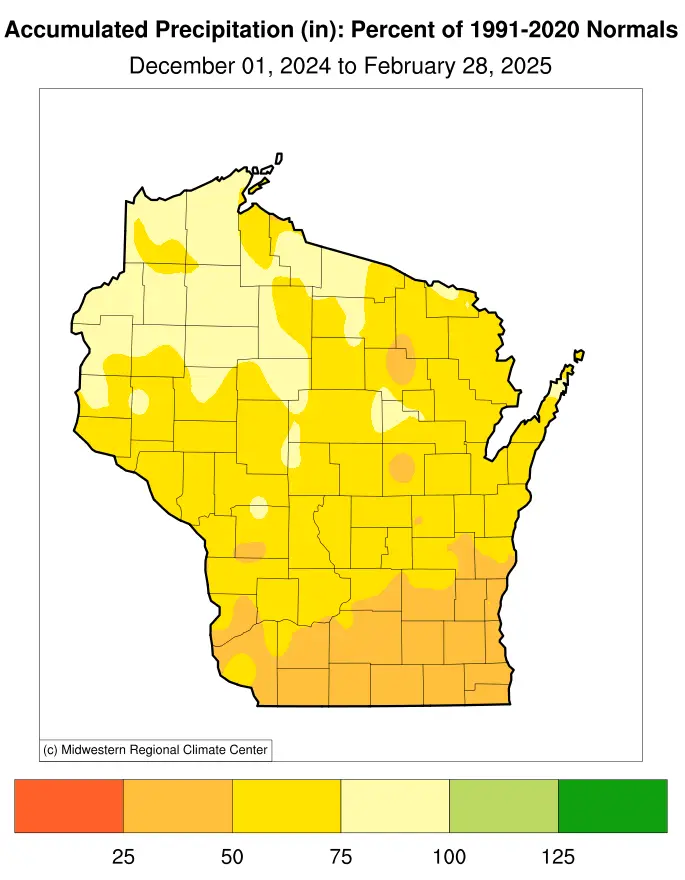
Wisconsin saw another relatively dry month in February, with statewide precipitation (rain plus melted snow) averaging 0.84 inches, falling 0.28 inches short of the 1991 to 2020 normal. Despite this deficit, the month ranked near normal in historical records dating back to 1895. Looking at precipitation departures for February, much of the state received below-normal precipitation, especially in southern and central Wisconsin. The percent-of-normal precipitation map highlights these deficits, with some areas seeing totals at 50 percent or less of their typical February precipitation (Figure 5).
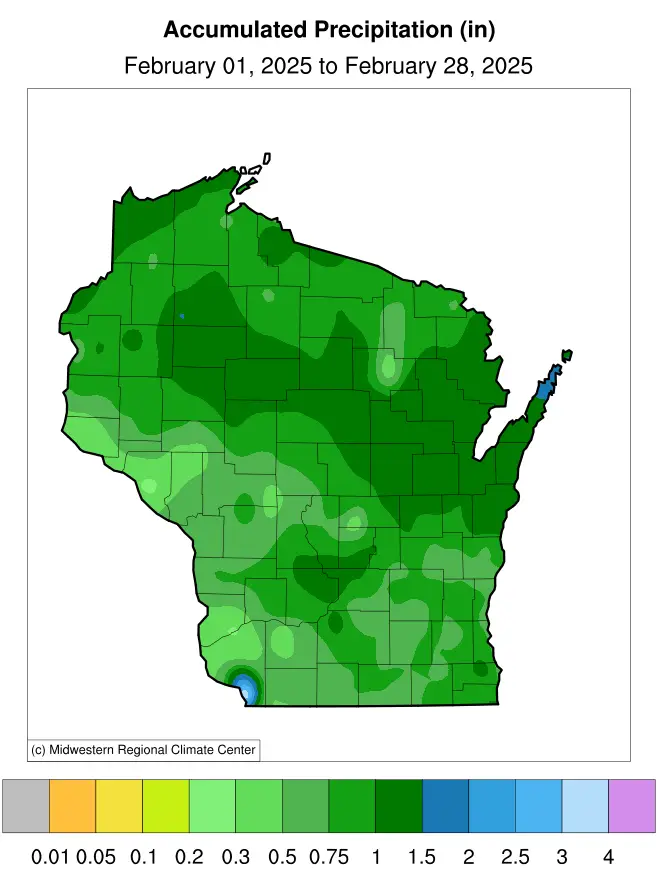
In contrast, portions of northern Wisconsin experienced near-normal conditions, with isolated spots even slightly above average. While precipitation was generally sparse, February did bring at least a couple notable heavy rainfall events. The maximum 24-hour precipitation total for the month was 1.36 inches, recorded in Ephraim (Door County) on February 3. Florence (Florence County) also received a noteworthy 0.9 inches on February 20.
When looking at the full winter season, dryness was very pronounced. The December through February precipitation total of 2.33 inches was well below the normal of 3.9 inches, making it the 18th driest winter on record. Most of the state received 50 to 75 percent of normal precipitation for the entire winter, with the driest conditions in central and southern Wisconsin (Figure 6). The lack of precipitation throughout the winter season was particularly evident in the combined January through February period, which ranked as the 11th driest on record for the state.
Snow, Finally
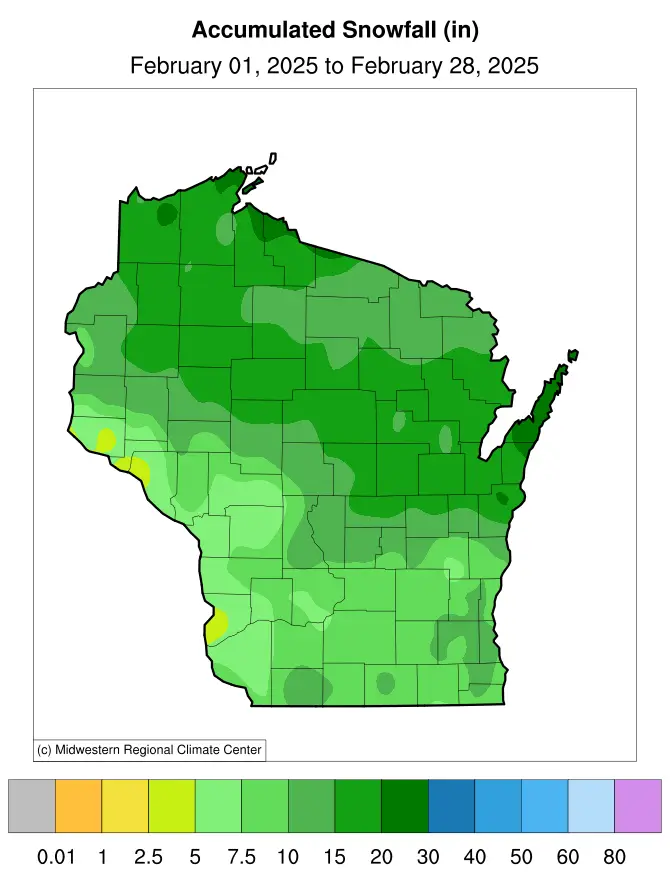
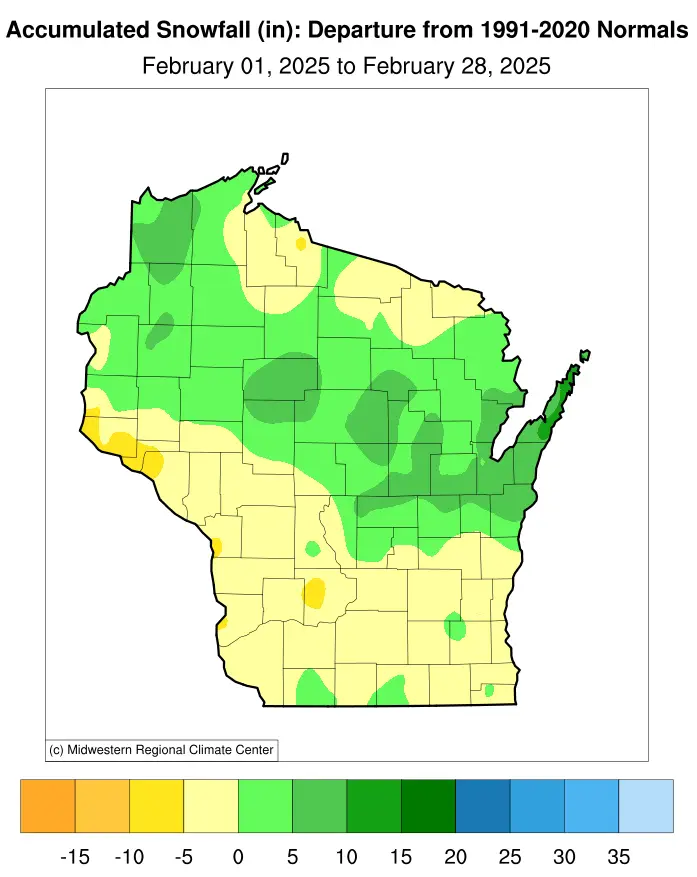
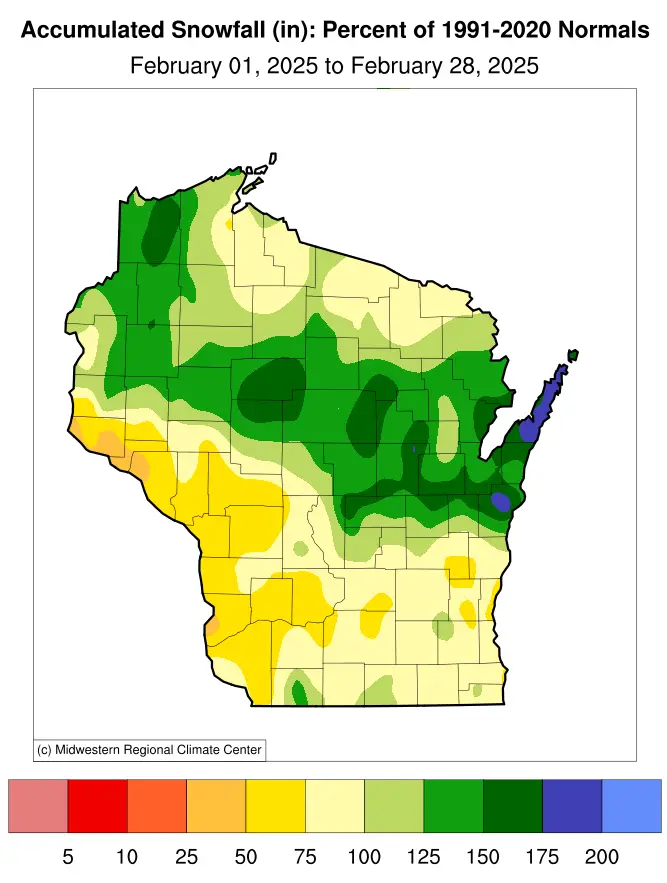
February was Wisconsin’s snowiest month this winter, with a statewide average of 12.9 inches, ranking in the top half of snowiest Februarys since 1891. Southern and west-central Wisconsin averaged 5 to 10 inches of snowfall, with the largest deficits in the southwest and west-central regions, where snowfall was less than 75 percent of normal (Figure 7). In contrast, east-central to northern Wisconsin averaged 10 to 20 inches, with most areas seeing above-normal snowfall, except for some of the northernmost counties.
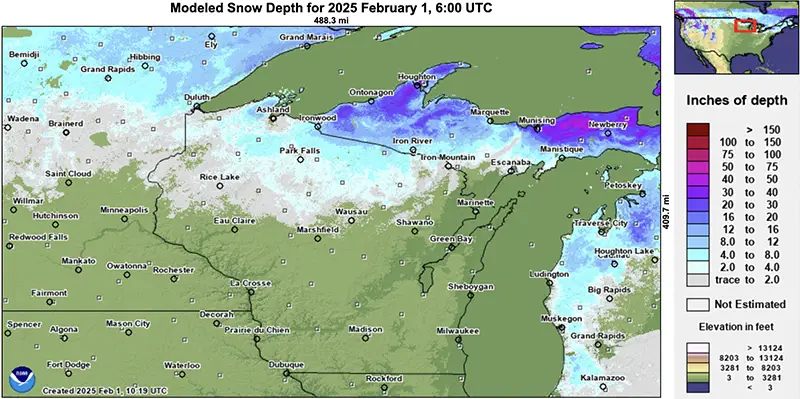
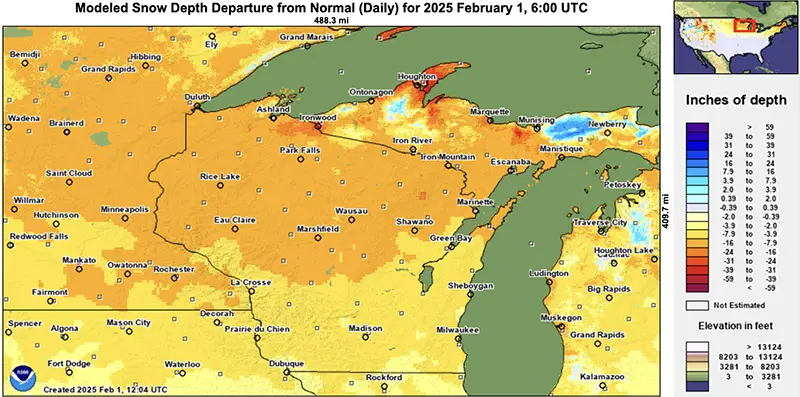
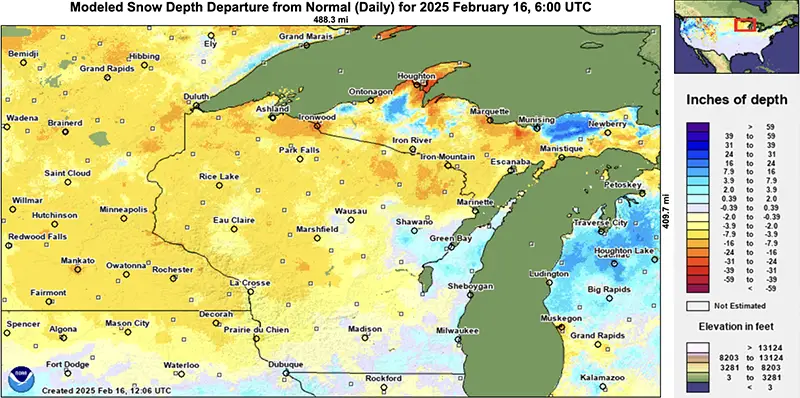
At the start of February, snow cover was limited, but a series of winter storms helped build a more sustained snowpack (Figure 8). One of the most impactful storms occurred on February 8, producing the heaviest snowfall of the season for many locations, including daily snowfall records set in Oshkosh (4.7 inches), Appleton (6.2 inches), Green Bay (7.0 inches), and Wausau (9.5 inches). Another round of snowfall between February 14 and 16 contributed to deeper snow cover, and the heaviest single-day snowfall of the month came on February 15, when Bayfield (Bayfield County) recorded 9.8 inches in 24 hours.
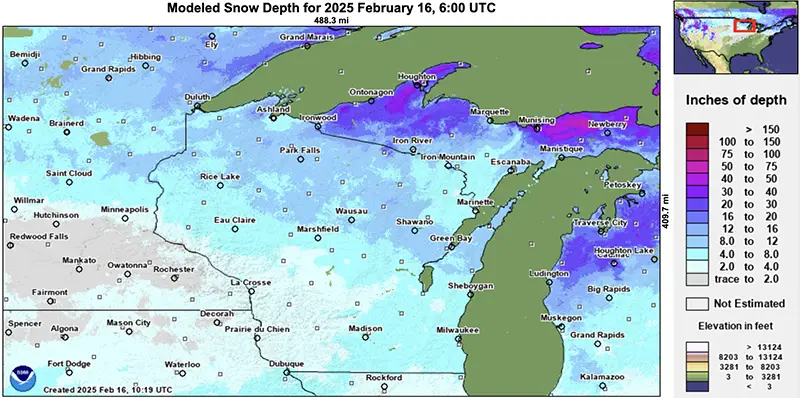
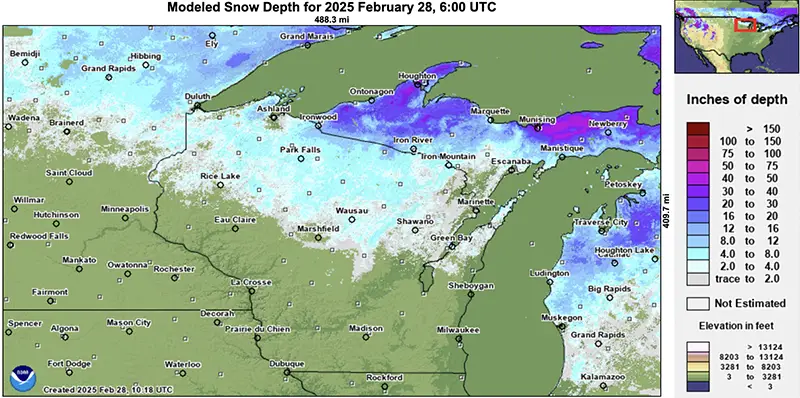
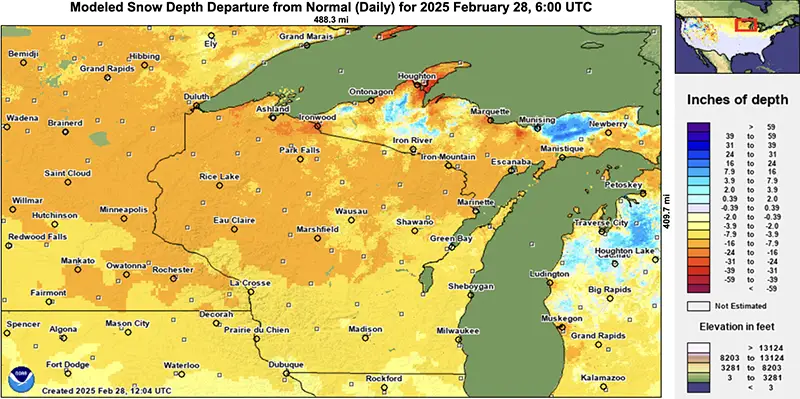
By February 20, the deepest snowpack in the state was measured at Lac Vieux Desert lake (Vilas County) with 25 inches of snow depth. Statewide snow cover lasted from February 12 to 21, as subfreezing temperatures helped maintain the snowpack. However, beginning February 23, a combination of above-freezing temperatures and increasing sun exposure led to rapid melting. That said, even as the air temperature warmed, surface ice lingered on roads and sidewalks through February 25 due to frozen ground.
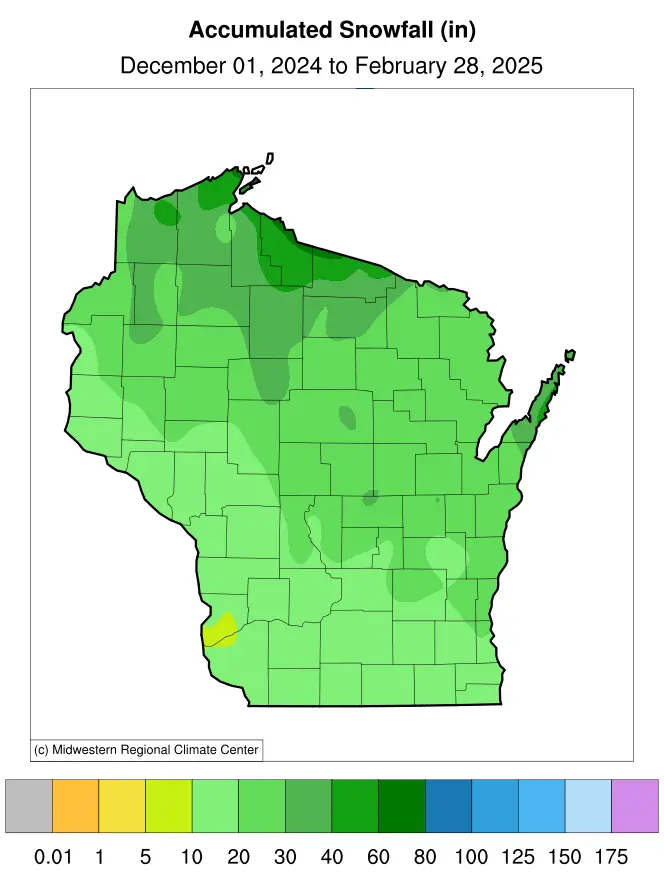
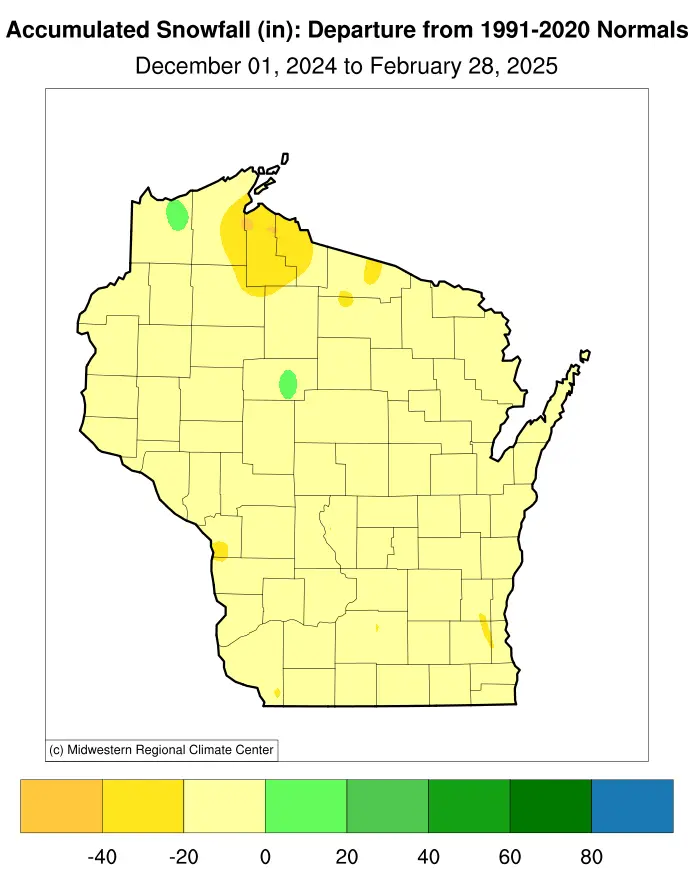
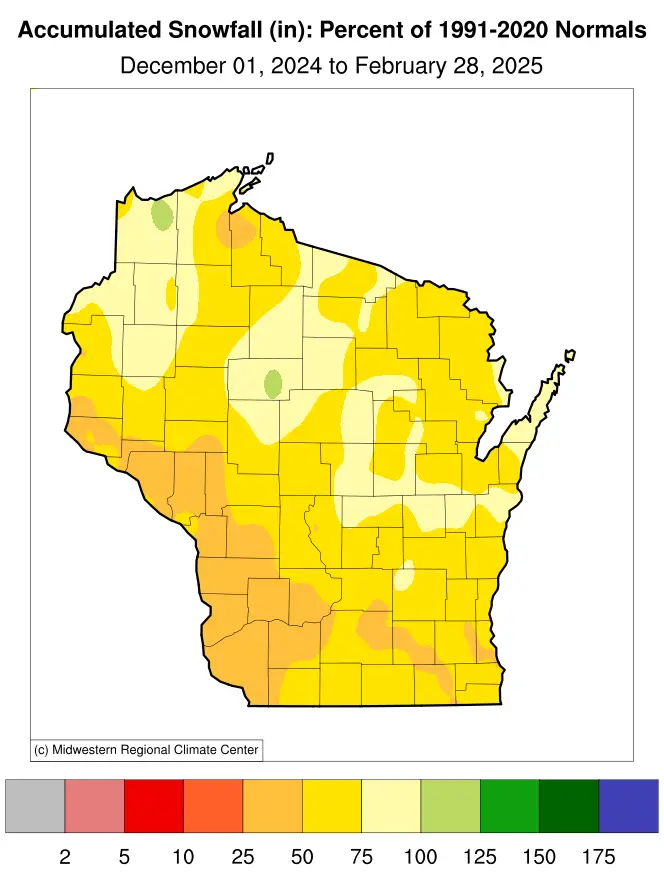
Despite an eventful February, the month’s snowfall was not enough to counteract the dryness that prevailed throughout the winter. December through February snowfall averaged 24.5 inches statewide, ranking in the bottom half of least snowy winters in 134 years of recorded data. Statewide deficits were 10 to 20 inches below normal, with the largest shortfalls — at least 40 inches below normal — in the far north-central region around Bayfield, Ashland, and Iron Counties (Figure 9). Southwest to west-central Wisconsin received just 25 to 50 percent of their normal winter snowfall.
A Mild Winter Overall
The Accumulated Winter Season Severity Index (AWSSI) provides a way to assess winter severity by accounting for temperature, snowfall, and snow depth. A low AWSSI value indicates a mild winter, while a high value reflects a harsh winter with prolonged cold and snow. This winter, AWSSI values remained low, reflecting waves of above-normal temperatures and below-normal snowfall and snow depth. As of February 2, all of Wisconsin was still classified as experiencing a “mild” winter.
However, due to the mid-February winter storms, winter severity levels were briefly elevated across the state. By February 22, stations in east-central and southern Wisconsin had climbed into the “moderate” category, indicating that February’s cold, snowy weather provided a temporary increase in winter conditions and impacts.
A Good Month for Lake Ice
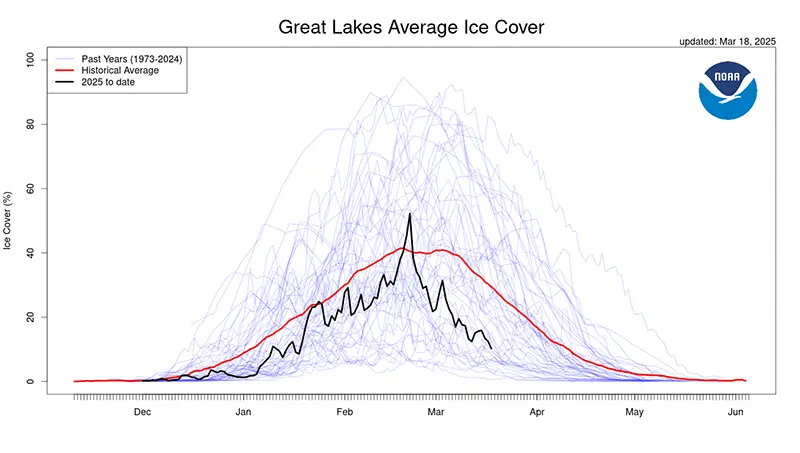
February’s persistent cold kept Madison’s lakes — Mendota, Monona, and Wingra — locked in ice for the entire month, as was the case for many inland lakes across Wisconsin. The Great Lakes saw ice coverage peak at 52.2 percent on February 21, about 10 percent above the long-term average for the end of February (Figure 10). This was a testament to the arctic air dominating the region at the time. However, the arrival of above-freezing temperatures and strong late-February sunshine triggered a rapid decline in ice, which can be seen from this animation provided by NOAA’s CoastWatch and the Great Lakes Environmental Research Laboratory.
Winter Recreation
Despite a low-snow winter, Wisconsin’s winter recreation scene wasn’t all doom and gloom. Sustained cold temperatures kept lakes frozen, providing solid conditions for ice fishing and skating, while also supporting artificial snowmaking in areas where Mother Nature fell short. When snow did arrive, cold temperatures helped preserve it, benefiting downhill skiing, cross-country skiing, and snowshoeing.
Perhaps the biggest win came just in time for Wisconsin’s most famous ski race — the American Birkebeiner in Hayward (Sawyer County). The race’s organizers worried they would be forced to manufacture snow, but Mother Nature delivered at the perfect moment, dumping fresh snow and locking in below-freezing temperatures to create ideal race conditions.
For snowmobilers, February’s snowpack provided enough coverage to open trails in far northern Wisconsin. However, the season as a whole brought its moments of frustration. With generally poor snow cover throughout the winter, those eager to hit the trails had to chase snow northward, relying on lake-effect regions like Michigan’s Upper Peninsula to find rideable terrain.
Frost Progressed Deep into the Soil
Frost depth and soil temperatures this winter and February reflected the balance between air temperature, snow cover, and ground insulation. With minimal snowpack and sustained subfreezing conditions through early-to-mid February, frost extended deep into the ground until the mid-February snow storms added insulation, slowing further frost progression despite subzero temperatures in some areas. By February 20, statewide frost depths ranged from 10 to 35 inches.
Unofficial frost depth climatologies suggest this February’s frost depths were near-to-deeper than normal. This is a drastic difference from February 2024, when we had unseasonably shallow frost depths (Table 1). Soil temperatures at 20 inches ranged from 27 to 30 degrees, and some sensors showed subfreezing temperatures down to 40 inches. By month’s end, topsoil temperatures began responding more directly to warming air and sunlight.
| Location (County) | February 5, 2024 | February 5, 2025 | February 20, 2024 | February 20, 2025 |
|---|---|---|---|---|
| Durand (Pepin) | 0 | 31 | 0 | 30 |
| La Crosse (La Crosse) | 0 | 16 | 0 | 18 |
| Watertown (Jefferson) | 0 | 18 | 0 | 17 |
| Mukwonago (Waukesha) | 0 | 27 | 2 | 30 |
| Marshfield (Wood) | 4 | 17 | 5 | 18 |
| Bloomer (Chippewa) | 8 | 28 | 5 | 29 |
| Land O’ Lakes (Vilas) | 8 | 20 | 8 | 26 |
| Merrill (Lincoln) | 9 | 31 | 6 | 31 |
| Plover (Portage) | 15 | 36 | 8 | 36 |
| Roberts (St. Croix) | 16 | 24 | 0 | – |
| Florence (Florence) | 21 | 33 | 17 | – |
Intense Winds
On February 28, Wisconsin was hit by a powerful cold front that brought intense winds across the state. During the afternoon, wind gusts exceeded 45 miles per hour for many, including one adorable pooch (Table 2). Notable peaks included 56 miles per hour at Lone Rock Airport, 53 miles per hour at La Crosse and Boscobel Airports, and 51 miles per hour in Ashland.
| Location | Speed (MPH) | Time |
|---|---|---|
| Lone Rock – Airport | 56 | 1:10 p.m. |
| Janesville / Rock County Airport | 55 | 3:45 p.m. |
| Sheboygan – Airport | 54 | 2:26 p.m. |
| East Troy | 53 | 5:55 p.m. |
| Monroe | 52 | 4:15 p.m. |
| Milwaukee – General Mitchell Airport | 52 | 6:44 p.m. |
| Kenosha Airport | 51 | 4:38 p.m. |
| Waukesha County Interstate 94 at Highway 67 | 50 | 4:09 p.m. |
| Fond Du Lac Airport | 49 | 1:28 p.m. |
| Interstate 39/90 at Highway 59 Newville | 48 | 3 p.m. |
| Racine – Batten Airport | 47 | 5 p.m. |
| Dodgeville | 46 | 3:11 p.m. |
| Elkhorn | 46 | 3:55 p.m. |
| Waukesha Airport | 46 | 5:45 p.m. |
| Middleton | 45 | 2:15 p.m. |
| Reedsburg – Airport | 45 | 4:15 p.m. |
| Port of Milwaukee Coastal-Marine Automated Network | 45 | 5:50 p.m. |
| Green County, Monroe | 45 | 1:50 p.m. |
Persistent Drought
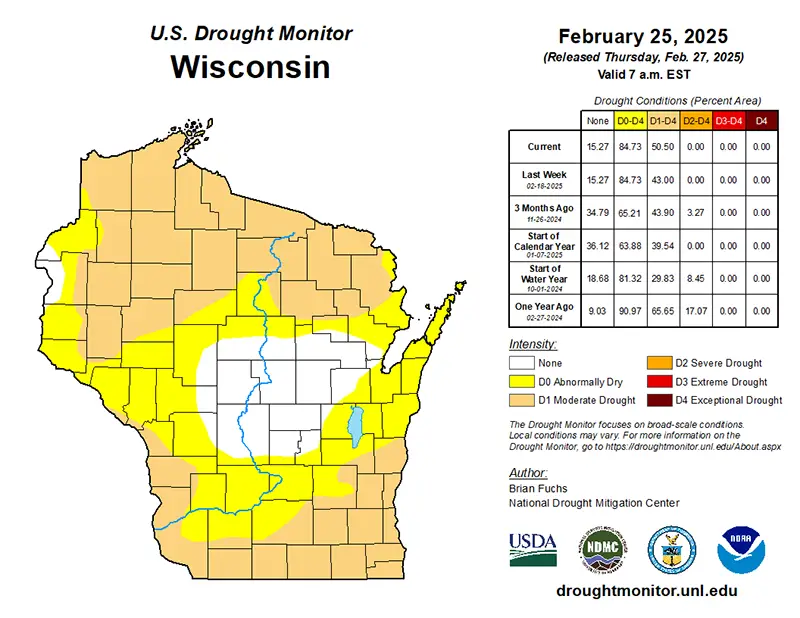
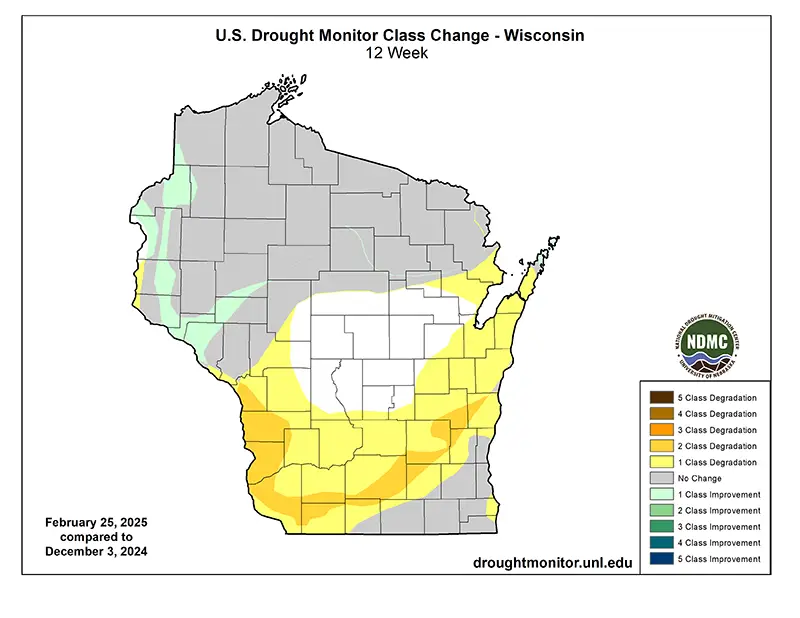
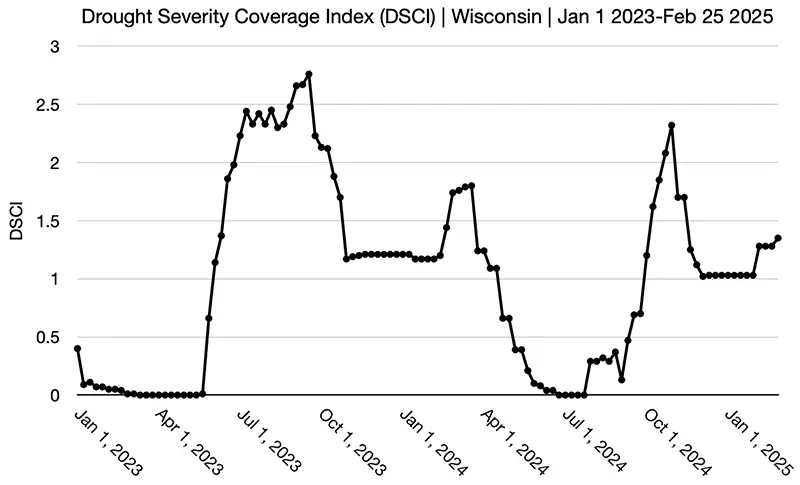
Throughout February and the winter months, Wisconsin faced persistent drought conditions. Since the start of winter, southern and southeastern Wisconsin and northern to west-central Wisconsin experienced abnormally dry to moderate drought conditions. January brought a brief respite for some, but by early February, the drought had returned to its early winter severity. As February drew to a close, the dryness spread further, signaling ongoing moisture deficits (Figure 11). As a result of the drought expansion, there was an uptick in the Drought Severity Coverage Index (Figure 12).
Outlook
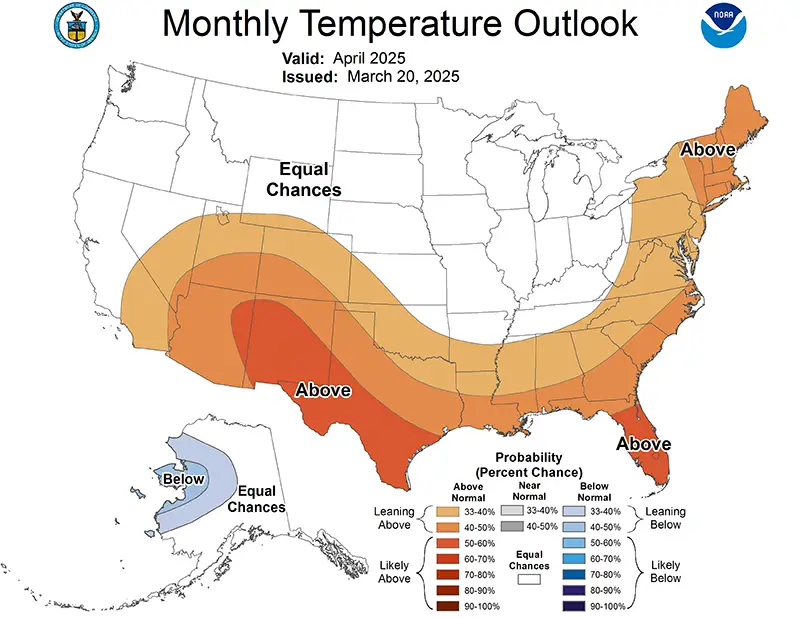
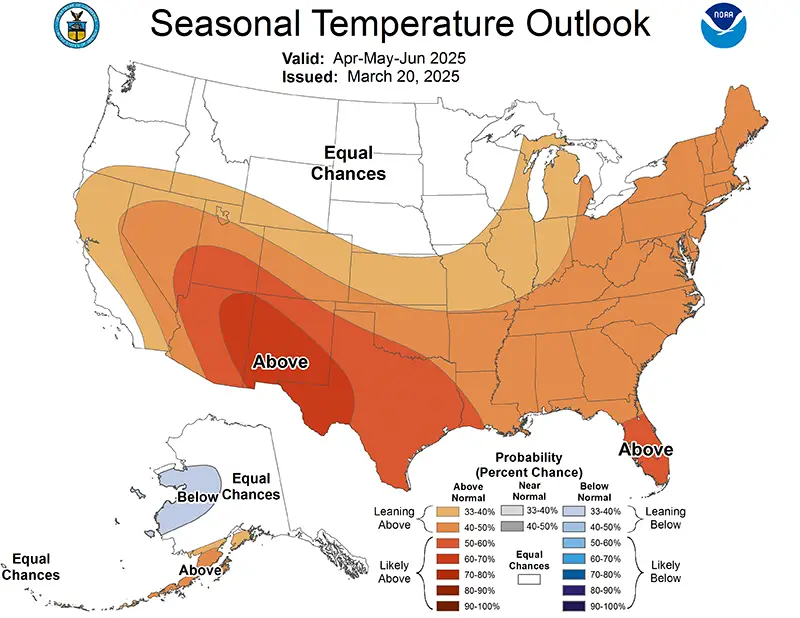
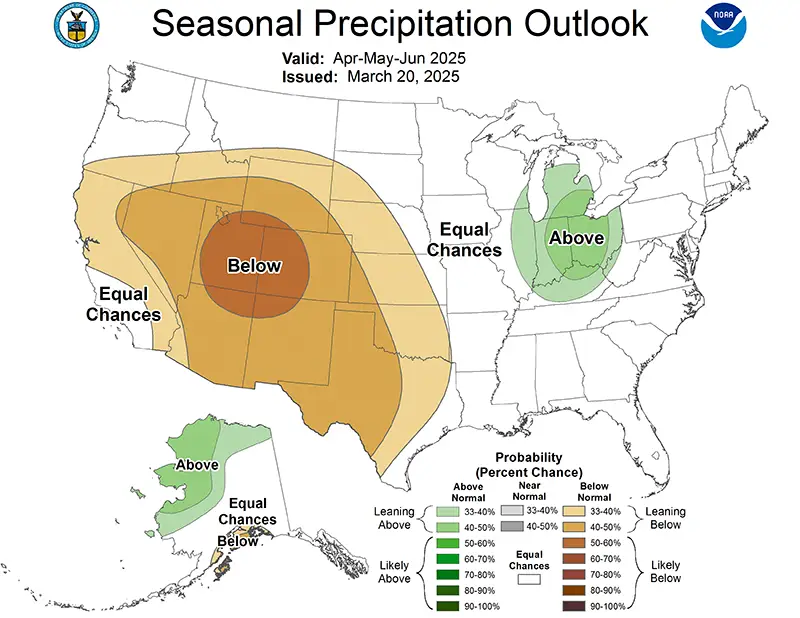
April’s forecast shows equal chances for above-, near-, or below-normal temperatures (Figure 13). By May and June, however, chances are slightly tilted toward above-normal temperatures for southern and eastern Wisconsin (Figure 14). Meanwhile, there is a hint that Wisconsin could see above-normal precipitation in April, but equal chances for above-, near-, or below-normal precipitation between April and June.
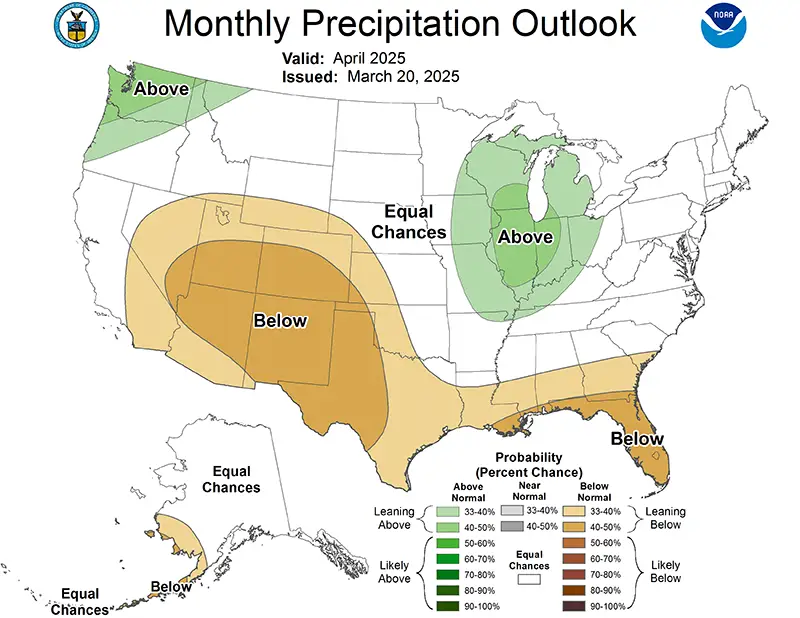
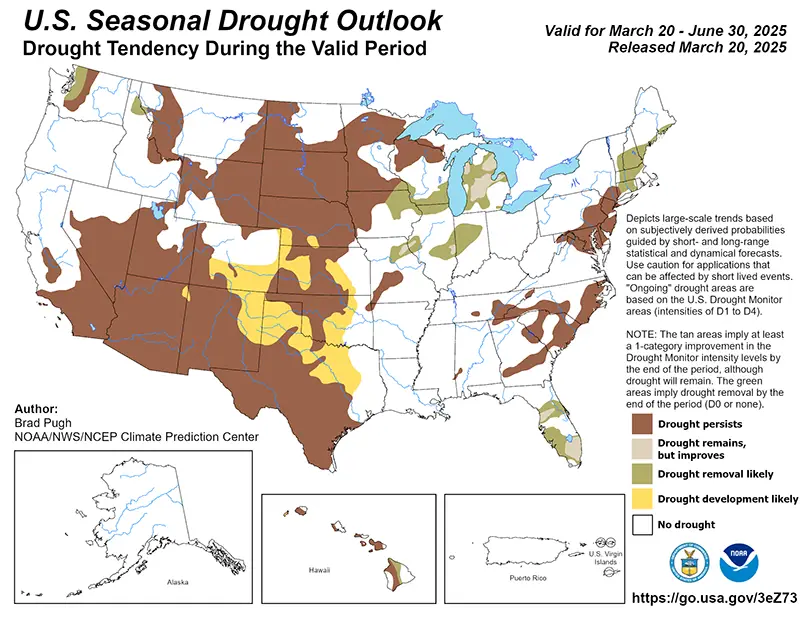
With the potential for a wetter-than-normal April, drought relief is possible (Figure 15). Still, the overall spring flood outlook remains near to slightly below normal, given the combination of ongoing drought, well-below-normal snowpack and soil moisture, and near-normal river flows. Any spring flooding that does develop will likely be driven by individual storm systems rather than prevailing conditions.
Climate Corner
What dictates soil frost depth and how do we measure it?
As temperatures drop in late autumn, frost begins forming in the soil, typically reaching maximum depth by mid-to-late February. The extent of frost depth is influenced by air temperature, snow accumulation, and soil characteristics. Snow acts as an insulator, reducing frost depth. Without it, frost can extend several feet into the ground, especially in northern Wisconsin.
In Wisconsin, maximum frost depth ranges from about 20 inches in southern Wisconsin to several feet in the north, especially when snow cover is minimal. The winter of 2024-25 saw deep frost penetration due to persistent cold and limited snow cover, with frost depths reaching up to 38 inches in northern Wisconsin by mid-February before stabilizing as snow accumulated.
Historically, frost depth was measured by cemetery officials through the “grave digger reports” program. By the 1990s, electronic probes and frost-tube instruments replaced the manual reports. Today, agencies like the Wisconsin Department of Transportation and the Wisconsin Environmental Mesonet (Wisconet) monitor soil temperatures and frost depth using advanced sensors. The data is crucial for agriculture, infrastructure, and hydrology, as frost depth affects the dormancy of crops, plants, and pests, as well as utility lines, road conditions, and springtime runoff.
Steve Vavrus is the Wisconsin state climatologist. Bridgette Mason and Ed Hopkins are the assistant state climatologists.