After two months of what felt like Wisconsin’s most “normal” winter in recent years, February closed out the season with record warmth and spotty snowfall.
- 14th warmest February on record.
- Isolated February precipitation left some wanting.
- Slightly cooler- and drier-than-average winter.
February Warmth Closes Out Winter
February brought a dramatic temperature swing to Wisconsin, starting and ending with chilly conditions but featuring an exceptionally mild stretch mid-month.
The month began with a sharp cold snap, when temperatures dropped to minus 18 degrees Fahrenheit in Big Falls (Rusk County) on February 2, the coldest reading in the state during February.
Just two weeks later, springlike warmth swept across Wisconsin, pushing temperatures into the 60s for some.
On February 16, Milwaukee set a daily record-high temperature of 63 degrees. The previous record was 56 degrees, set in 1921. This was Milwaukee’s earliest 60-degree temperature since 2013 (January 29).
In Madison, temperatures reached 64 degrees on February 16, shattering the previous daily record of 57 degrees. A high of 64 is especially notable as Madison typically does not reach that temperature until early May.
The warm spell also produced a streak of six consecutive days with highs at or above 50 degrees in Madison and La Crosse (February 13 through 18). Madison has only experienced a February warm streak this long once before, in 2017. In La Crosse, it has occurred three other times — 2017, 2000, and 1981 — with the 2000 streak lasting eight days.
The warmest readings of the month reached 66 degrees in Prairie du Chien (Crawford County) on February 16 and Dodgeville (Iowa County) on February 17.
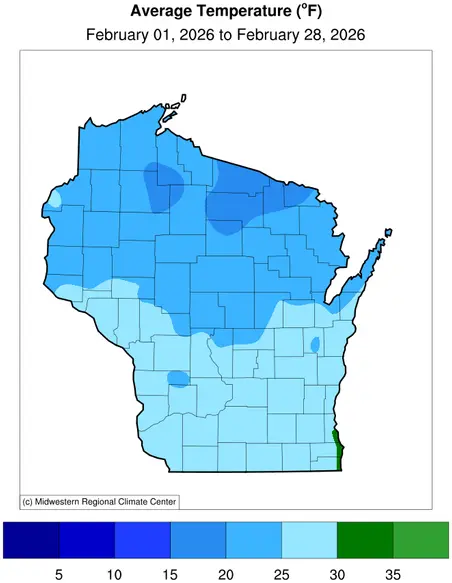
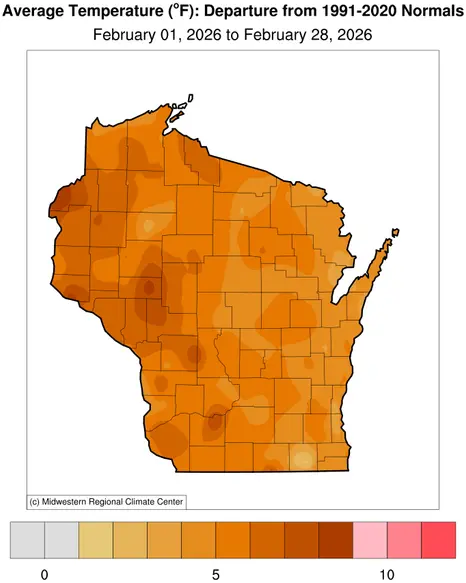
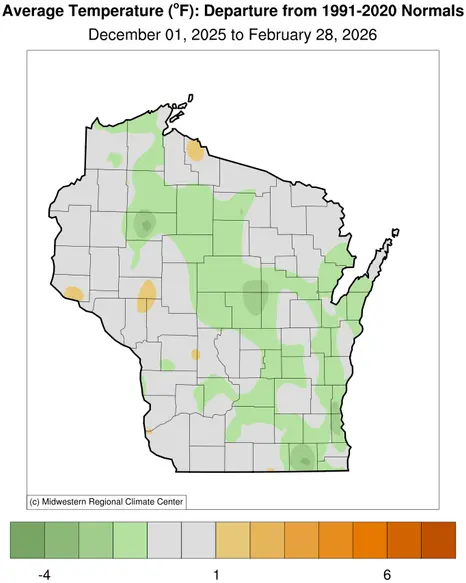
Statewide, February averaged 25 degrees, which is 5.8 degrees above normal. This made it the 14th warmest February on record and the warmest monthly temperature anomaly Wisconsin has seen since February 2024 (Figures 1 and 2).
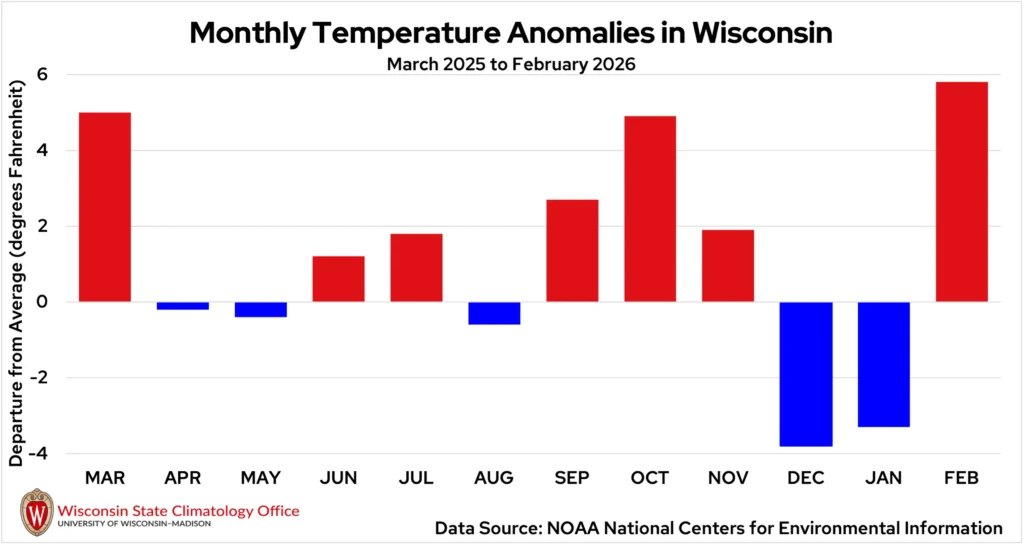
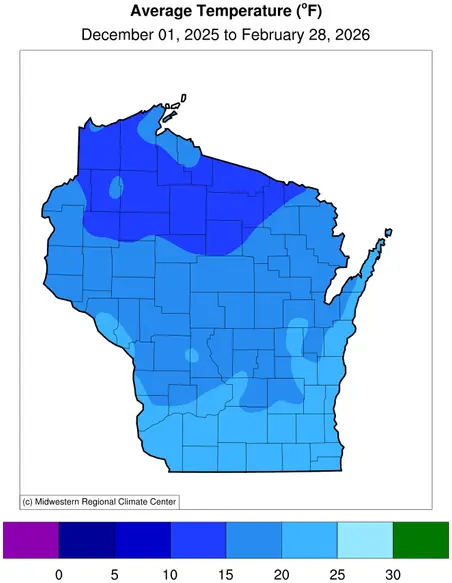
As a whole, winter ended very close to normal in terms of temperature, though conditions swung dramatically.
December began the season with an intense Arctic blast, producing the state’s coldest monthly temperature anomaly since April 2022. January continued the cold trend overall. February then flipped the script, ending the season with unusually warm temperatures.
In the end, winter averaged 18.2 degrees statewide, just 0.3 degrees below normal (Figure 3).
Isolated Precipitation
February was remarkably quiet in terms of snow or rainstorms, though the few storms that did occur packed a punch.
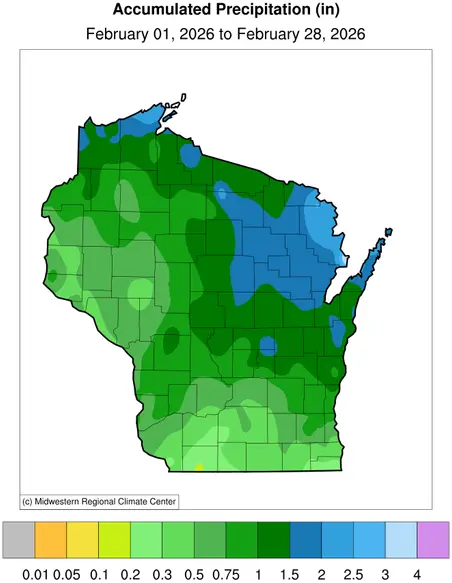
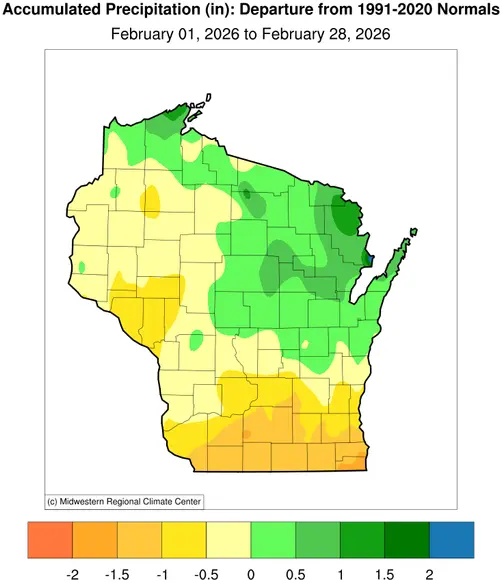
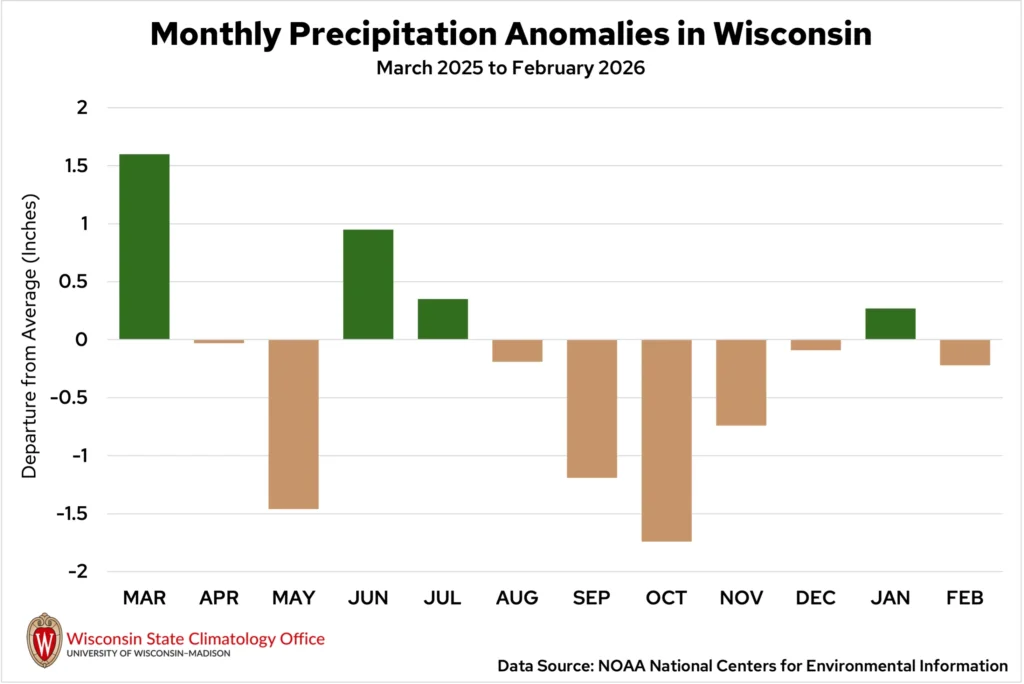
Overall, the state averaged 0.92 inches of precipitation, which is 0.22 inches drier than normal (Figures 4 and 5). Most of that moisture arrived in two mid-month weather systems.
On February 17 to 18, the northern side of a storm brought blizzard conditions to northwestern Wisconsin. Meanwhile, the warmer southern side of the storm brought rain and rumbles of thunder to parts of southern and eastern Wisconsin. Small, pea-sized hail was even reported in Portage County.
Wausau measured 0.62 inches of rain from the event, breaking the city’s previous February 18 record of 0.60 inches from 1961. Snow totals in the western counties were between two and five inches for most, though some communities closer to Lake Superior reported a foot of fresh snow.
The second storm arrived the next night, February 19, and once again featured a sharp cutoff between rain and snow. Warm temperatures from Madison to Green Bay allowed for rain or a wintry mix, while cooler temperatures from La Crosse to Wausau allowed for snowfall.
A narrow band of heavy snow brought over a half-foot of snow to areas near La Crosse, with portions of Monroe County reporting 12 inches.
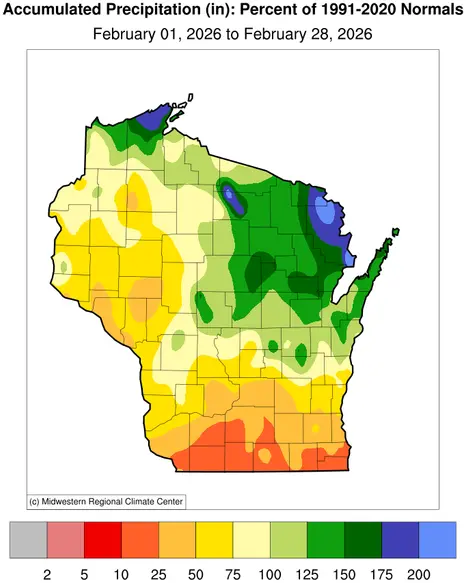
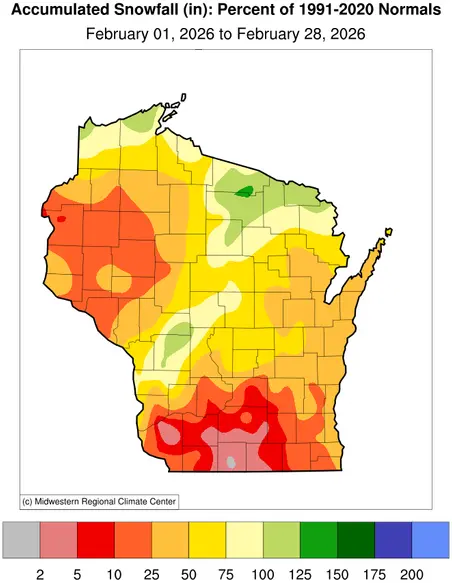
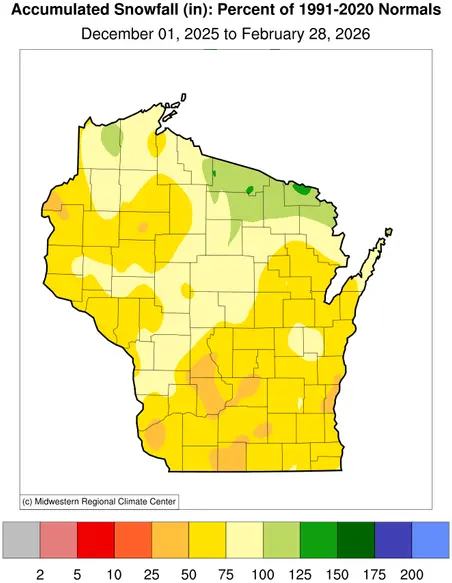
Southern Wisconsin severely lacked snowfall throughout February, with many areas reporting less than 10 percent of normal monthly snow (Figure 6). A thin band of snow brought some in the region their only snowfall of the month on February 28. Totals of six inches were seen in parts of Crawford and Vernon counties, while only two to three inches fell from Madison to Milwaukee.
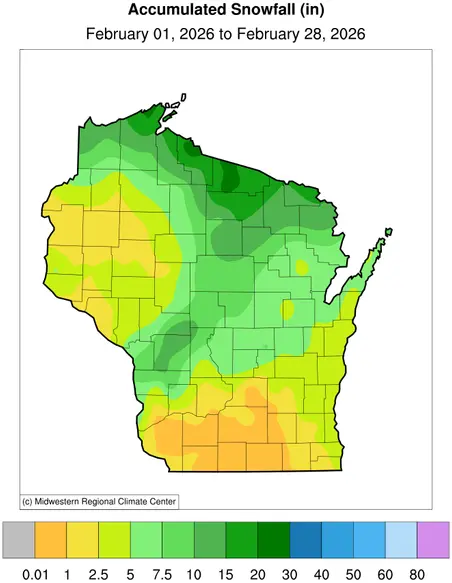
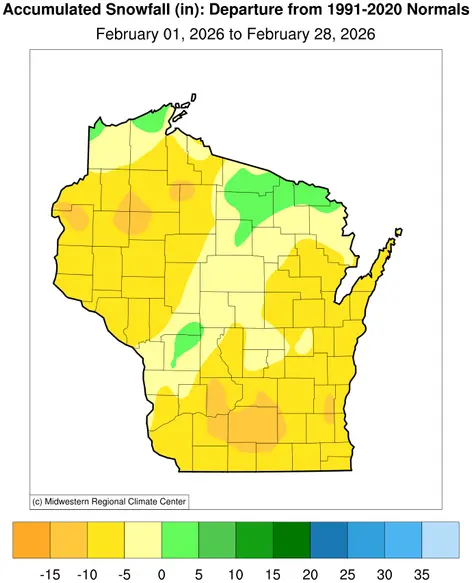
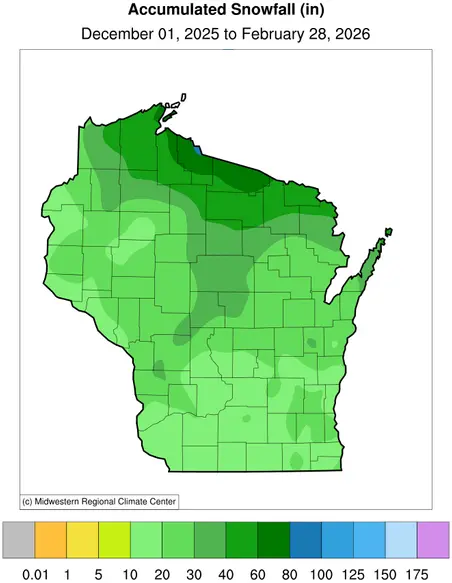
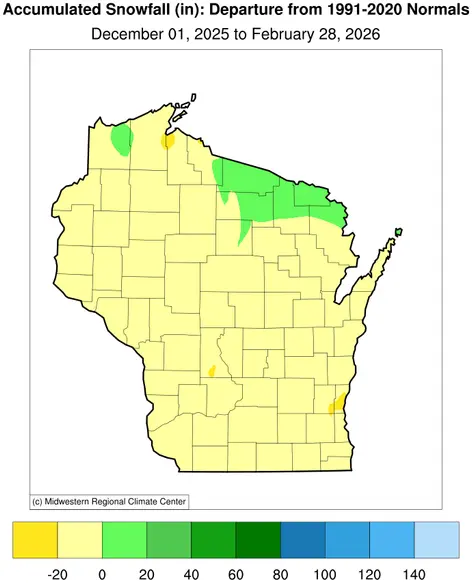
The winter season was less snowy than typical across Wisconsin, with average statewide snowfall of 29.2 inches, 8.1 inches drier than normal. Many areas received only 50 to 75 percent of normal winter snowfall, while some pockets of southern Wisconsin saw even less. (Figure 7).
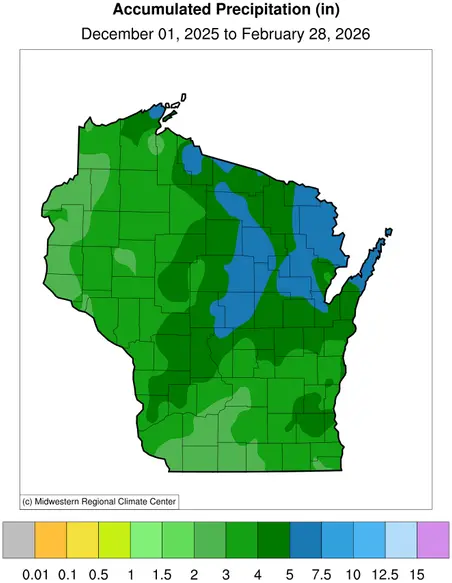
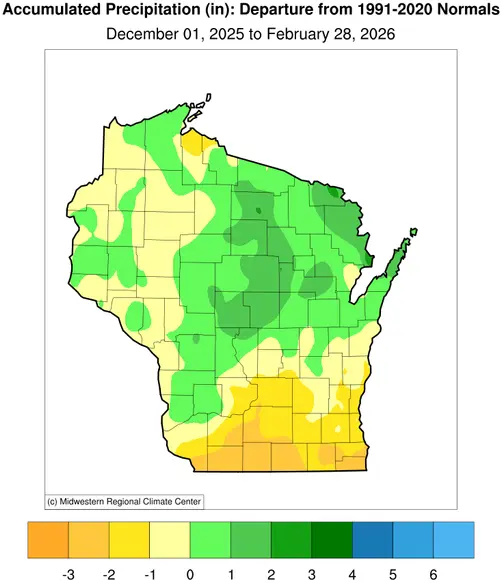
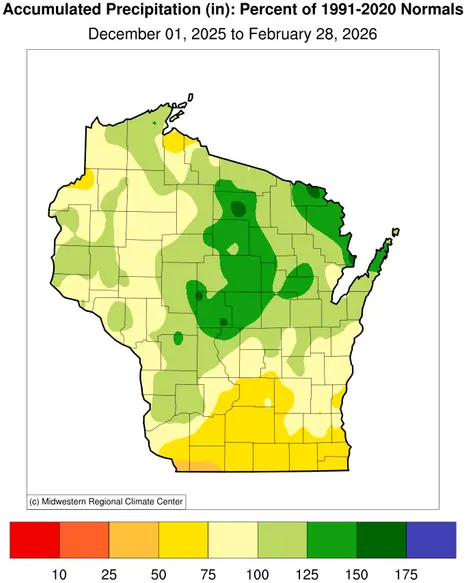
In terms of overall winter precipitation, Wisconsin was slightly drier than average by 0.1 inches, with a statewide average of 3.8 inches. The central and northeast regions of the state were wetter than average by one to two inches, while the southern counties came up short by the same amount (Figure 8).
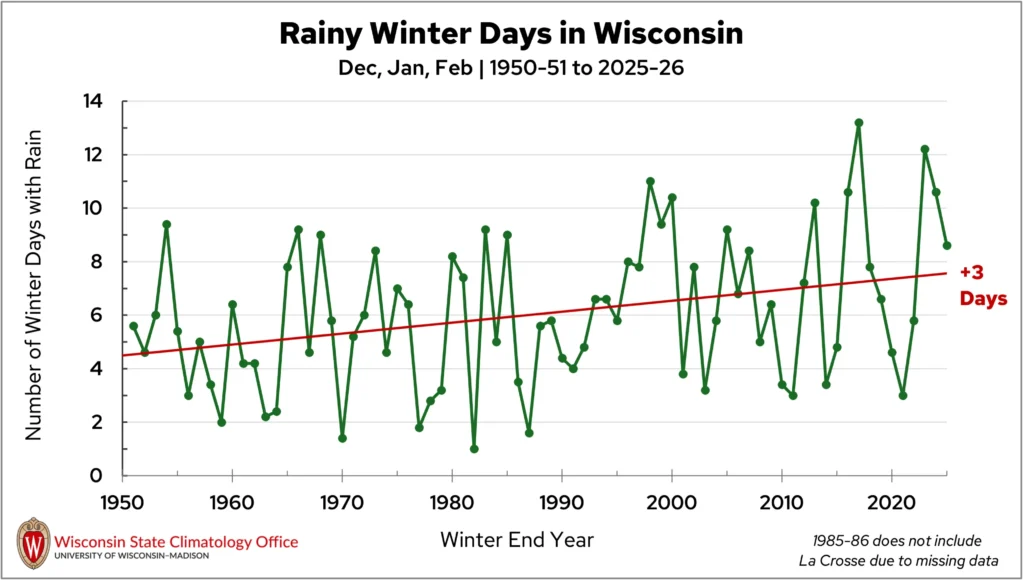
Large differences are seen between overall season snowfall and season precipitation, spotlighting a number of events where rain fell rather than snow. Wisconsin has seen an increase in the number of rainy winter days since 1950 (Figure 9). This winter, rain fell on 8.6 days averaged across the state’s first-order stations.
Gradual Drought Improvements
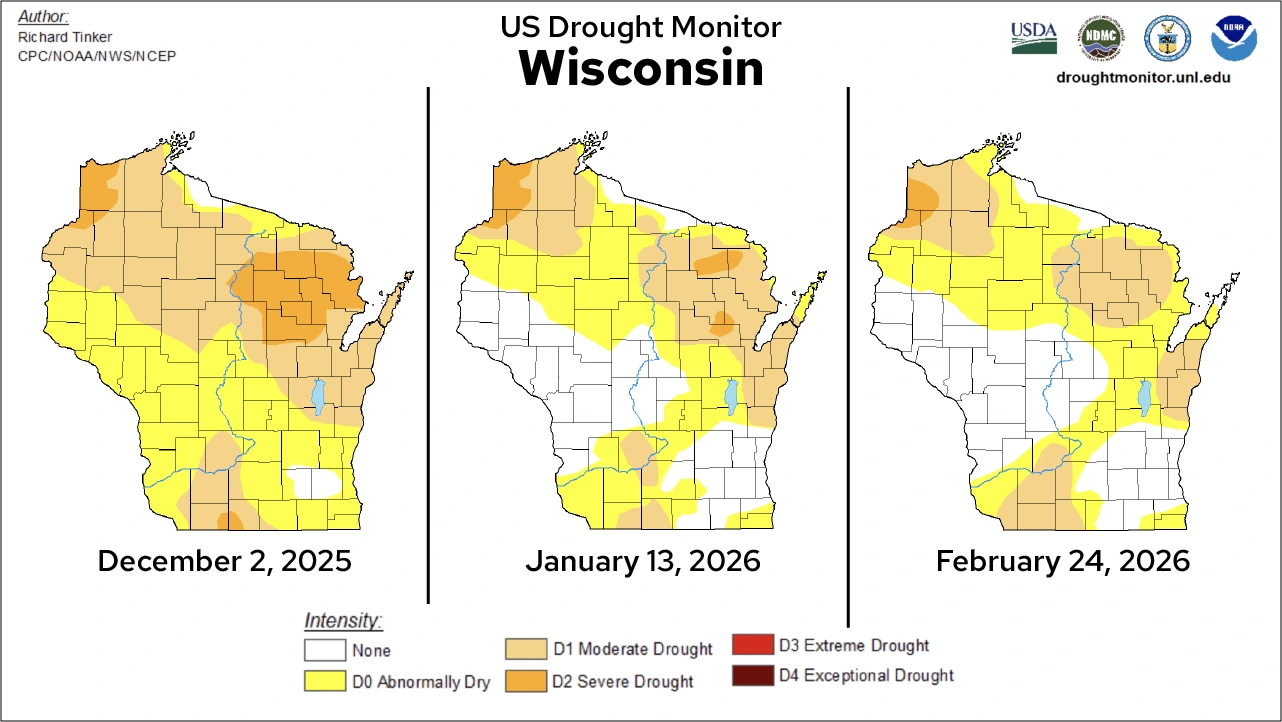
While February’s spotty precipitation didn’t do much to improve Wisconsin’s drought conditions, it was just enough to keep conditions from worsening. Heavy rain on February 18 in northeast Wisconsin eliminated severe drought (D2) and diminished the coverage of moderate drought (D1) in the region.
Despite an overall drier-than-average winter season, drought conditions greatly improved in the state between December 1 and February 28 (Figure 10). West central and southeastern counties saw improvements in abnormally dry conditions, and areas of severe drought (D2) shrank in northern Wisconsin.
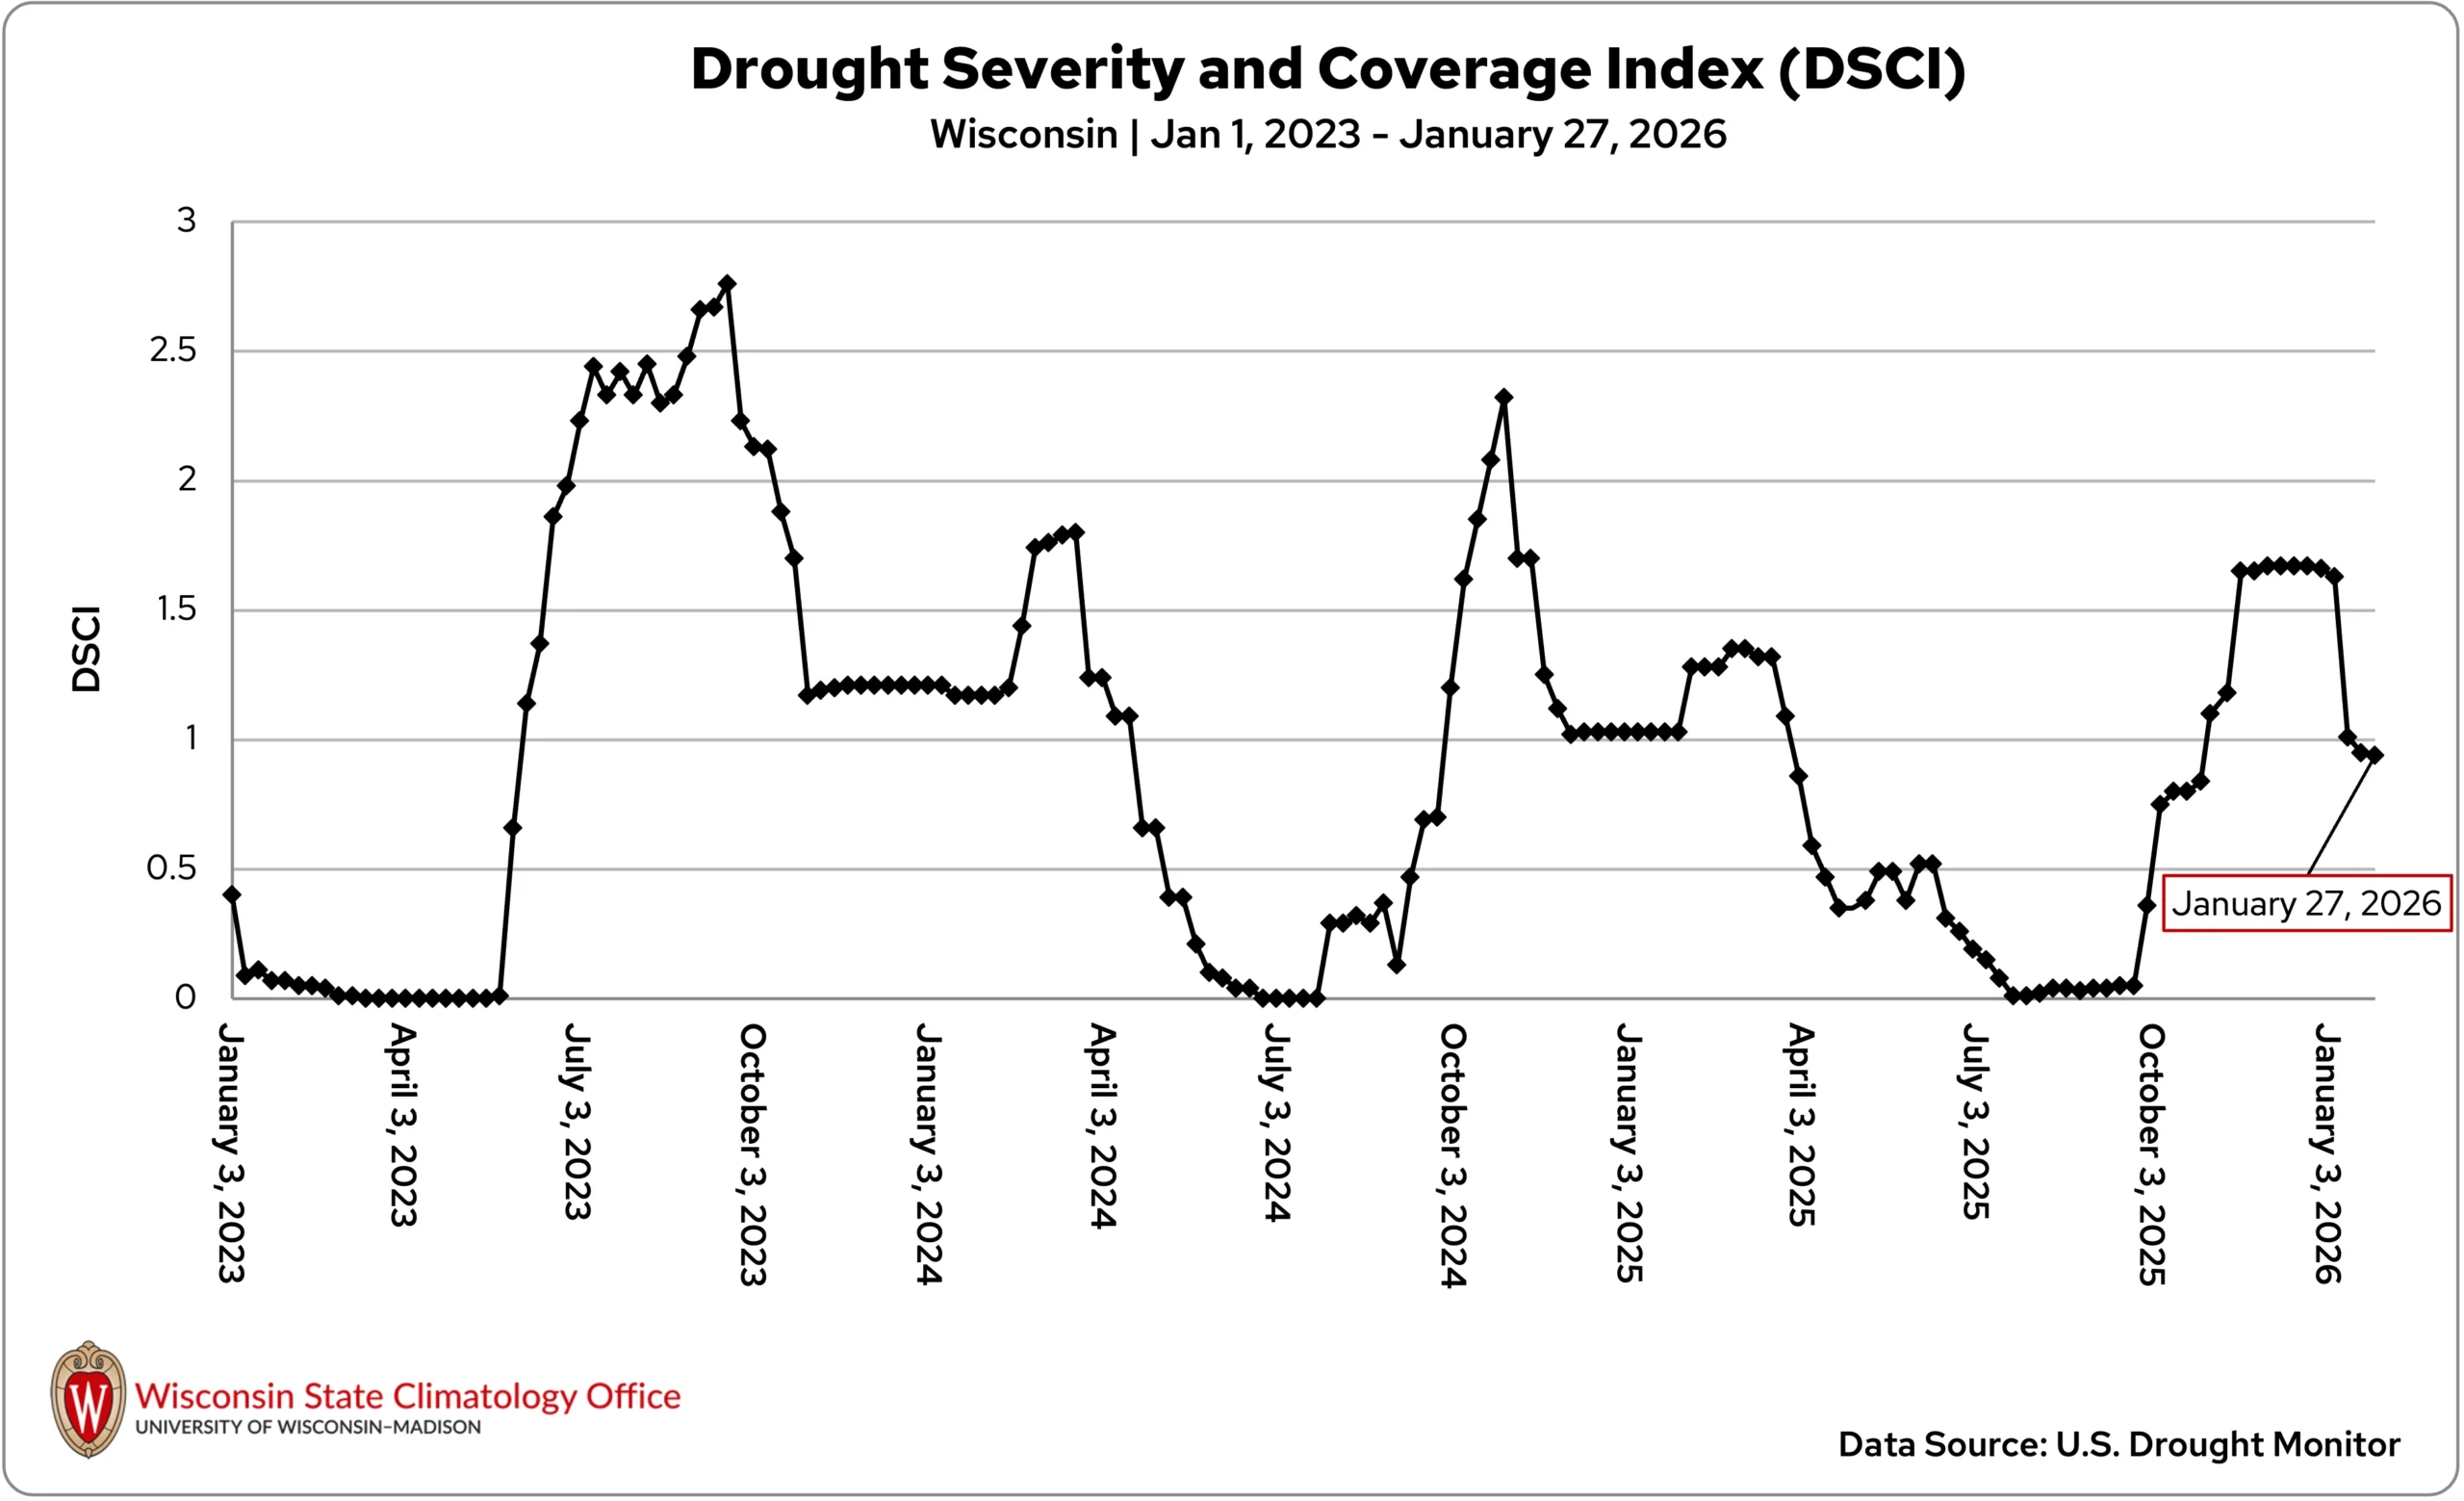
Wisconsin’s Drought Severity and Coverage Index (DSCI) improved from 1.67 in early December to 0.91 in late February (Figure 11). Although this is the lowest end-of-winter DSCI for the state in the last two years, more than a quarter of Wisconsin remains in drought as the spring growing season approaches.
Lake Ice
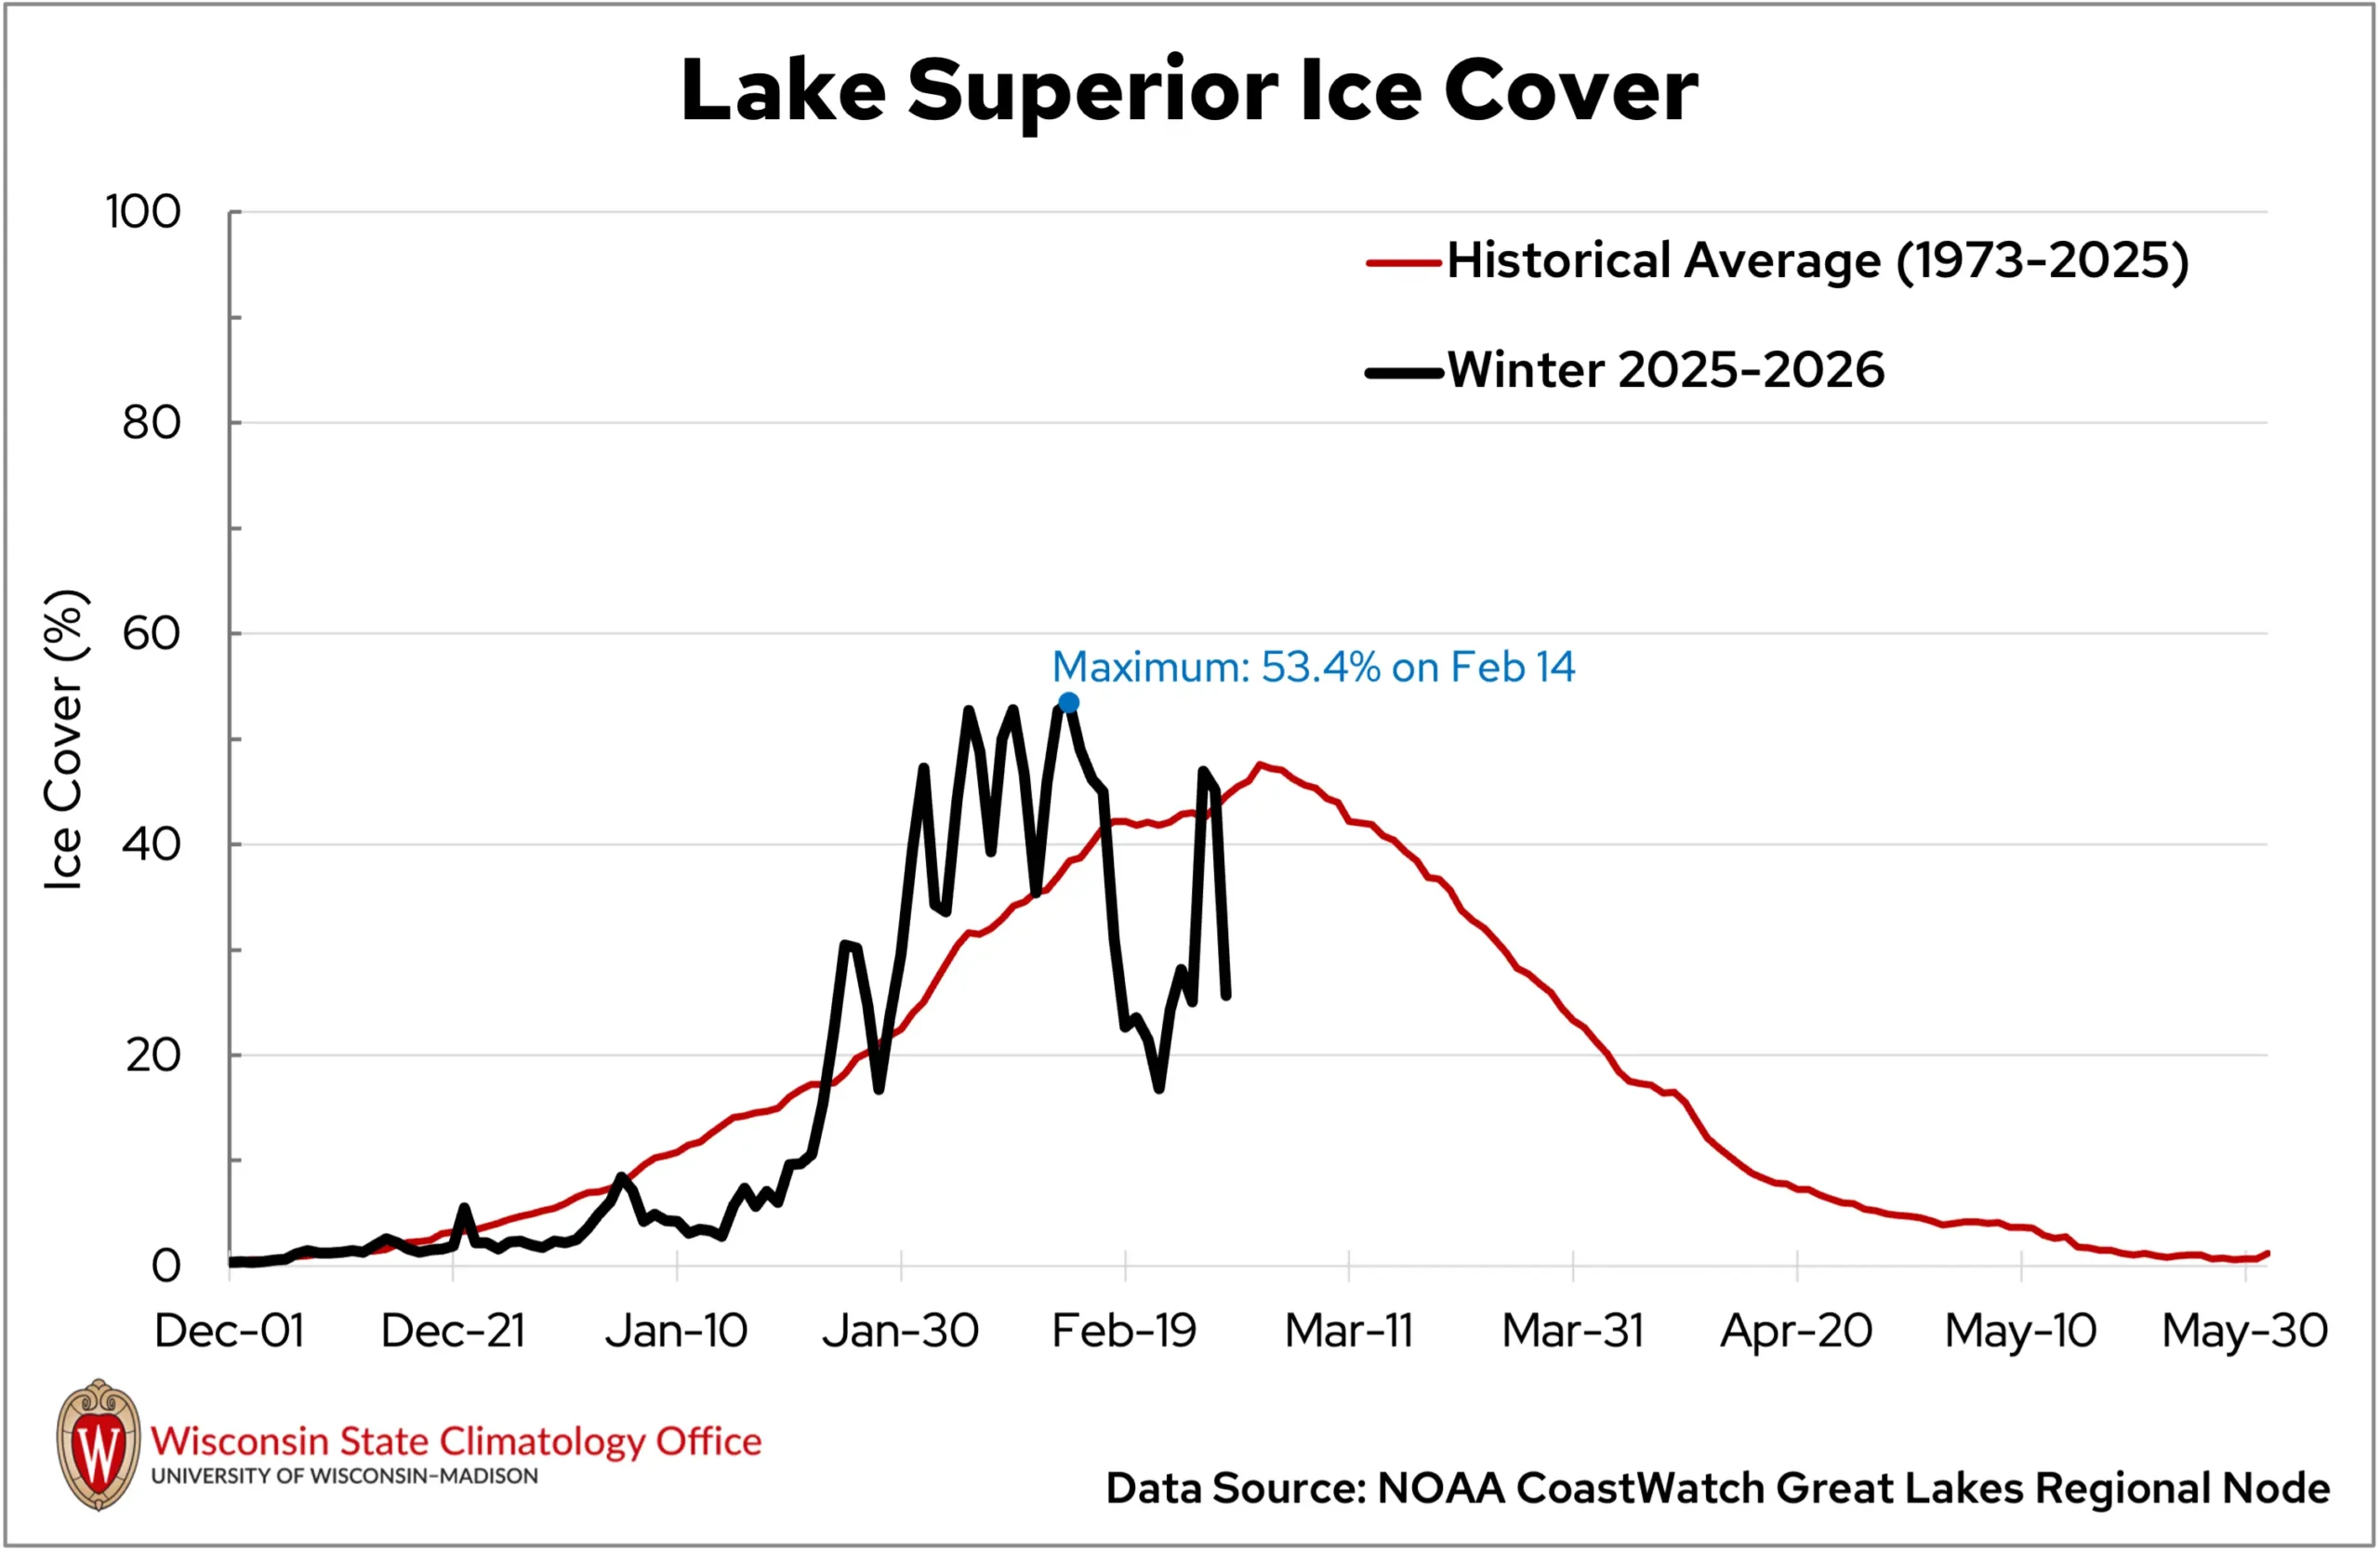
Winter’s up-and-down temperatures were reflected in lake ice coverage on both the local and Great Lakes. Ice cover was slow to build on Lake Superior through December, but January’s cold resulted in a large increase in ice that lasted through mid-February (Figure 12).
In fact, conditions along the shoreline were deemed safe enough for the Apostle Islands ice caves to open for the first time since 2015. Conditions were short-lived, though, as strong winds broke up the ice the day after the caves opened.
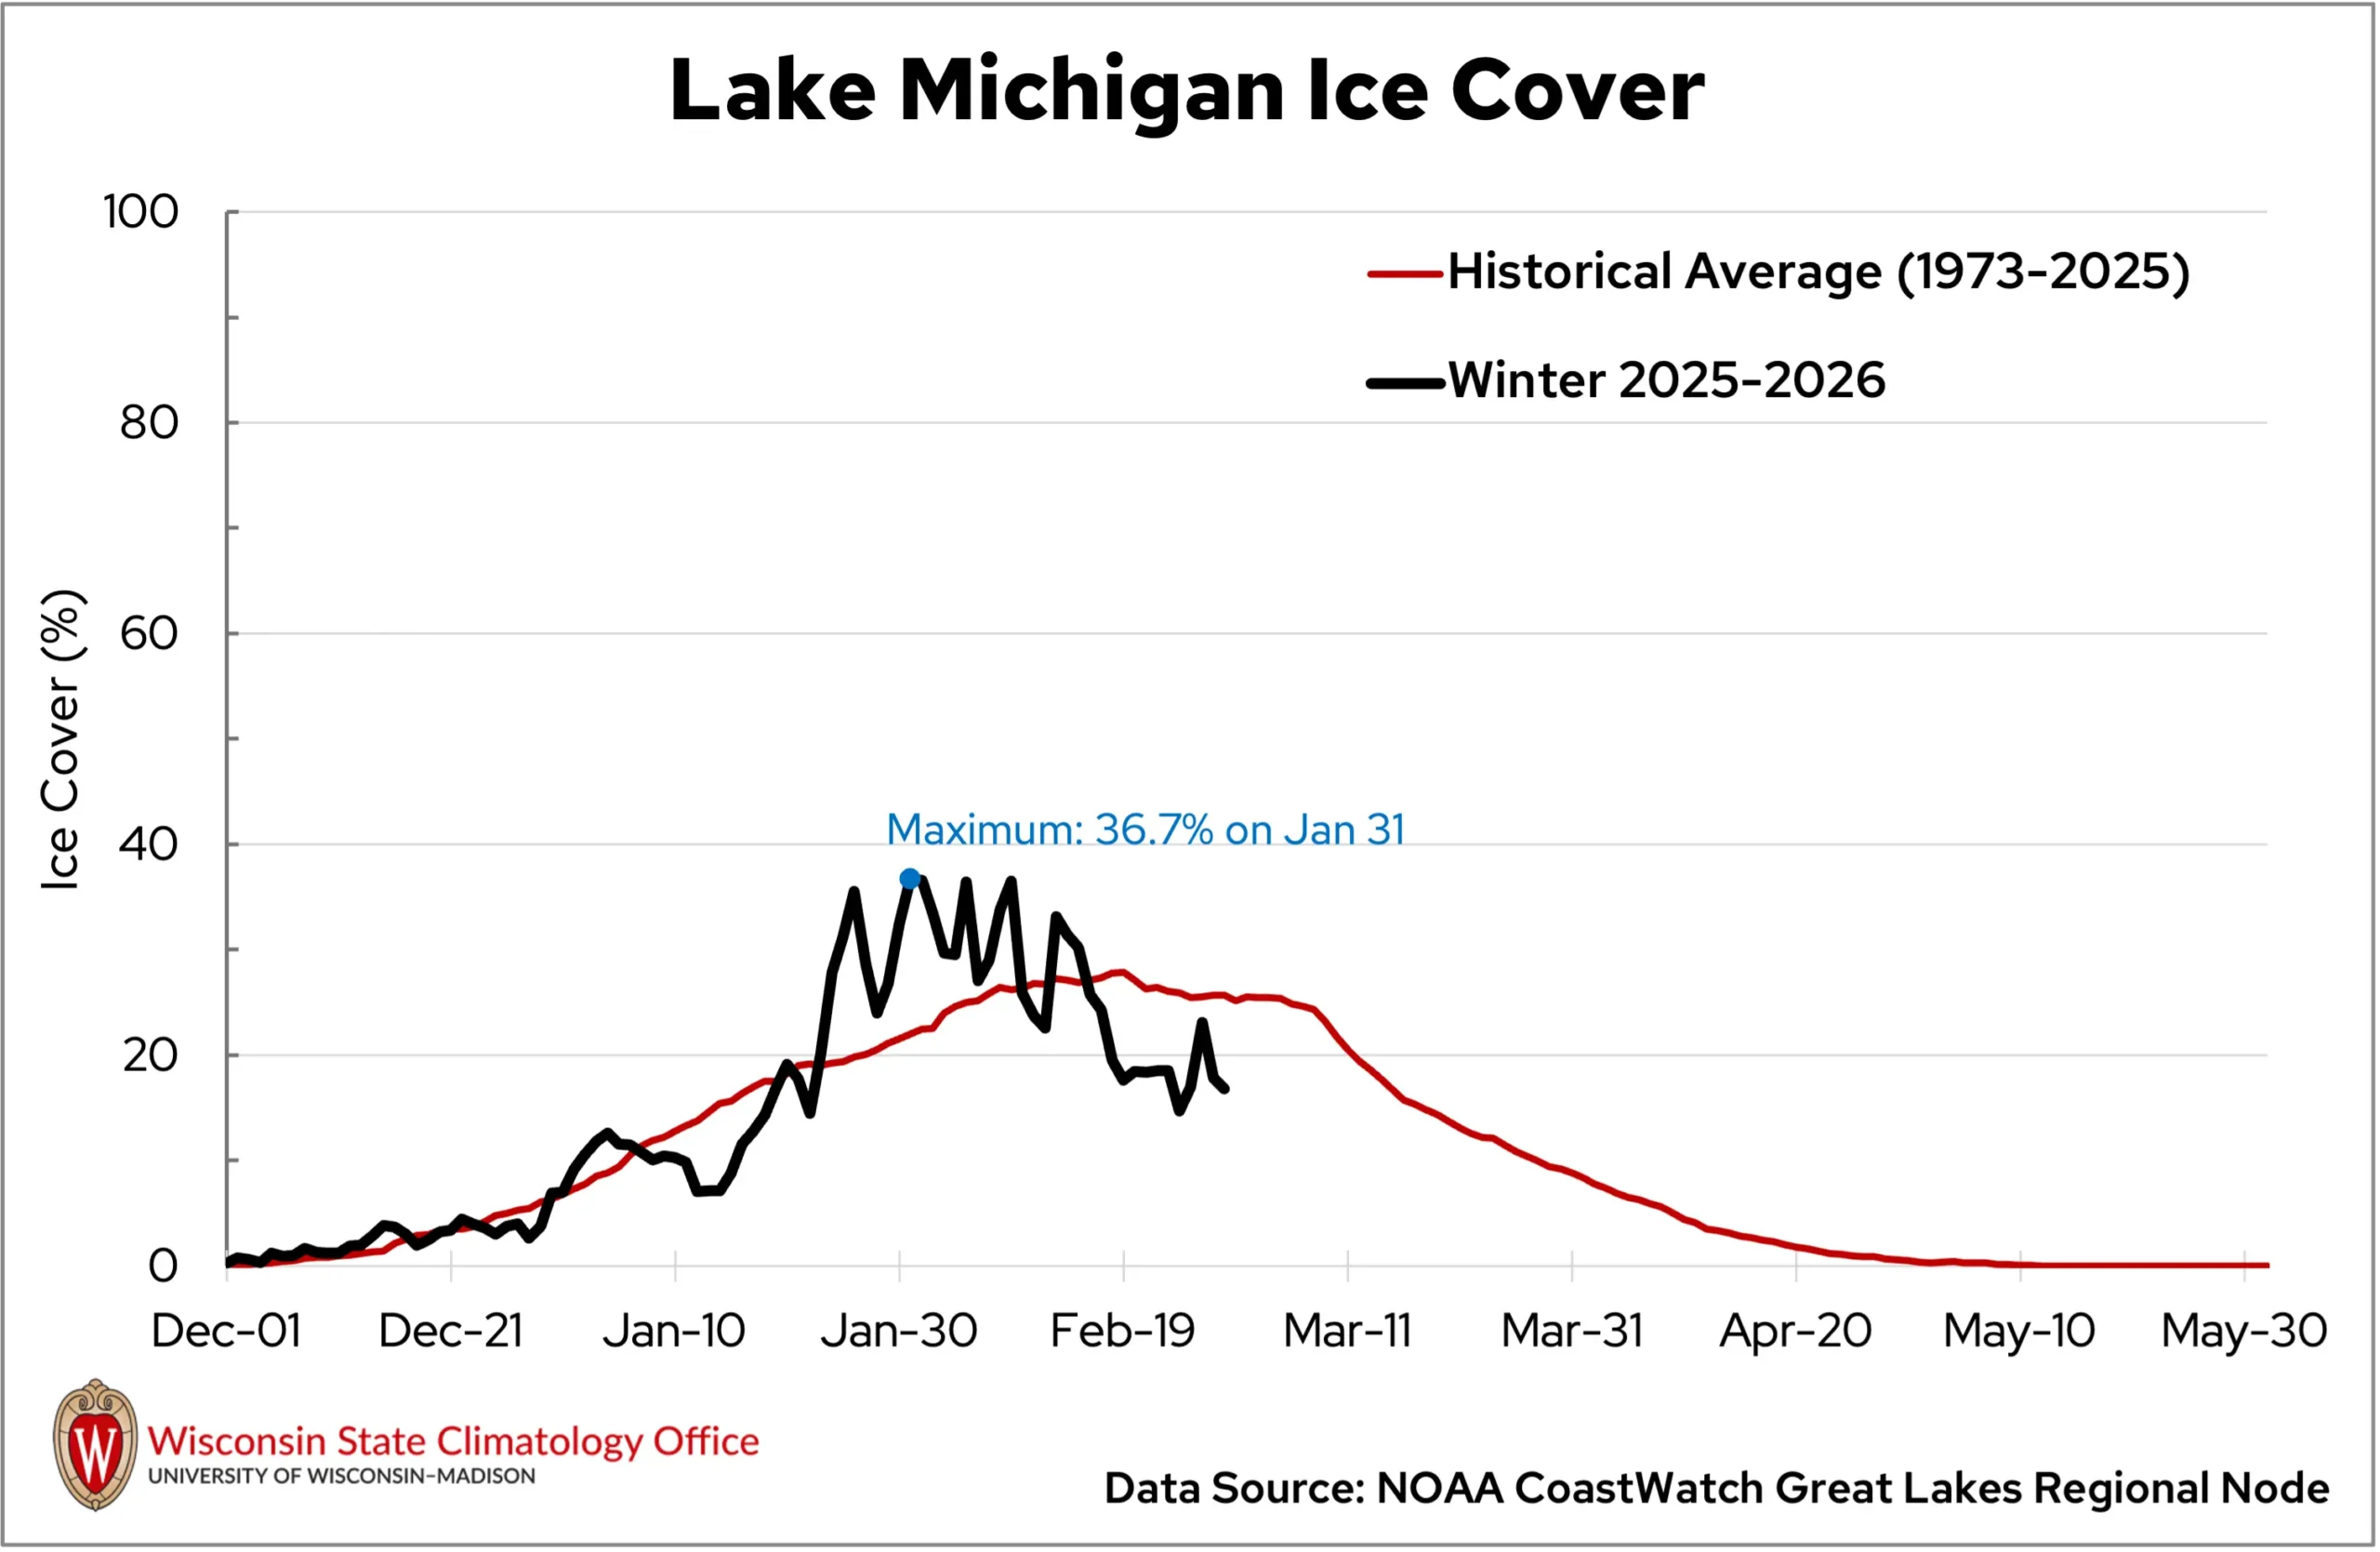
Local lakes may have also been slow to freeze, as Lake Mendota in Madison was, but ice thickened quickly. February’s warmth threatened ice cover on smaller lakes. Madison’s local lakes remained frozen through February, though small areas of open water had emerged on all three lakes by February 20.
Climate Corner
Though Wisconsin is known as America’s Dairyland, some corners of the state boast their ranking in a different industry: maple syrup production. Wisconsin is now the country’s third-largest syrup producer, creating a crop valued at $15 million per year.
The weather leading up to and during maple tapping season can determine how successful the harvest will be. Learn more about how weather drives the maple tapping season, Wisconsin’s history with maple syrup, and what our future climate could mean for producers in this month’s Climate Ed-ucation blog.
Climate Stats by Division
Temperature (degrees Fahrenheit)
Color Key
-
Dark blue: Record coolest
-
Royal blue: Bottom ⅒
-
Light blue: Bottom ⅓
-
White: Normal
-
Light orange: Top ⅓
-
Orange: Top ⅒
-
Red: Record warmest
| Division | Avg | Dept |
|---|---|---|
| Northwest | 22.4Top ⅓ | 6.2Top ⅓ |
| North Central | 21.7 :Top ⅓ | 5.6 :Top ⅓ |
| Northeast | 23.3 :Top ⅒ | 5.4:Top ⅒ |
| West Central | 25.5 :Top ⅒ | 6.2:Top ⅒ |
| Central | 26.6 :Top ⅒ | 5.9:Top ⅒ |
| East Central | 26.8 :Top ⅒ | 5.5:Top ⅒ |
| Southwest | 28.4 :Top ⅓ | 6.0:Top ⅓ |
| South Central | 28.8 :NTop ⅓ | 5.8:Top ⅓ |
| Southeast | 29.5 :Top ⅒ | 5.3:Top ⅒ |
| State | 25.0 :Top ⅓ | 5.8:Top ⅓ |
Snowfall (inches)
Color Key
-
Purple: Below Normal
-
White: Normal
-
Beige: Above Normal
| Division | Avg | Dept |
|---|---|---|
| Northwest | 7.8Below Normal | -3.8Below Normal |
| North Central | 12.0:Below Normal | -2.5:Below Normal |
| Northeast | 7.8:Below Normal | -3.8:Below Normal |
| West Central | 5.1:Below Normal | -5.0:Below Normal |
| Central | 7.2:Below Normal | -3.3:Below Normal |
| East Central | 4.9:Below Normal | -6.2:Below Normal |
| Southwest | 2.8:Below Normal | -7.1:Below Normal |
| South Central | 1.0:Below Normal | -9.4:Below Normal |
| Southeast | 2.7:Below Normal | -8.0:Below Normal |
| State | 6.8:Below Normal | -4.7:Below Normal |
Liquid-Equivalent Precipitation (Inches)
Color Key
-
Dark brown: Record driest
-
Light brown: Bottom ⅒
-
Beige: Bottom ⅓
-
White: Normal
-
Light green: Top ⅓
-
Green: Top ⅒
-
Dark green: Record wettest
| January 2026 | Since Nov. 1, 2025 | |||
|---|---|---|---|---|
| Division | Avg | Dept | Avg | Dept |
| Northwest | 0.70: Normal | -0.28: Normal | 4.22: Normal | -0.87: Normal |
| North Central | 1.16: Normal | 0.06: Normal | 5.97: Normal | 0.20: Normal |
| Northeast | 1.48: Top ⅓ | 0.40: Top ⅓ | 6.05: Normal | 0.22: Normal |
| West Central | 0.64 : Normal | -0.42: Normal | 4.67: Normal | -0.61: Normal |
| Central | 1.08: Normal | -0.01: Normal | 5.37: Normal | -0.36: Normal |
| East Central | 1.35: Normal | 0.18: Normal | 5.44: Normal | -0.96: Normal |
| Southwest | 0.63: Bottom ⅓ | -0.65: Bottom ⅓ | 4.70: Normal | -1.60: Normal |
| South Central | 0.49:Bottom ⅓ | -0.94:Botoom ⅓ | 4.36: Bottom ⅓ | -2.48: Bottom ⅓ |
| Southeast | 0.54: Bottom ⅓ | -1.02: Bottom ⅓ | 5.12 Normal | -2.22 Normal |
| State | 0.92:Normal | -0.22 Normal | 5.10 Normal | -0.76 Normal |
Monthly, seasonal, and annual temperature and precipitation values and rankings published in this report are from NOAA’s National Centers for Environmental Information at the time of posting this climate summary. Values and rankings can change after publishing our climate summaries. To check the most recent values and rankings, visit NOAA’s National Centers for Environmental Information Climate at a Glance Tool.
This report is a product of the Wisconsin State Climatology Office. For questions and comments, please contact us by email (stclim@aos.wisc.edu) or phone (608-263-2374).