The Rock River in southeastern Wisconsin has been flooding more frequently and with greater intensity in the last 30 years or so. This has been causing farmers in the area to lose valuable planting time, and in some years to effectively lose some fields entirely. The role of the SCO has been to figure out what is causing this flooding and what the flooding might look like under a future climate.
Establishing a Trend
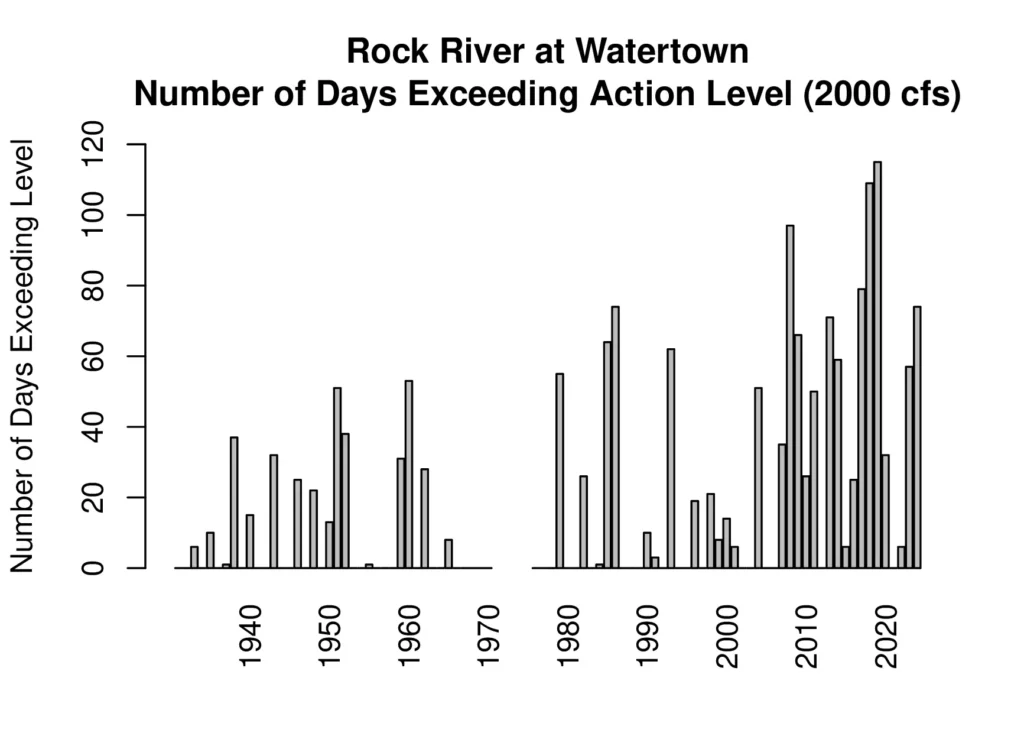
To characterize flooding, we can look at the data from the river gage at Watertown. This gage has been operational since 1931, so it can provide a long-term record of flooding in this area.
Minor flooding occurs when the gage reaches 2,000 cubic feet per second (cfs). Figure 1 shows the number of days each year that farmers along the Rock River experience at least minor flooding. Since 2000, it has been common for flooding to last for two to four months.
Additionally, the timing of the flooding has changed in the last 45 years.
Figure 2 shows the average daily flow of the river for different 15-year periods. In the first three periods (black, red, and orange lines, representing 1935-1979), there is a peak in the spring and relatively low flow for the rest of the year. The last three periods show a marked increase in the river flow in the autumn (green line, 1980-1994), summer (blue line, 1995-2009), or both (purple line, 2010-2024).
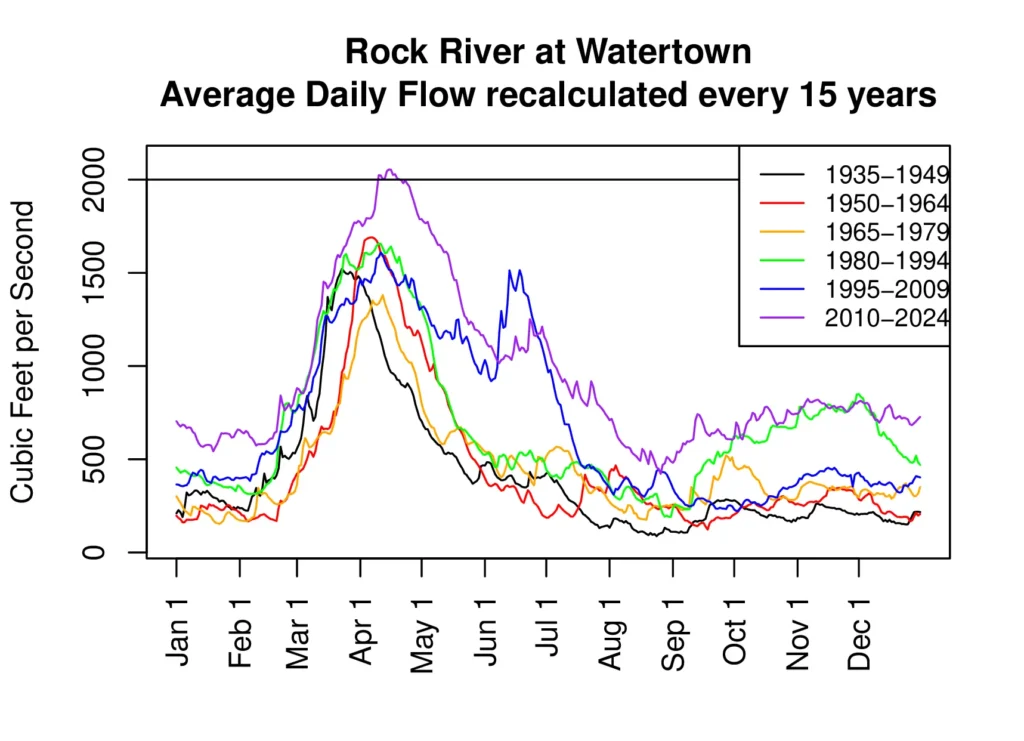
Although the 15-year averaged flow does not exceed 2000 cfs, the increase in the averaged flow is due to recorded floods during those times. In some years, the river will flood during the spring and during the summer or fall as well. You can imagine how difficult this makes planting for the farmers!
One of the things we are interested in is identifying what is causing the river to change. Two main factors may be having an effect: changes in precipitation and land use change (particularly an increase in artificial drainage in agriculture).
Changes in Precipitation
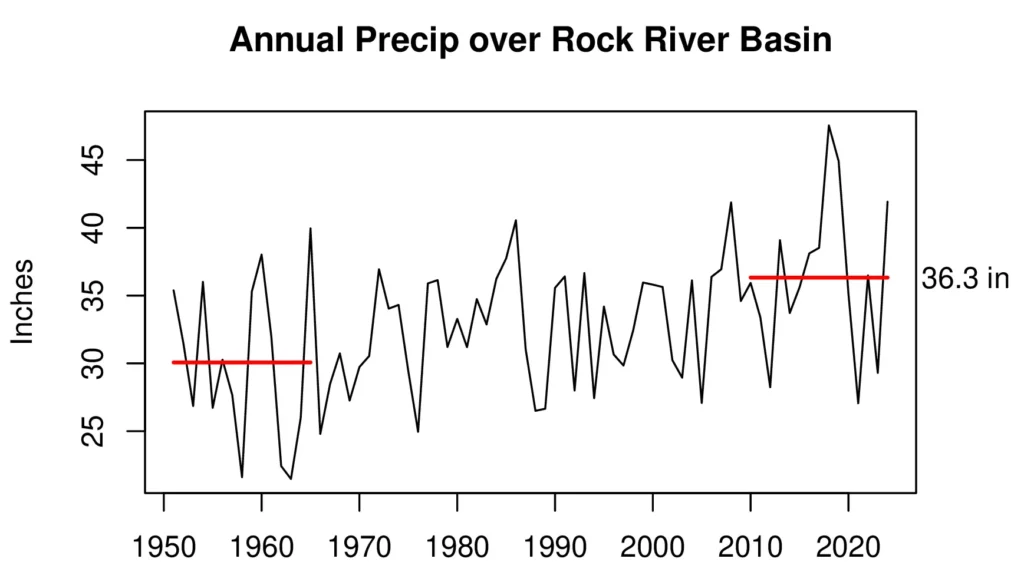
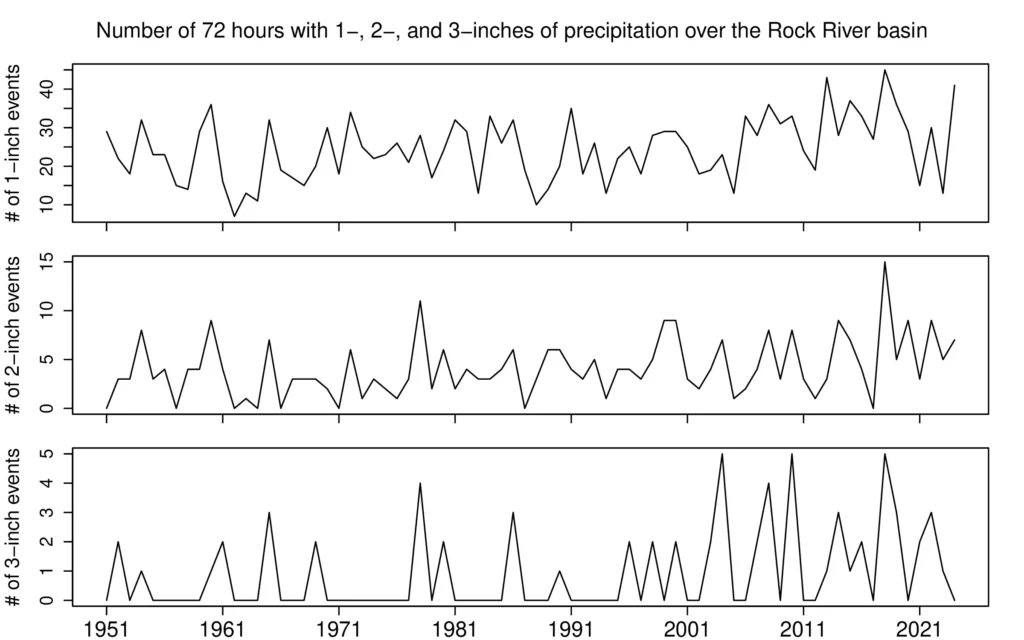
Precipitation has been changing in two ways: the total amount of precipitation is increasing, and individual rainfall events are becoming more intense. Figure 3 shows the annual precipitation over the Rock River basin from 1951 to 2024. Over this time, the total amount of precipitation has increased by 21%, from an annual average of 30 inches to 36.3 inches. Figure 4 shows the number of three-day periods each year that had one, two, and three inches of rain.
All three measures of intensity are increasing over time. Three-inch rainfall events in particular have increased dramatically since 2000.
Changes in Agriculture Practices
The other factor that we hypothesize might be contributing to the flooding is agricultural artificial drainage. Data on artificial drainage is surprisingly hard to come by, but anecdotally, many farms in this region started using artificial drainage in the early 1980s. Due to the lack of data, we need to infer the effects that the drainage has had on the river.
One way that we might approach this is to see if the relationship between precipitation and river discharge has changed. Figure 5 shows a plot of annual precipitation over the Rock River basin vs total discharge of the Rock River. Points in red are for the years 1951-1980, anecdotally, before the artificial drainage was widely used. The red line is the best-fit line for the points from this time period. Likewise, points in blue are for the years 1981-2024, with the blue line being the best-fit line for that time period.
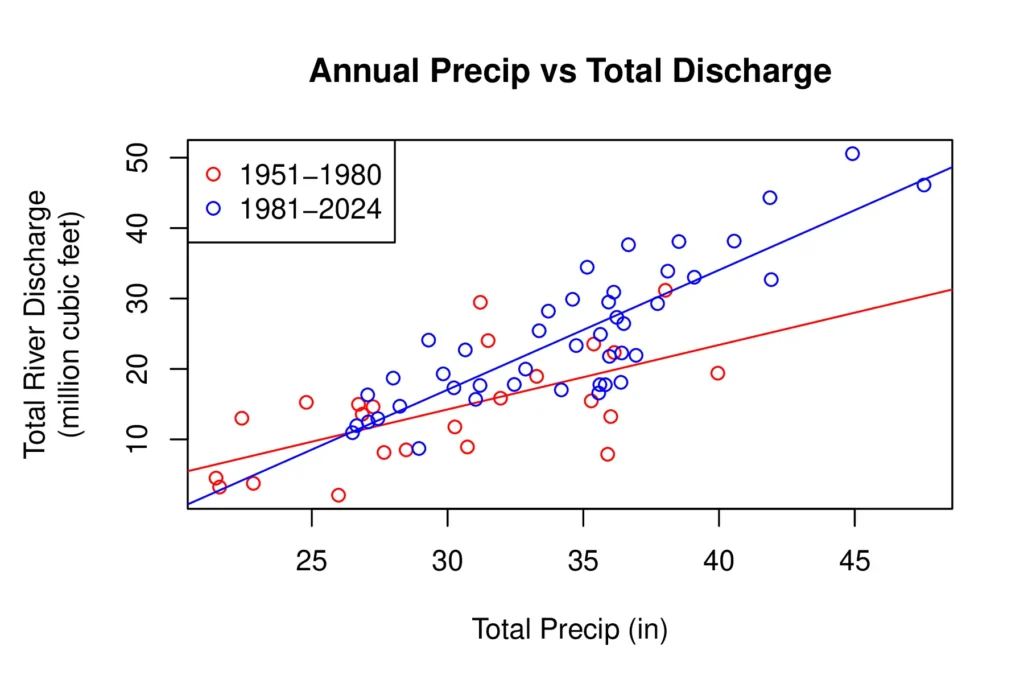
The slopes of the two lines are very different, but some of the difference in the slopes may actually be due to the characteristics of the precipitation rather than the presence of artificial drainage.
For example, in general, very heavy rainfall produces more runoff than lighter rainfall because the soil cannot absorb the water fast enough before it reaches the river. Additionally, more precipitation could keep the ground wetter, which decreases the amount of rain that the soil can absorb before becoming saturated.
This work is ongoing. The next step is to try a more complicated approach to characterize the relationship between rainfall and runoff and see if we can take into account the confounding factors described above. Finally, we will be using climate models to try and get an idea of what flooding might look like in the future.