Understanding frost and freeze risk is essential for managing crops and protecting plants in spring and fall. Two complementary tools — one for short-term forecasting to tell you what’s happening now and one for long-term climatology to show you what’s usually expected — can help you make informed decisions.
The National Weather Service Frost & Freeze Decision Support Tool is a weather-based product. It shows where conditions may be favorable for frost formation over the next seven days, using forecasted temperature and wind data. This short-term tool is most useful for immediate decision-making during the spring and fall.
The Midwestern Regional Climate Center Freeze Date Tool is a climate-based resource. It displays first and last freeze dates based on historical observations. This long-term perspective can help you understand what’s typical for your area and how conditions may be changing over time.
Used together, both tools provide you with a fuller view of both seasonal expectations and near-term risk.
National Weather Service Frost & Freeze Decision Support Tool
What it Is
Developed by the National Weather Service Forecast Office in Milwaukee, this tool displays where conditions may be favorable for frost formation over the next seven days. The page is active from March through October.
How it Helps
This product can help you better interpret the frost risk for your area. This tool provides more precise information about frost potential by accounting for both the probability of temperatures and wind speeds conducive to frost formation, rather than temperature alone, as a typical seven-day forecast would. This resource presents both numeric probabilities and a three-level risk ranking, providing information for the entire state of Wisconsin.
How to Read the Maps
 This tool does not directly forecast whether frost will occur. Instead, these maps depict the probability that a location will meet the selected temperature and wind speed thresholds.
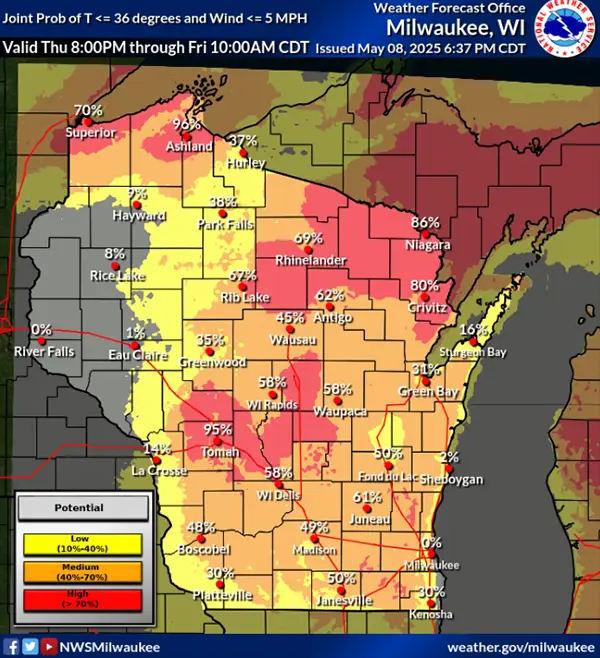
For example, this map shows that Tomah has a 95 percent chance of having a temperature at or below 36 degrees and winds less than or equal to 5 miles per hour. These calm, cool conditions are favorable for frost.
Why Wind Matters
Forecasting frost is not just about temperature, but also wind speed. The wind needs to be light enough to allow water droplets to settle onto surfaces and form into frost.
This product is still in the early phase of development — any suggestions you have for ways to improve the tool would be appreciated! You can email our office at stclim@aos.wisc.edu.
MRCC Freeze Date Climatology Tool
What it Is
Created by the Midwestern Regional Climate Center, this tool uses historical data to visualize freeze date patterns across the Midwest, including Wisconsin. It helps answer questions about typical and extreme freeze events in your county.
How it Helps
This resource allows you to explore how freeze timing has varied over time in your area. You can gather information like:
- Average first fall and last spring freeze dates
- Record early or late freeze events (e.g., 28 or 35 degrees Fahrenheit thresholds)
- Trends in the length of the growing season
- Whether freeze dates are shifting over time
By understanding historical freeze patterns, this tool can help with anticipating crop risks, scheduling planting or harvesting, or evaluating whether your growing season has shifted over time.
How to Read the Maps
You can view maps that show freeze dates based on various temperature thresholds (e.g., 28, 32, or 35 degrees Fahrenheit) and climatological percentiles (e.g., 10th, 50th, and 90th). For example, the 10th percentile shows dates that would be considered unusually early freezes, while the 90th percentile shows unusually late ones. This information helps you assess not just what’s typical, but also what’s possible.
For each county, you can also view graphs showing trends in freeze dates over time — including whether those changes are statistically significant.