January packed a season’s worth of weather into 31 days — record warmth, soaking rain, drought relief, and a late-month Arctic surge.
- Second consecutive colder-than-normal month.
- First wetter-than-average month since last July.
- Late-month cold boosted lake ice.
A 102-Degree Temperature Swing
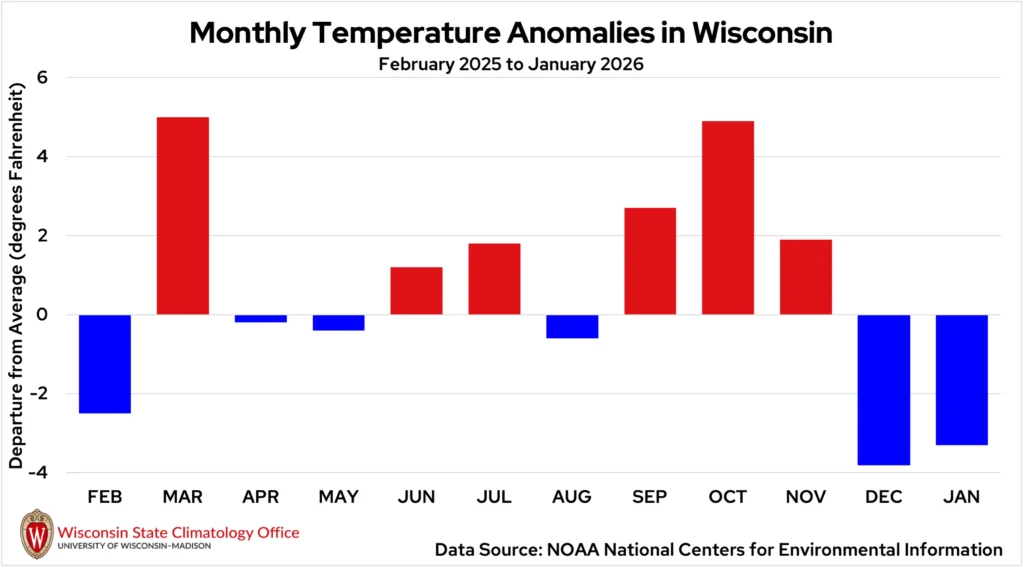
With brief early-spring warmth and one of the coldest Arctic outbreaks in recent years, January delivered quite the winter whiplash (Figure 1).
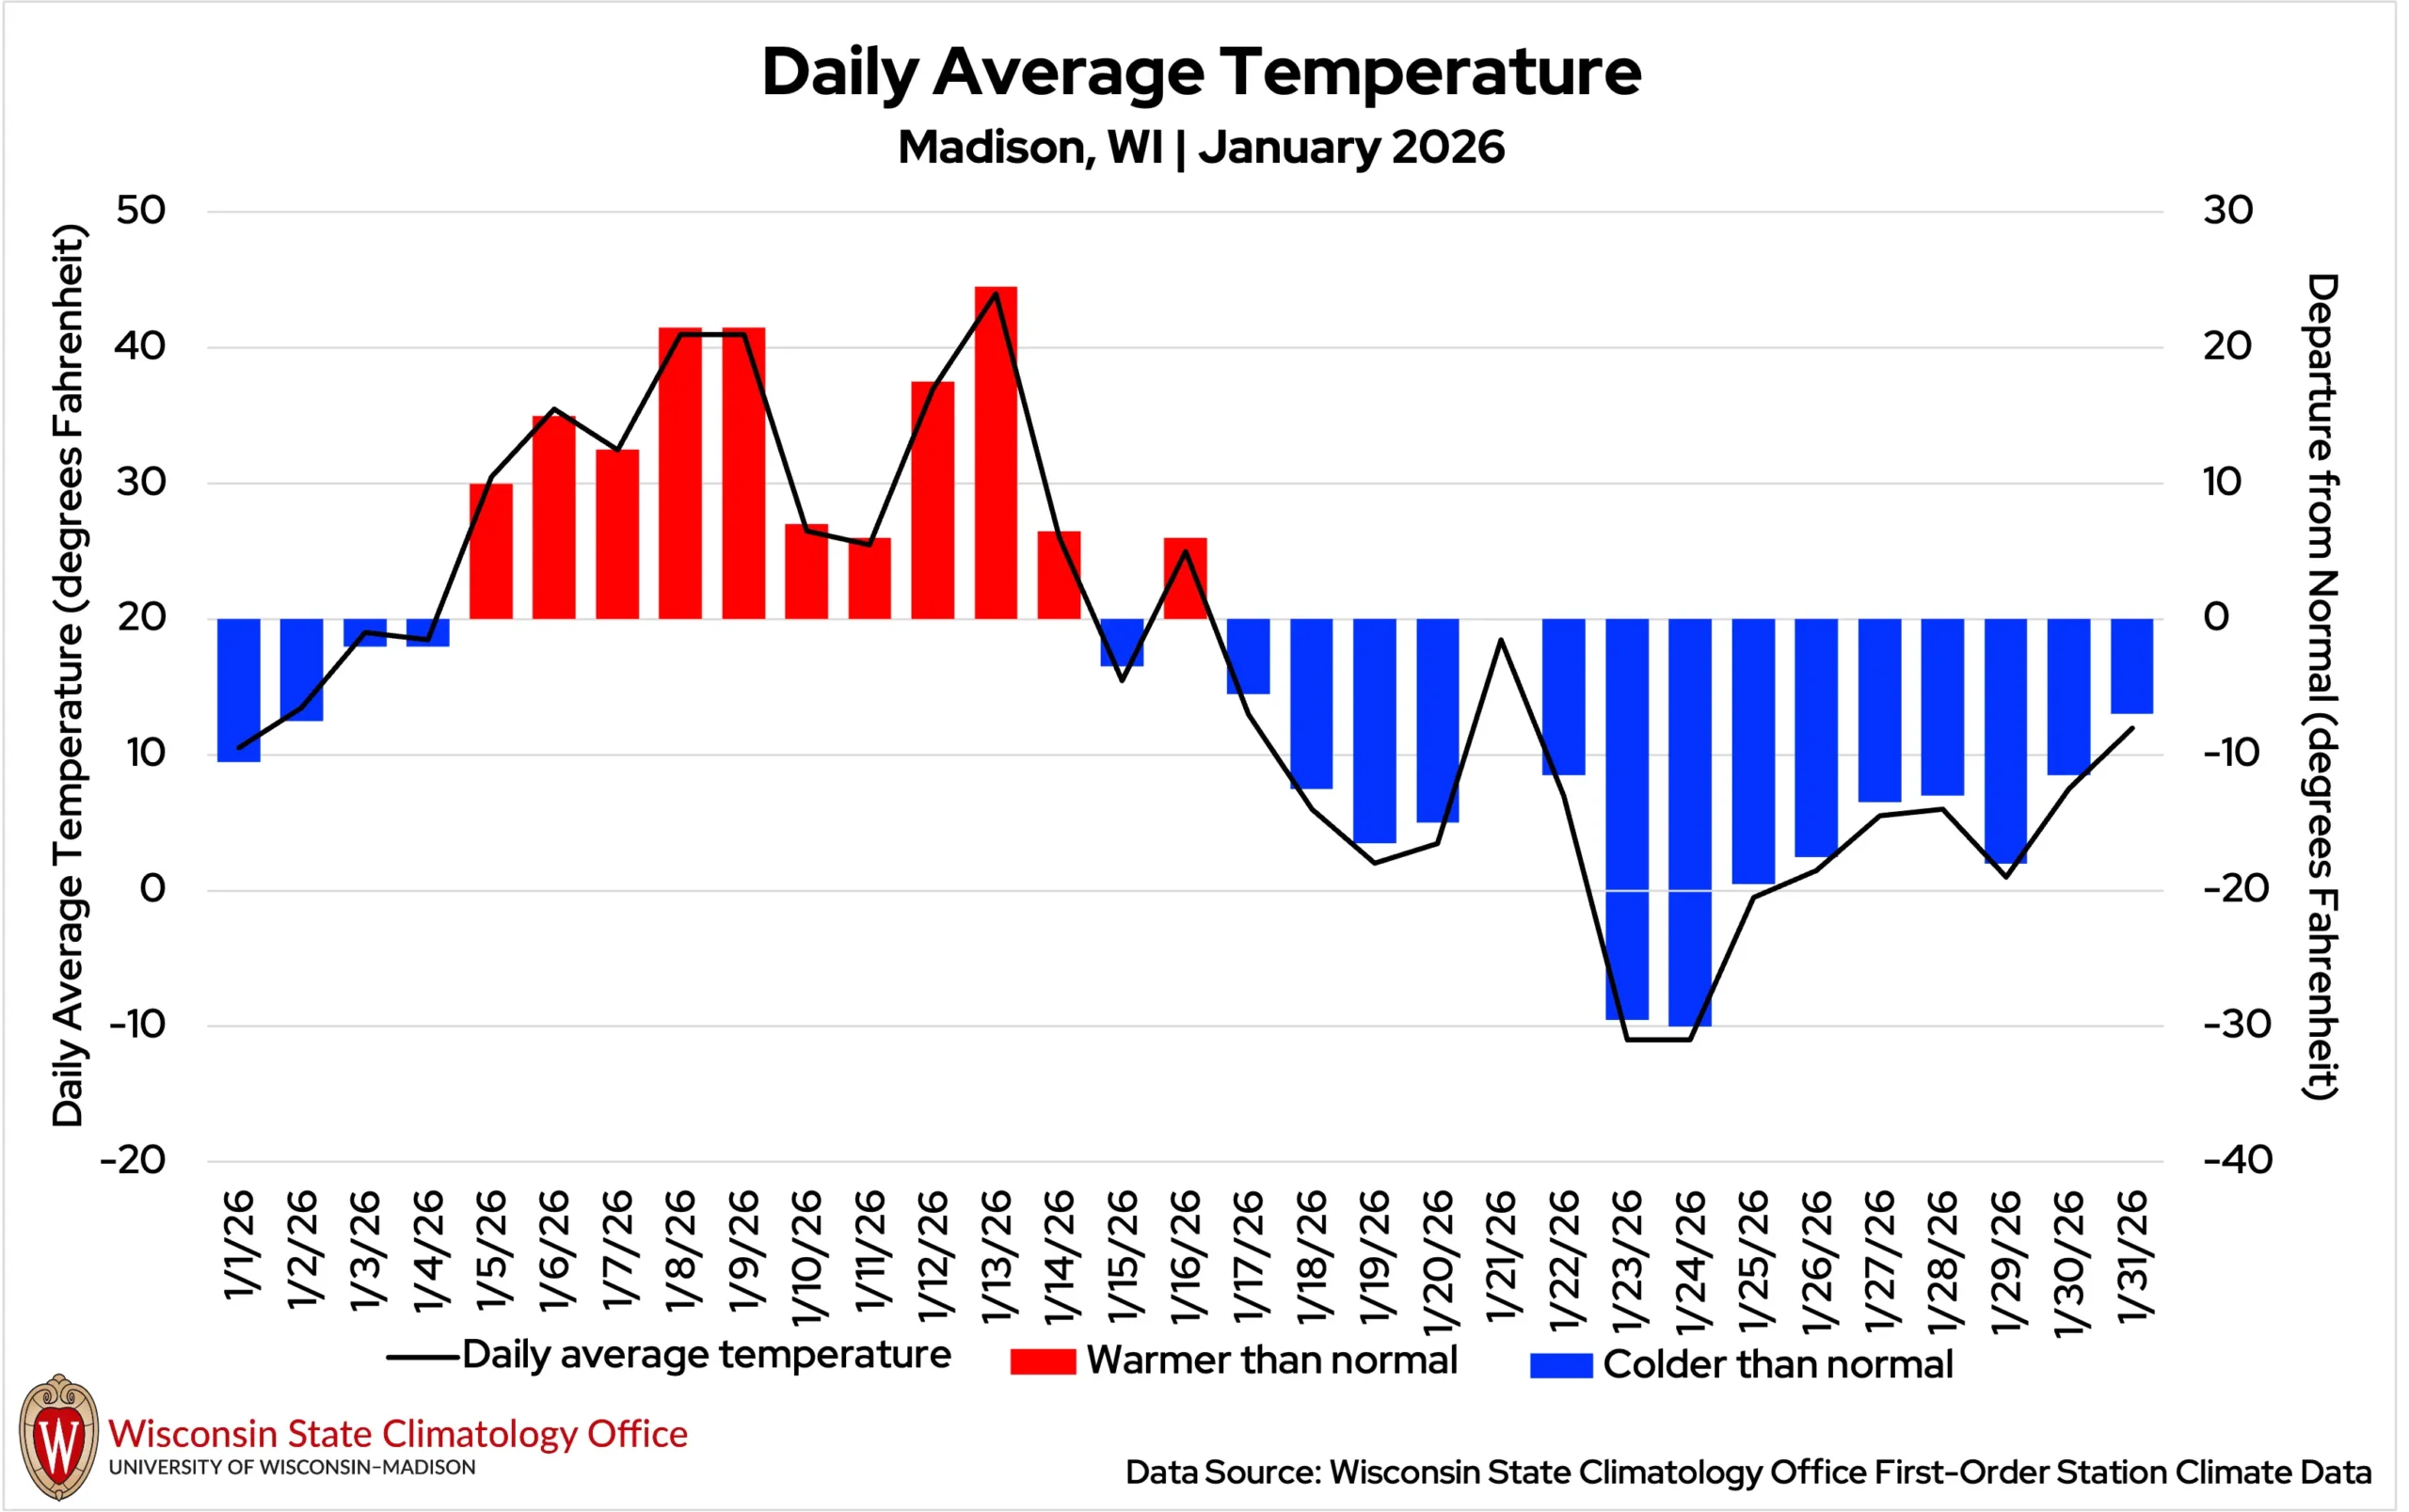
The month began on a chilly note, with the first few days averaging five to 10 degrees colder than normal.
Temperatures then climbed, culminating in exceptional warmth by mid-month. Multiple daily temperature records were tied or broken. Milwaukee reached 59 degrees on January 9, shattering its 2002 record by five degrees.
On January 13, Madison tied the old record high of 53 degrees (previously set in 1961). La Crosse recorded a daily warm low of 36 degrees, surpassing the old record of 34 degrees set in 1960.
That taste of spring was short-lived, however. By January 19, sub-zero temperatures were widespread, with wind chills dipping below minus 30 degrees.
The cold intensified from January 22 through 25, as Arctic air settled firmly over the region. Eau Claire, Wausau, Madison, and Green Bay spent 60 or more consecutive hours below zero — Wausau’s fourth-longest such stretch on record. Wind chills of minus 40 to 50 degrees or colder were felt by many. Rhinelander saw its coldest wind chill on record — a bone-chilling minus 56 degrees.
Mother Nature refused to let up through the end of the month. Five of Wisconsin’s six first-order stations saw 15 days straight with sub-freezing temperatures, and Wausau logged 17 such days. Wausau also endured 325 hours with sub-zero wind chills, the third-longest stretch on record for January.
Undoubtedly, Wisconsinites faced a plethora of impacts during this cold snap, and one such impact was increased heating needs.
Natural gas and electrical utilities rely on heating degree-day units (HDDUs) to anticipate their customers’ energy demand. When the average daily temperature is below 65 degrees, HDDUs accumulate.
This year, Wisconsin accumulated 1,556 HDDUs — 102 more than normal — indicating that heating demand was roughly seven percent higher than normal due to colder-than-normal temperatures.
Looking at January’s extremes, the state experienced a striking 102-degree temperature range. The warmest reading was a balmy 60 degrees seen in Union Grove and Racine (Racine County) on January 9 and 10, respectively. Meanwhile, the coldest temperature came on January 24, when the Wisconet station at Knight (Iron County) plunged to a brutal 41.6 degrees below zero.
While January’s temperature range has varied widely — from 113 degrees to 64 degrees — going back to 1885, only 18 other years have seen a range of 100 degrees or more — just two since 2000.
Although the mid-to-late month chill felt extraordinary, this period is historically when Wisconsin sees its lowest temperatures (Figure 2).
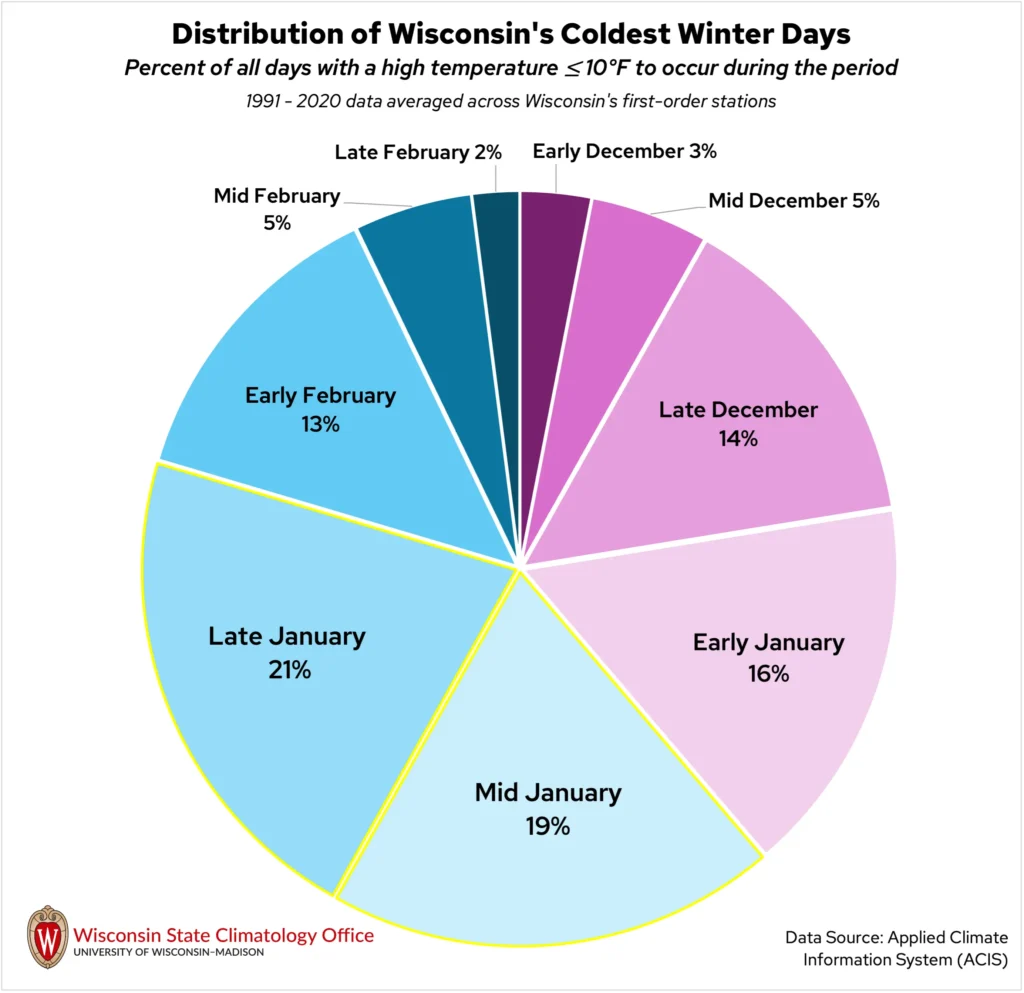
If 2026 follows that pattern, minus 41.6 degrees may stand as the coldest temperature of the entire year. Since 2000, there have only been four years in which Wisconsin’s coldest temperature of the entire year dropped to minus 40 or colder, underscoring how rare this level of cold has become.
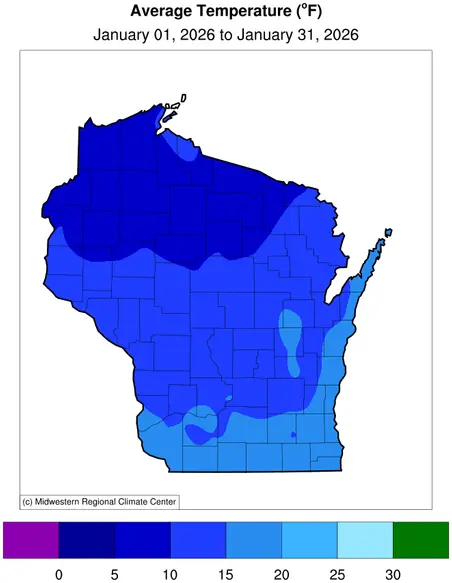
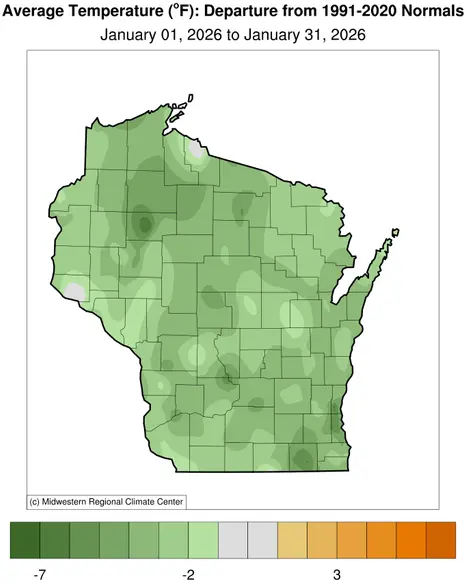
Amid the extremes, January averaged 12 degrees statewide, 3.3 degrees colder than normal — the second colder-than-normal month in a row (Figures 3 and 4). Together, December and January marked Wisconsin’s coldest back-to-back months compared to normal since January and February 2022.
January Showers
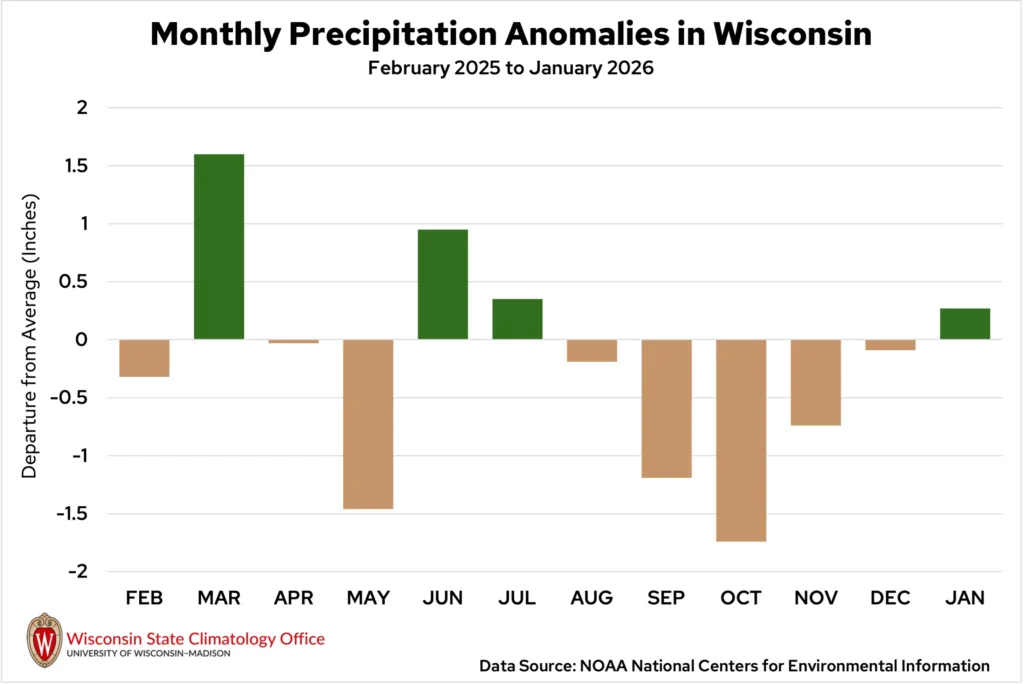
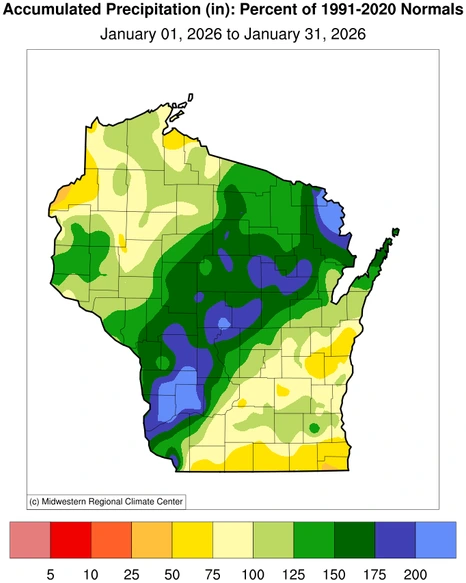
January was a wet month for most of Wisconsin, but not with the type of precipitation one would typically expect during the coldest month of the year. Early-month warmth led to rounds of rainshowers rather than snowshowers. Overall, January was 0.27 inches wetter than average, with a statewide average total of 1.48 inches (Figure 5).
Rounds of light showers on the morning of January 6 turned roads to ice in parts of central Wisconsin. Some schools opted for a two-hour delay due to poor road conditions. Rain totals were between a quarter and a half inch, and ice accumulation up to a tenth of an inch was seen.
On the eighth of the month, an unusually warm January weather system brought heavy rain to the state. In anticipation of the rain, the National Weather Service in Green Bay issued a flood watch — the first to be issued in Wisconsin in January since 2013.
A swath of one to two inches of rain stretched from the southwest to the northeast. Daily rainfall records were set in La Crosse (0.96 inches) and Wausau (0.78 inches). These totals nearly doubled the previous January 8 precipitation records that were set in 1937 in both cities.
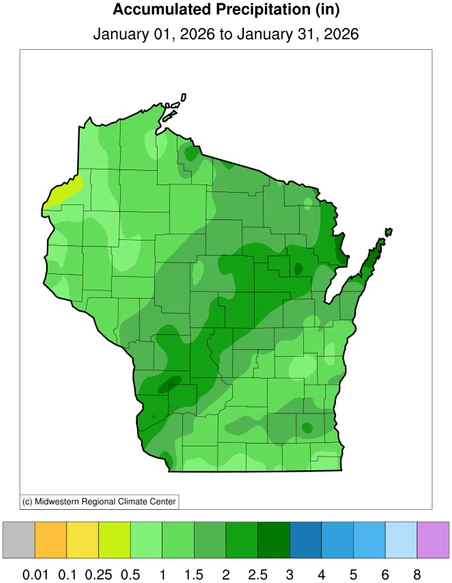
While these rain totals may not seem significant compared to rain totals seen in summer months, January is typically Wisconsin’s driest month. Between January 8 and 9, Wausau received 104 percent of its average January precipitation, while La Crosse received 94 percent (Figure 6).
Cooler temperatures through the rest of the month allowed for snow rather than rain, though no major storms impacted the state.
A band of snow developed behind a cold front on January 17 and produced incredibly fluffy snow in southern Wisconsin. A typical snow-to-liquid ratio in Wisconsin is 13 to one — 13 inches of snow equals one inch of liquid precipitation. A lower snow ratio produces heavy, wet snow that’s good for snowballs. The snow ratio for this event was 60 to one, so this snow was light as a feather!
Fluffier snow accumulates more quickly as it doesn’t compact as it falls. As a result, Madison set a new daily snowfall record of 5.6 inches, breaking the previous record of 5.0 inches on January 17, 1953.
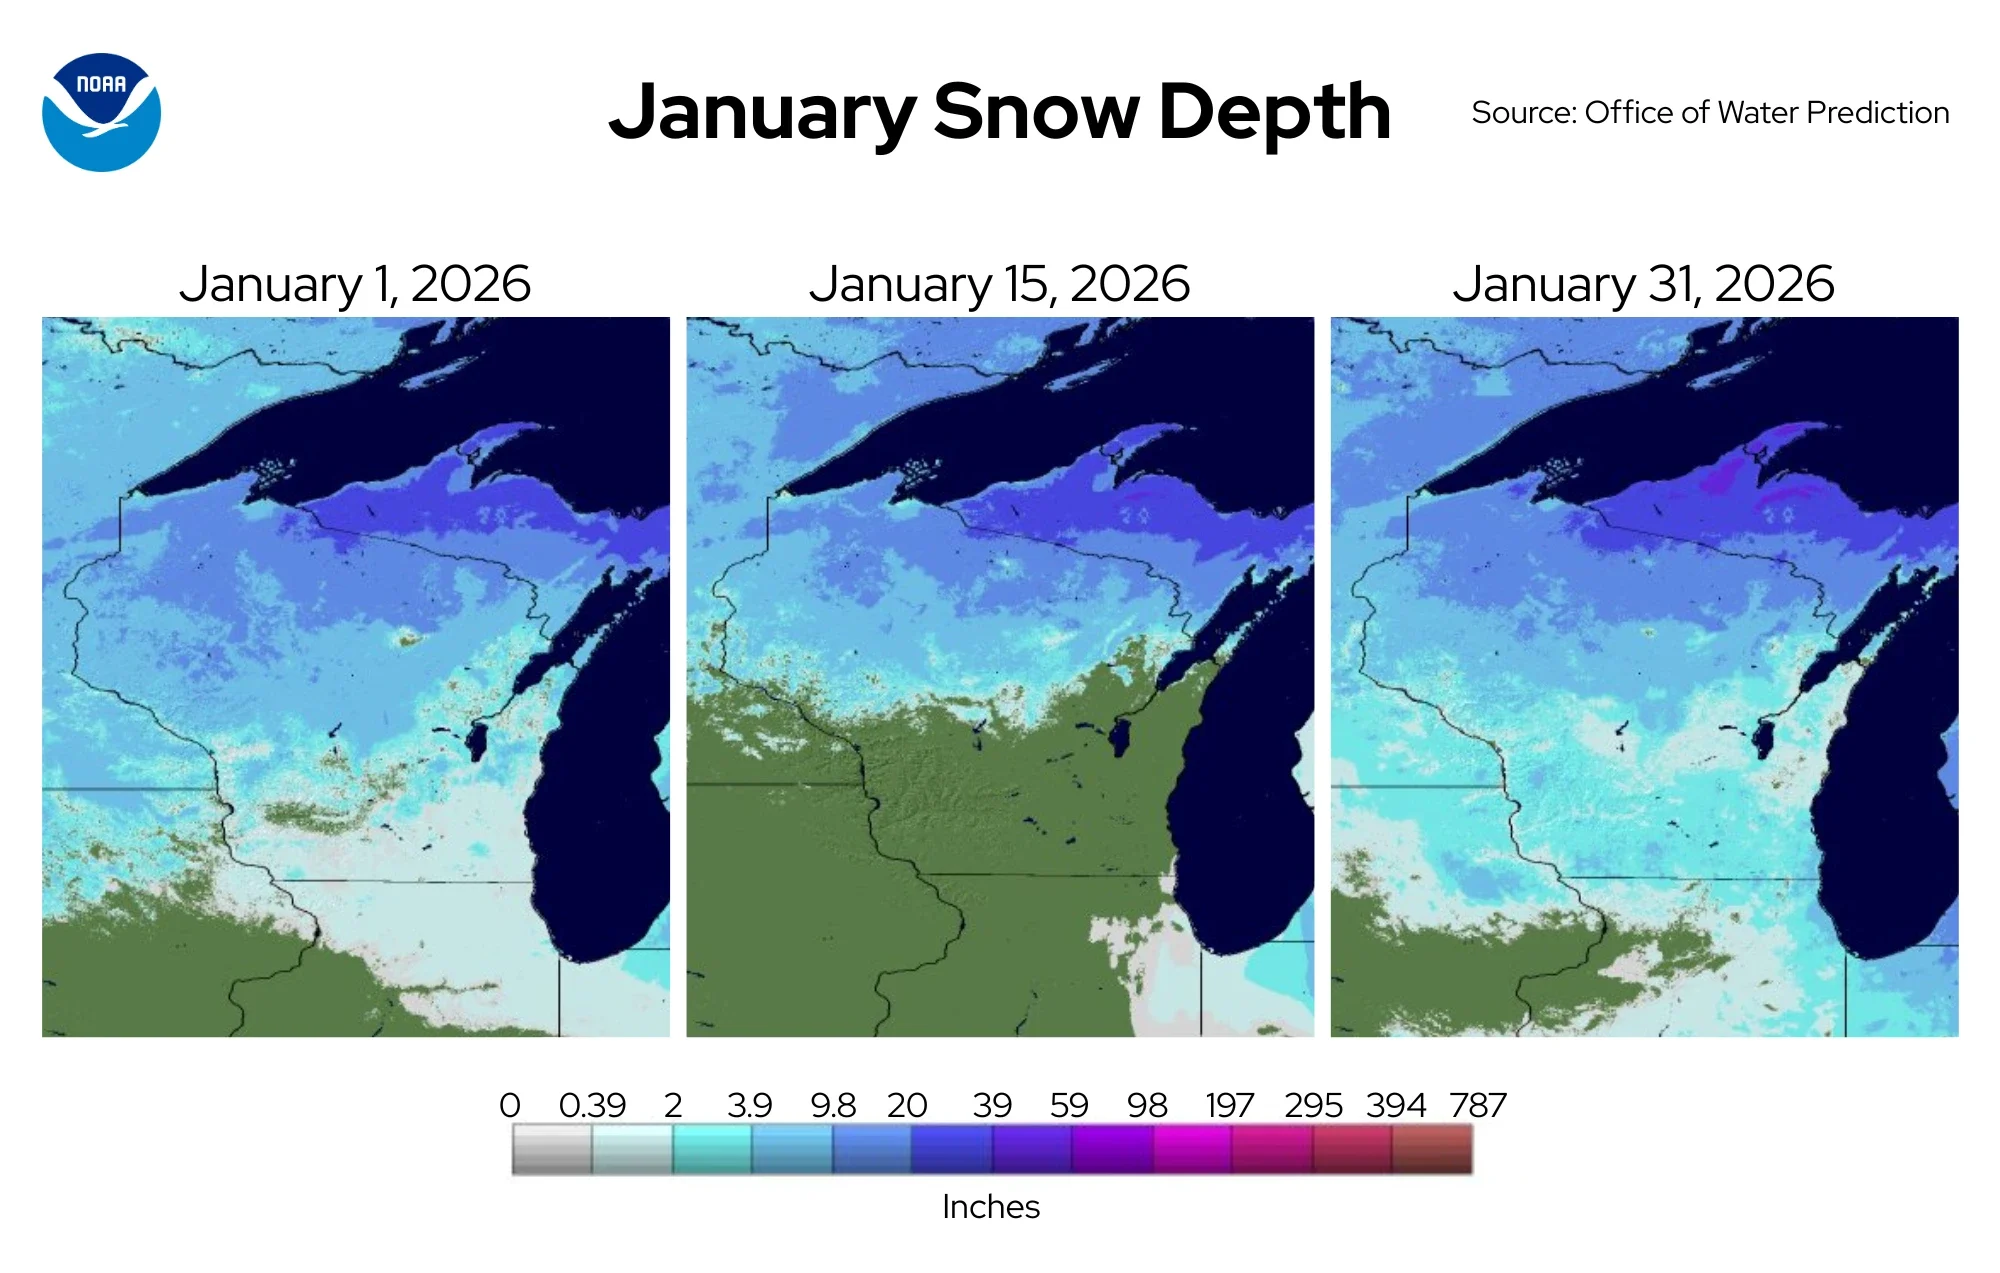
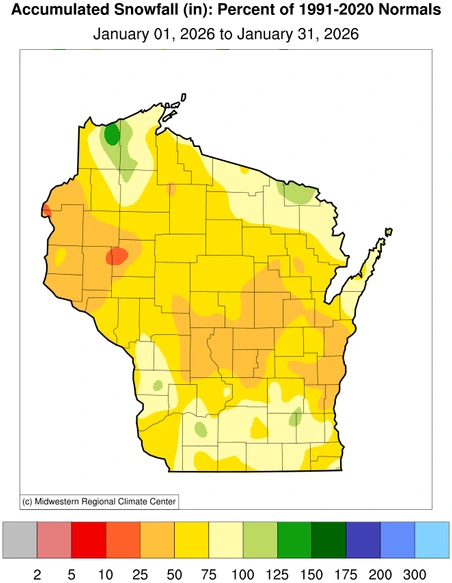
Throughout the month, snowpack was persistent across the northern half of Wisconsin. For the southern half of the state, the snow began to fade by mid-month due to warm temperatures and rainfall (Figure 7).
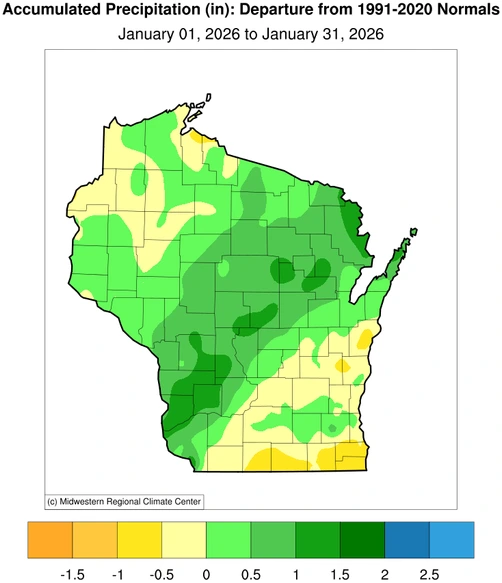
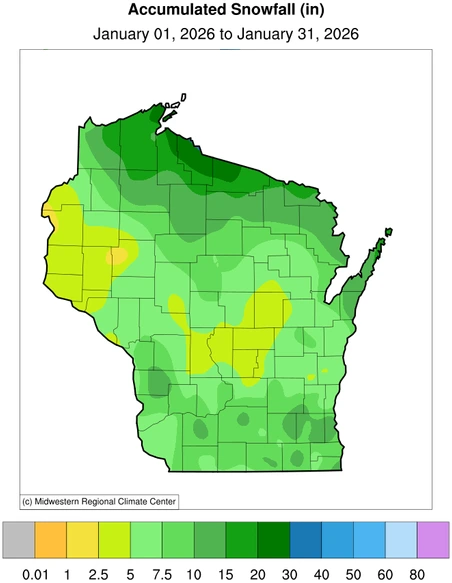
Additional small snow systems through the end of the month helped rebuild the pack, adding a few inches here and there, but did little to deepen it (Figure 8).
Drought Abates
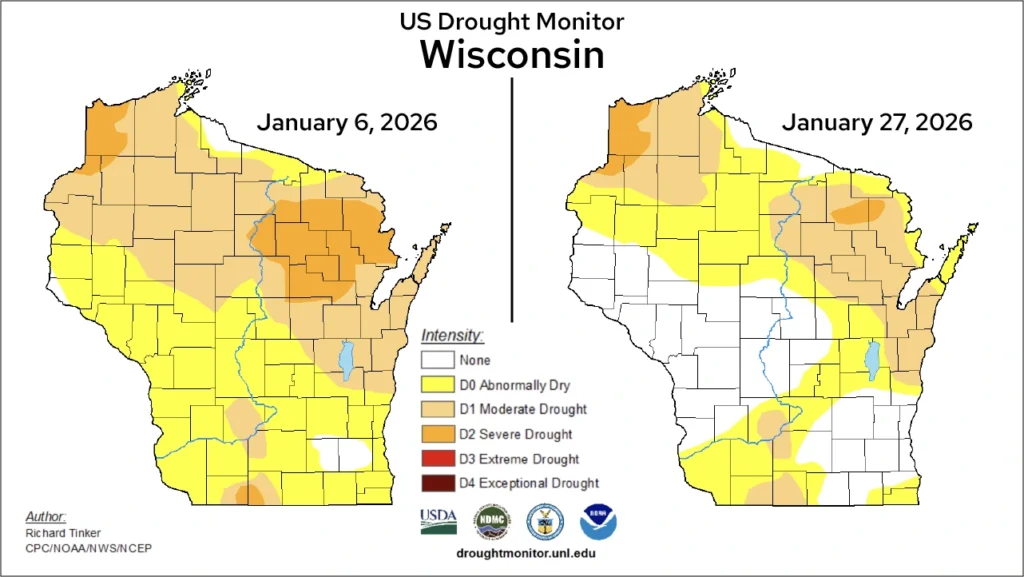
Drought conditions from the fall season persisted in Wisconsin through the beginning of January. However, mid-month warmth allowed melted snow and rainfall to seep into thawed soils, alleviating some of the dryness.
A large reduction in severe drought (D2) was seen in northeastern Wisconsin. Areas of abnormal dryness (D0) shrank substantially in western, central, and southern counties (Figure 9).
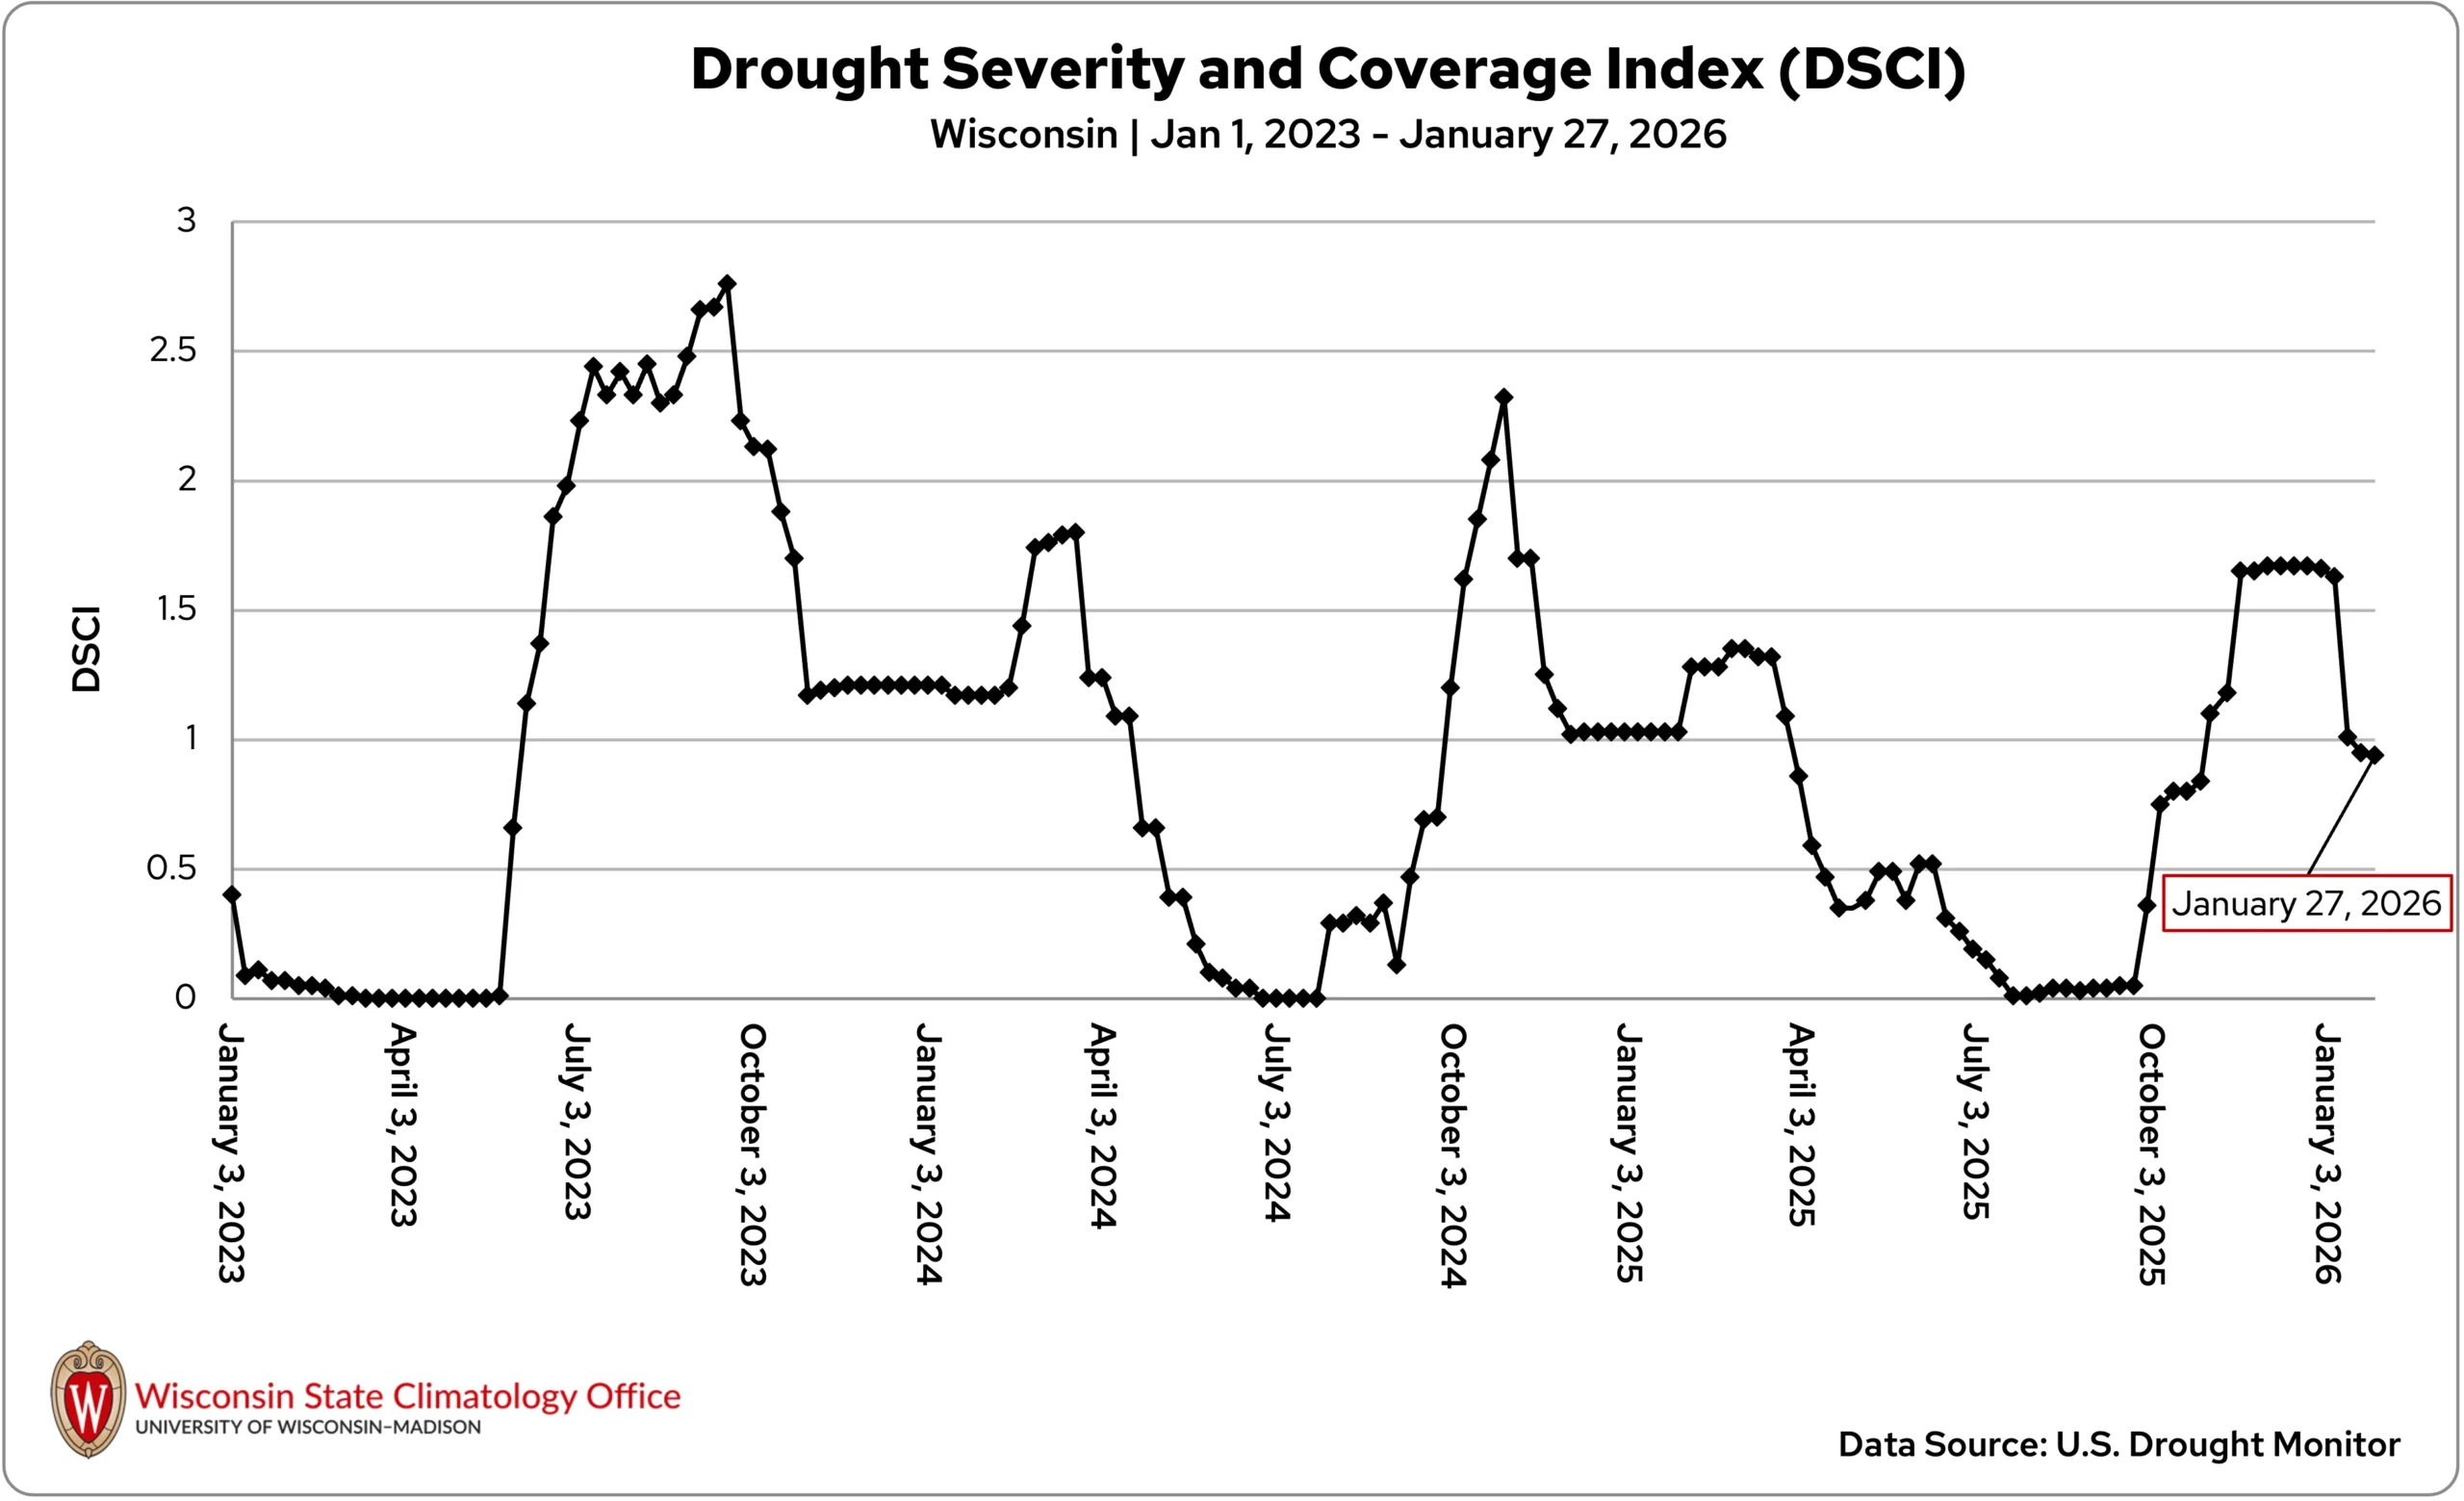
Despite the state having entered the winter season with the driest conditions since 2012, January’s precipitation brought Wisconsin’s Drought Severity and Coverage Index (DSCI) to the lowest it’s been in the past two winter seasons (Figure 10). This also goes to show how dry the previous two winter seasons have been.
If this trend continues in February, Wisconsin could begin the spring growing season with promising soil moisture.
Lake Ice
January’s temperature swings were reflected on Wisconsin’s lakes. Lake Mendota was officially declared closed on New Year’s Day, but by mid-month, above-freezing temperatures and strong winds were threatening ice cover.
Nonetheless, clear, cold, and calm nights meant none of Madison’s three lakes officially opened. Once temperatures turned consistently sub-freezing, ice cover strengthened. By late January, reports indicated around a foot of ice on Lake Mendota near the Edgewater Hotel.
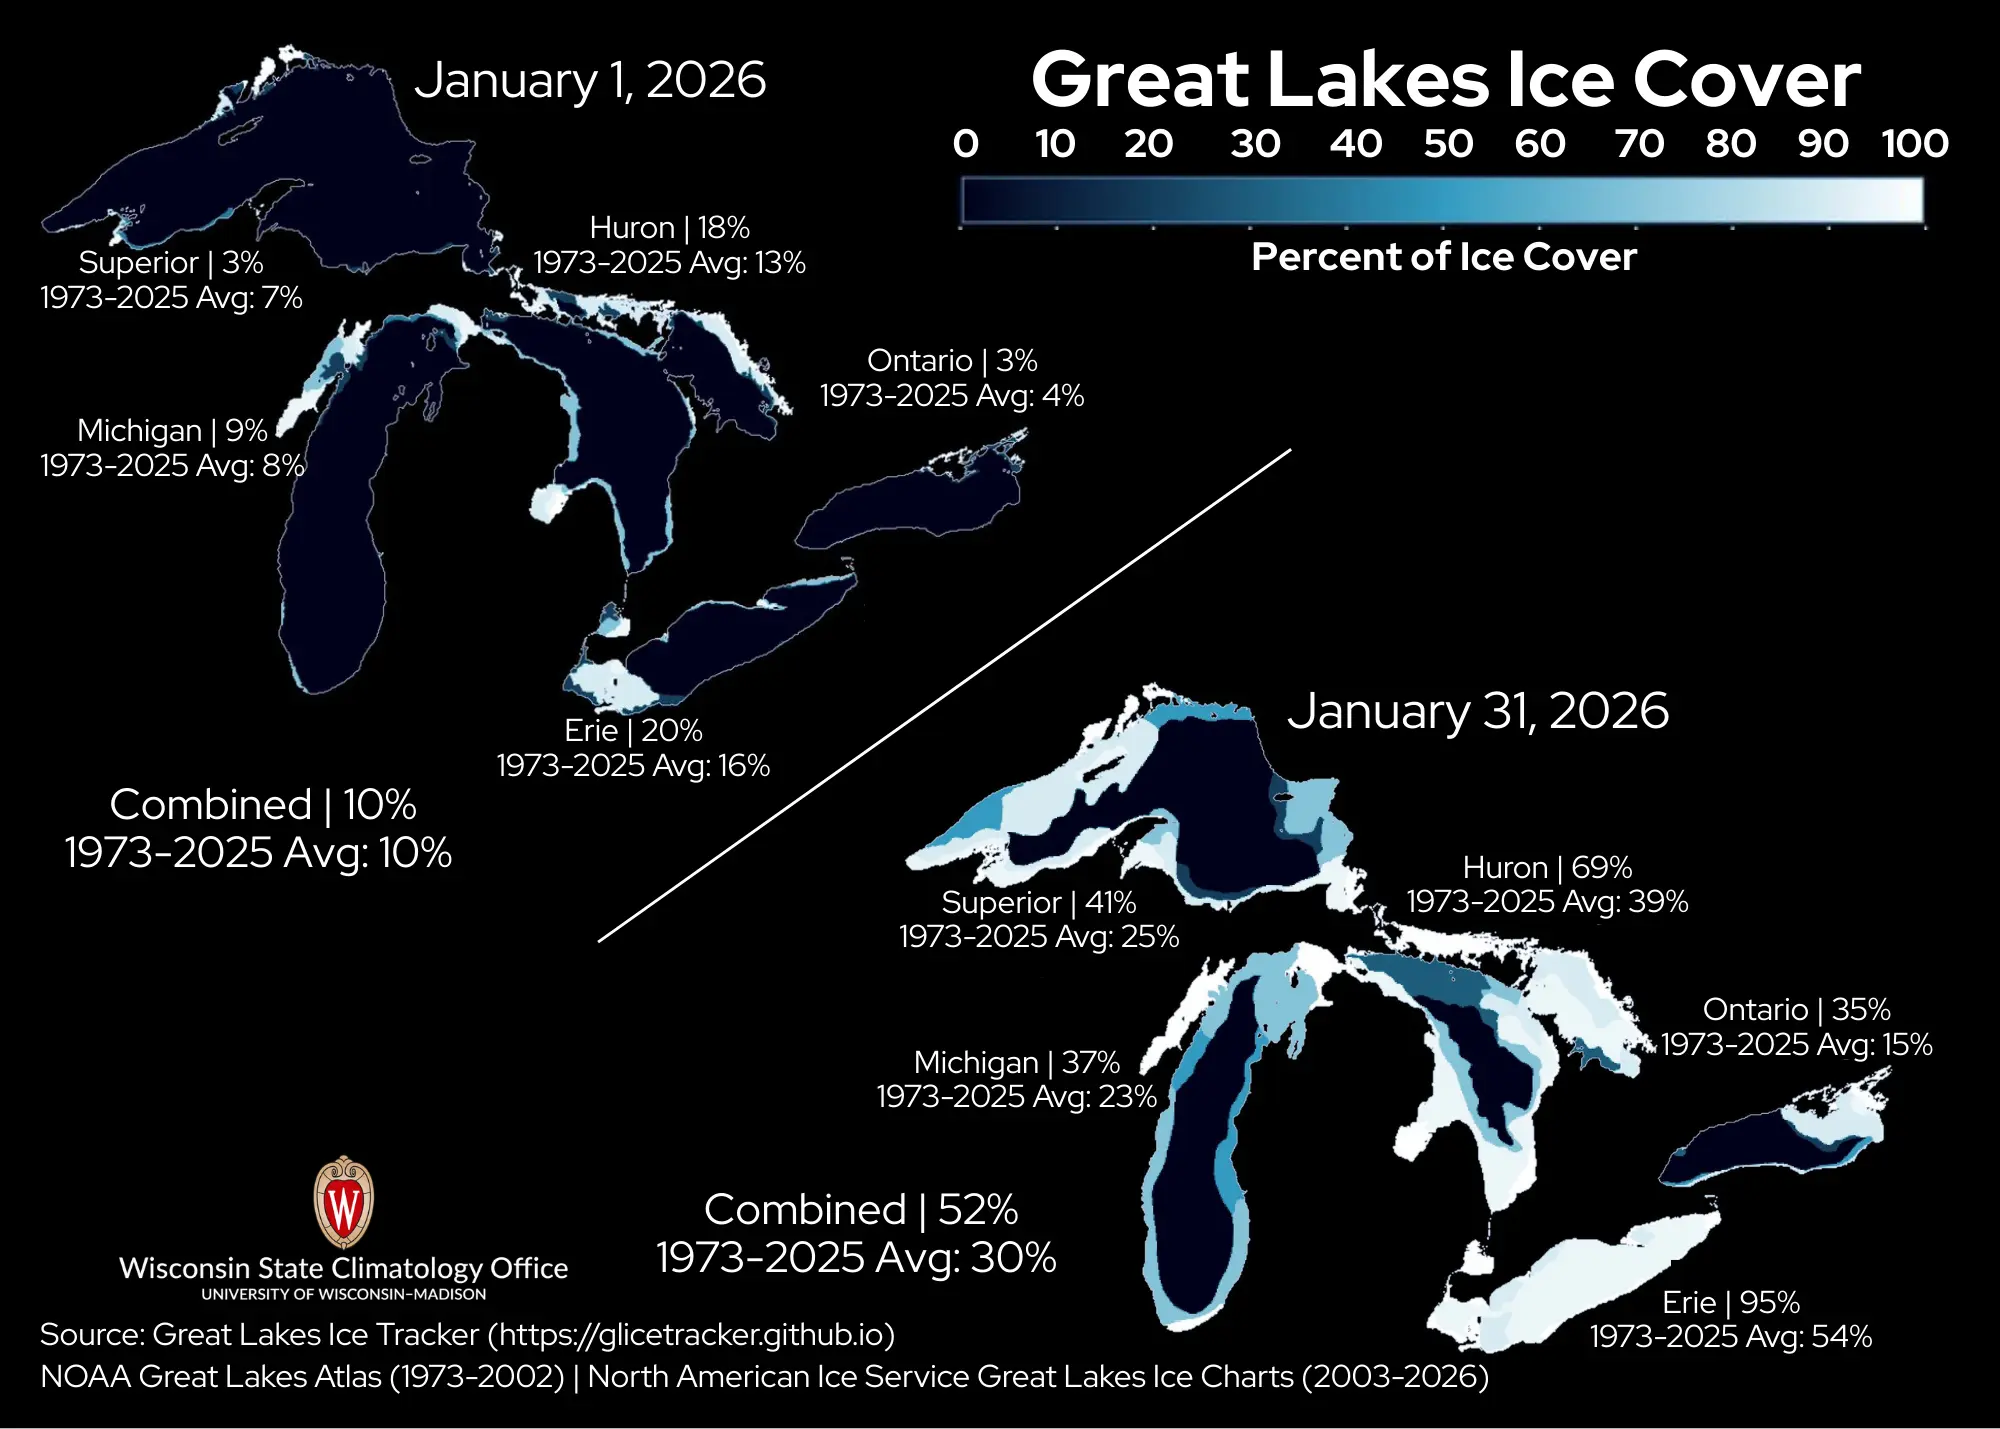
Across the Great Lakes, ice cover followed a similar pattern. At the start of January, about 10 percent of the lakes were ice-covered — near average — before dipping to six percent by January 14. As Arctic air arrived later in the month, ice cover surged — most notably on Lake Erie, which jumped from two to 95 percent ice-covered between January 14 and 31. Overall, the Great Lakes finished January 52 percent ice-covered, well above average (Figure 11).
Climate Corner
Over the last 142 years, nearly half of the Badger State’s coldest temperatures have occurred in January. As we saw in January 2026, cold Arctic air masses drifting southward can create some of the state’s most frigid conditions.
Dive into the records of Wisconsin’s most extreme cold temperatures in this month’s Climate Ed-ucation blog.
Climate Stats by Division
Temperature (degrees Fahrenheit)
Color Key
-
Dark blue: Record coolest
-
Royal blue: Bottom ⅒
-
Light blue: Bottom ⅓
-
White: Normal
-
Light orange: Top ⅓
-
Orange: Top ⅒
-
Red: Record warmest
| Division | Avg | Dept |
|---|---|---|
| Northwest | 8.7Normal | -3.3Normal |
| North Central | 8.6:Normal | -3.9:Normal |
| Northeast | 11.2:Normal | -3.3:Normal |
| West Central | 12.0:Normal | -2.9:Normal |
| Central | 13.2:Normal | -3.1:Normal |
| East Central | 15.3:Normal | -2.9:Normal |
| Southwest | 15.4:Normal | -2.7:Normal |
| South Central | 16.0:Normal | -3.1:Normal |
| Southeast | 17.0:Bottom ⅓ | -3.7:Bottom ⅓ |
| State | 12.0:Normal | -3.3:Normal |
Snowfall (inches)
Color Key
-
Purple: Below Normal
-
White: Normal
-
Beige: Above Normal
| Division | Avg | Dept |
|---|---|---|
| Northwest | 11.8Below Normal | -0.8Below Normal |
| North Central | 13.6:Below Normal | -3.8:Below Normal |
| Northeast | 8.8:Below Normal | -5.1:Below Normal |
| West Central | 5.8:Below Normal | -5.4:Below Normal |
| Central | 6.4:Below Normal | -5.5:Below Normal |
| East Central | 7.1:Below Normal | -6.4:Below Normal |
| Southwest | 7.8:Below Normal | -3.5:Below Normal |
| South Central | 8.9:Below Normal | -2.6:Below Normal |
| Southeast | 9.5:Below Normal | -3.1:Below Normal |
| State | 9.5:Below Normal | -3.7:Below Normal |
Liquid-Equivalent Precipitation (Inches)
Color Key
-
Dark brown: Record driest
-
Light brown: Bottom ⅒
-
Beige: Bottom ⅓
-
White: Normal
-
Light green: Top ⅓
-
Green: Top ⅒
-
Dark green: Record wettest
| January 2026 | Since Nov. 1, 2025 | |||
|---|---|---|---|---|
| Division | Avg | Dept | Avg | Dept |
| Northwest | 0.88: Normal | -0.13: Normal | 3.50: Normal | -0.61: Normal |
| North Central | 1.69: Top ⅓ | 0.48: Top ⅓ | 4.82: Normal | 0.15: Normal |
| Northeast | 1.95: Top ⅓ | 0.72: Top ⅓ | 4.55: Normal | -0.20: Normal |
| West Central | 1.36: Top ⅓ | 0.30: Top ⅓ | 4.03: Normal | -0.19: Normal |
| Central | 1.78: Top ⅓ | 0.60: Top ⅓ | 4.25: Normal | -0.38: Normal |
| East Central | 1.53: Normal | 0.08: Normal | 4.20: Normal | -1.03: Normal |
| Southwest | 1.84: Top ⅓ | 0.59: Top ⅓ | 4.04: Normal | -0.98: Normal |
| South Central | 1.17:Normal | -0.26:Normal | 3.75: Bottom ⅓ | -1.67: Bottom ⅓ |
| Southeast | 1.32: Normal | -0.32:Normal | 4.57 Normal | -1.21 Normal |
| State | 1.48:Top ⅓ | 0.27Top ⅓ | 4.18 Normal | -0.54 Normal |
Monthly, seasonal, and annual temperature and precipitation values and rankings published in this report are from NOAA’s National Centers for Environmental Information at the time of posting this climate summary. Values and rankings can change after publishing our climate summaries. To check the most recent values and rankings, visit NOAA’s National Centers for Environmental Information Climate at a Glance Tool.
This report is a product of the Wisconsin State Climatology Office. For questions and comments, please contact us by email (stclim@aos.wisc.edu) or phone (608-263-2374).