June lured Wisconsin into a false sense of comfort during the first half of the month, before extreme heat, humidity, and waves of severe weather entered during the second half.
Summer Heat Wave
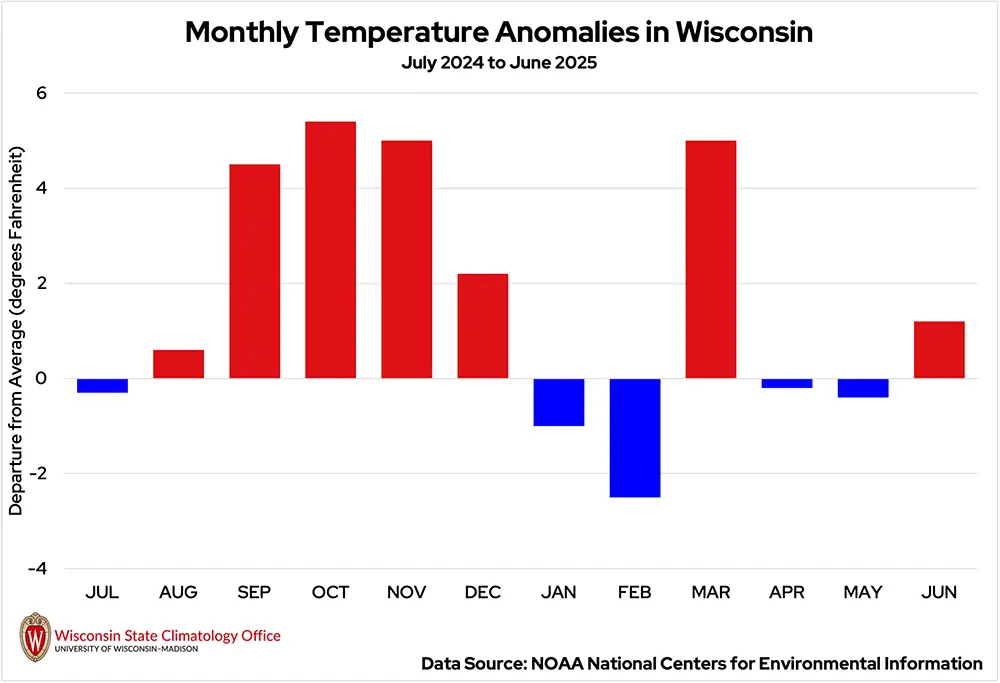
June finished 1.2 degrees (Fahrenheit) above the 1991 to 2020 statewide average of 65.1 degrees, continuing the near-normal trend Wisconsin has experienced recently (Figures 1 and 2). However, we know late last month was anything but normal.
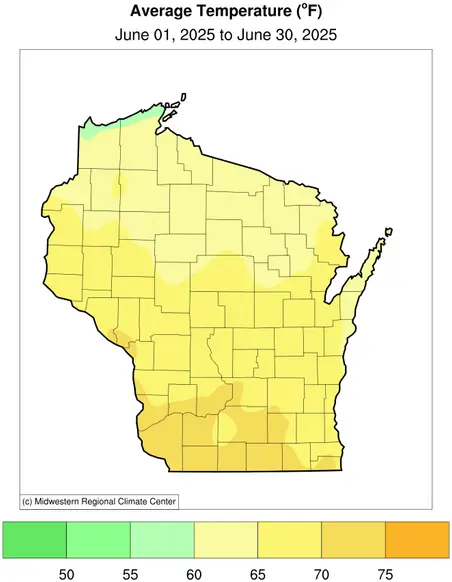
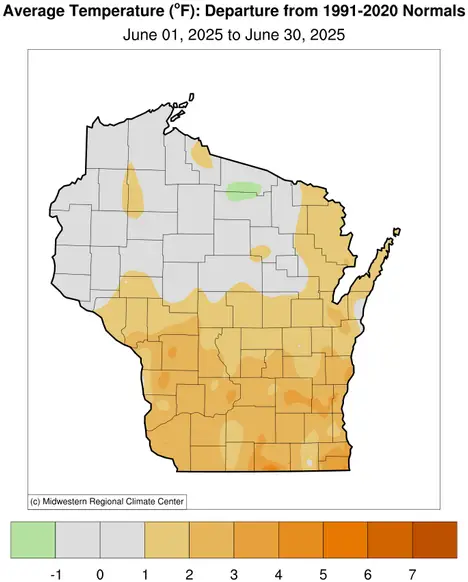
For the first 19 days of June, Wisconsin temperatures hovered near normal, slightly warmer in the south and cooler in the north. The coldest temperature of the month in all of Wisconsin was a frosty 29 degrees on June 13 in Eagle River (Vilas County). But the early-month calm was broken by a dangerous heat wave from June 20 to 23, when average statewide temperatures surged more than 11 degrees above the normal (66.6 degrees) for those four days. The highest heat index during this stretch was 111 degrees in Winter (Sawyer County) on June 22 — a fittingly ironic name.
What made this event especially prominent was its persistence. Eau Claire spent 80 straight hours at or above 80 degrees, nearly doubling its previous record of 42 hours set in June 1991. La Crosse, Wausau, and Green Bay all tied records for warmest overnight lows — some standing for nearly a century (Table 1). More on the heat wave’s setup and impacts can be found in our Wisconsin Climate Chronicles blog, “The First Heat Wave of Summer 2025.”
| Location | Date | 2025 Low Temperature | Previous Record for Low Temperature |
|---|---|---|---|
| Madison | June 21 | 75°F | 75°F in 1874 |
| La Crosse | June 21 | 79°F | 74°F in 1943 |
| Eau Claire | June 21 | 80°F | 72°F in 1923 |
| Milwaukee | June 22 | 78°F | 73°F in 1921 |
| Madison | June 22 | 78°F | 74°F in 1874 |
| Wausau | June 22 | 78°F | 70°F in 1923 |
| Green Bay | June 22 | 79°F | 71°F in 1911 |
| La Crosse | June 22 | 80°F | 75°F in 1983 |
| Eau Claire | June 22 | 82°F | 72°F in 1983 and 1923 |
| Milwaukee | June 23 | 76° | 76° in 1911 |
The extreme heat disrupted daily life: events at Wilmot Raceway and Dells Raceway Park, Madison’s Movie at the Glen, and Milwaukee’s Makers Market were canceled.
The heat also impacted Infrastructure and placed additional strain on utility crews, with power outages and 53 pavement buckles reported— part of a rising trend of heat-related road damage.
Relief arrived the evening of June 23, when a cold front brought storms and cooler temperatures. Morning lows dropped into the 60s on June 24. However, the muggy air refused to budge. Dew points in the 60s and 70s lingered for days following the heat wave, especially in southern Wisconsin, making it feel downright tropical.
No Shortage of Summer Downpours
June is typically the wettest month in Wisconsin, and for most, this June was no different! The north, west, and central parts of Wisconsin saw numerous rounds of showers and heavy downpours this month, though many of them fizzled out by the time they reached eastern Wisconsin.
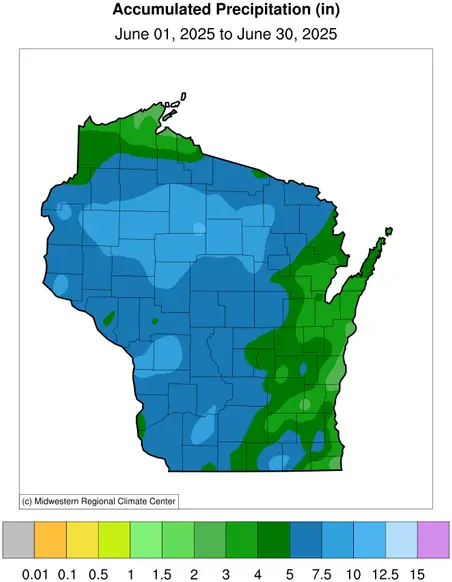
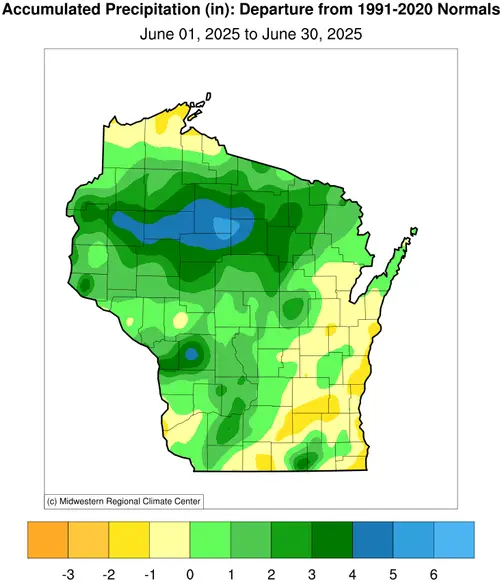
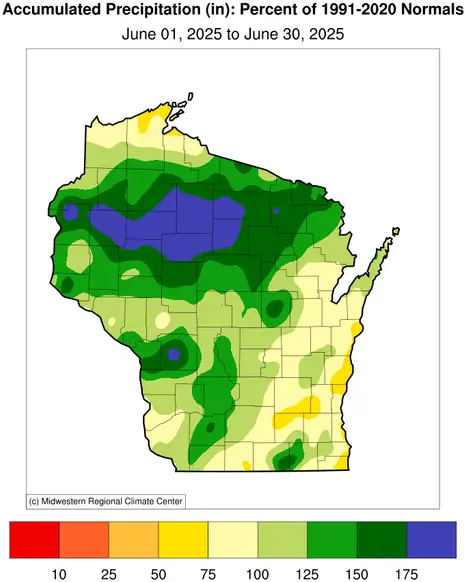
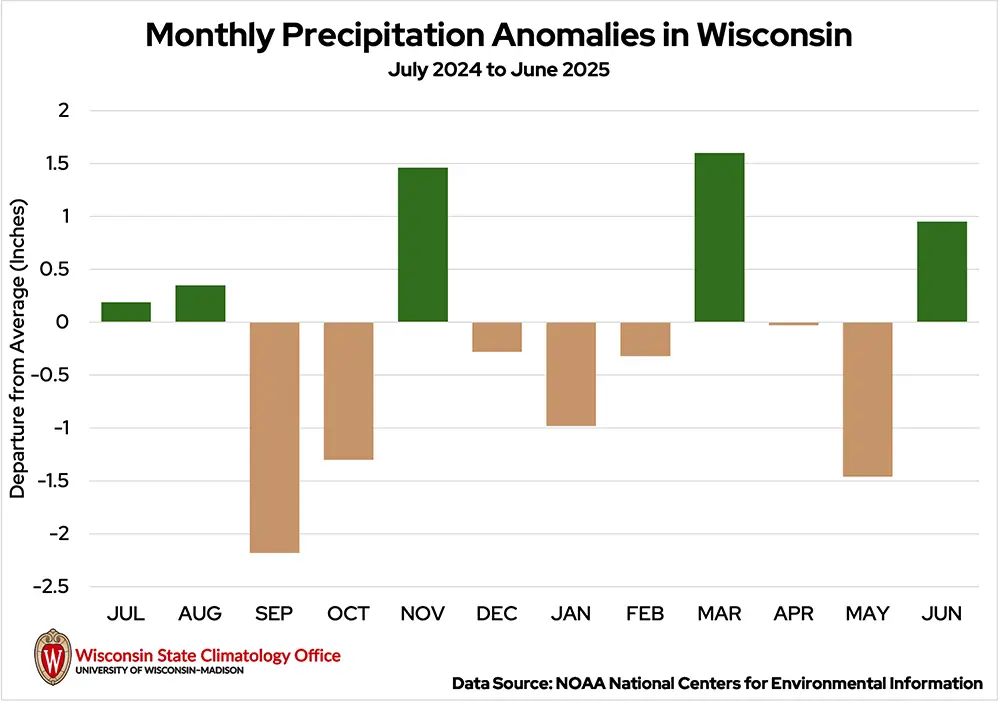
Some locations up north reported a surplus of four to five inches of rain — nearly 200 percent of what they would typically expect in June — while eastern locations near Green Bay and Milwaukee fell two to three inches short of June normals (Figure 3). The state averaged 5.65 inches of rain for the month, 0.95 inches wetter than normal (Figure 4).
La Crosse, Madison, Wausau, and Eau Claire saw measurable rainfall on at least half of the days in June. In many cases, when the rain came, it poured! This often led to flooding in yards, fields, across roadways, and along rivers and streambeds.
Waves of heavy rain moved through the north and central regions of the state during the first half of the month, dropping two to four inches of rain, which is more rain than those locations received during the entire month of May.
An active pattern between June 23 and 27 brought numerous lines of storms that dumped multiple inches of rainfall at a time. Numerous daily rainfall records were broken during those four days (Table 2).
June 2025 Rainfall Records
| Location | Date |
Rainfall |
Previous Record |
|---|---|---|---|
| Madison | June 23 | 2.48” | 2.25” in 1994 |
| La Crosse | June 23 | 2.25” | 1.94” in 2010 |
| La Crosse | June 24 | 1.97” | 0.76” in 1998 |
| Wausau | June 25 | 2.31” | 1.75” in 1998 |

The most widespread flooding came on June 23, when slow-moving thunderstorms dropped two to four inches of rain from La Crosse to Madison. Low-lying roadways were underwater in Madison, water seeped into basements in Grant County, and flooding was seen along the Lemonweir River in Tomah (Monroe County), where 5.5 inches of rain fell, setting a new daily record for that station. The weight of the water, combined with clogged drains, caused a partial roof collapse at a Madison Woodman’s Market (Image 1).
Relentless Rounds of Storms
Along with being the wettest, June is typically the most active severe weather month in Wisconsin. This year was even more active than usual: the National Weather Service issued 90 severe thunderstorm warnings in the state through the course of the month, 10 more than the 30-year average.
The final weeks of the month were particularly action-packed, with nearly back-to-back rounds of severe weather.
A line of severe thunderstorms moving through central and eastern Wisconsin on June 19 created a 70 mile per hour downburst that buckled garage doors and damaged trees in Sheboygan County.
On June 20, a derecho swept from Montana to Minnesota, turning deadly near Fargo, North Dakota. The remnants of that storm clipped northern Wisconsin in the early hours of June 21: in Bayfield County, 78 mile per hour winds were reported, and dozens of trees were snapped near Red Cliff. Vendors at Musky Fest in Hayward (Sawyer County) had piles of tents and goods to untangle, but the event was able to go on as planned.
Storms rushed across northeast Wisconsin on the afternoon of June 23, producing wind gusts from 50 to 60 miles per hour. The high winds turned over a semi truck in Stevens Point (Portage County) and flipped boats on Castle Rock Lake in Adams County (Image 2). Widespread tree damage was seen in Green Bay, and a young girl was tragically killed after a tree fell on her.

A second round of slow-moving storms trudged across southern Wisconsin that evening. Rainfall rates exceeded two inches per hour in many locations, leading to widespread flooding and power outages.
Another line of storms in western and central Wisconsin on June 25 produced the first and only tornadoes of the month (Table 3). Two brief tornadoes touched down in La Crosse County, causing some tree damage near Barre Mills and St. Joseph. There was some evidence of a third tornado touch down near Norwalk (Monroe County).
On June 26, a weak tornado damaged trees near Bloomingdale in Vernon County. There were no reports of structural damage or injuries from any of these storms. This brings the state’s tornado count for the year up to 26, which is three more than the annual average.
| Location | Enhanced Fujita (EF) Rating | Estimated Maximum Winds | Damage Reported |
|---|---|---|---|
| St. Joseph (La Crosse Co.) | EF0 | 80 mph | Some tree damage |
| Barre Mills (La Crosse Co.) | EF1 | 90 mph | Some tree damage |
| Norwalk (Monroe Co.) | EF0 | 75 mph | Minor tree damage |
| Bloomingdale (Vernon Co.) | EF0 | 80 mph | Some tree damage |
On June 29, a complex of storms bubbled up in central Wisconsin and moved toward the southeast. Heavy downpours and strong winds were reported, with an 82 mile per hour wind gust that flipped an airplane at the Timmerman airport in Milwaukee. Thankfully, no one was onboard the plane at the time.
Receding Drought
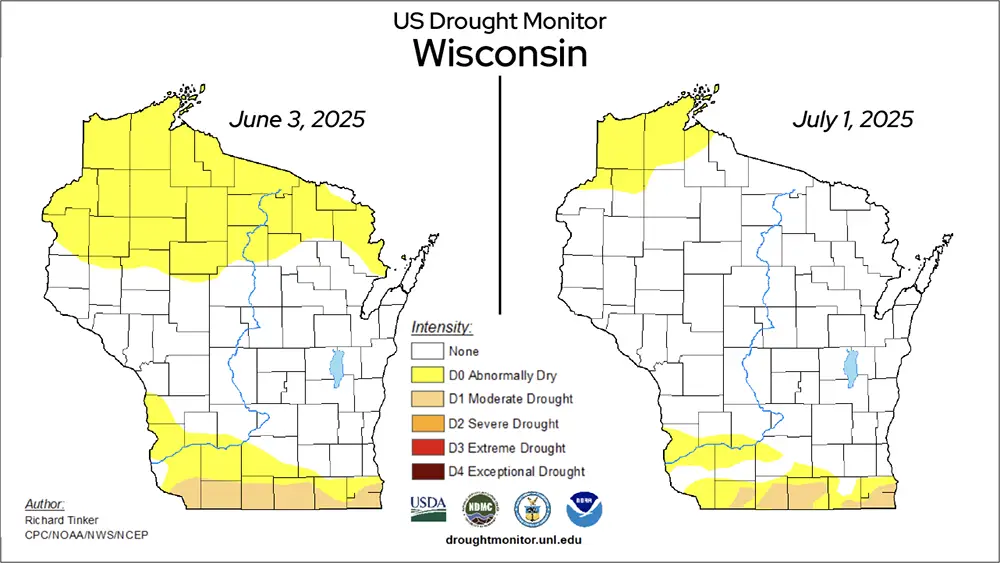
Following a drier-than-normal May, the surplus of rainfall in June was welcome in many parts of the state. At the start of the month, many locations in northern and far southern Wisconsin were experiencing abnormally dry conditions, with southern state line counties in moderate drought (D1).
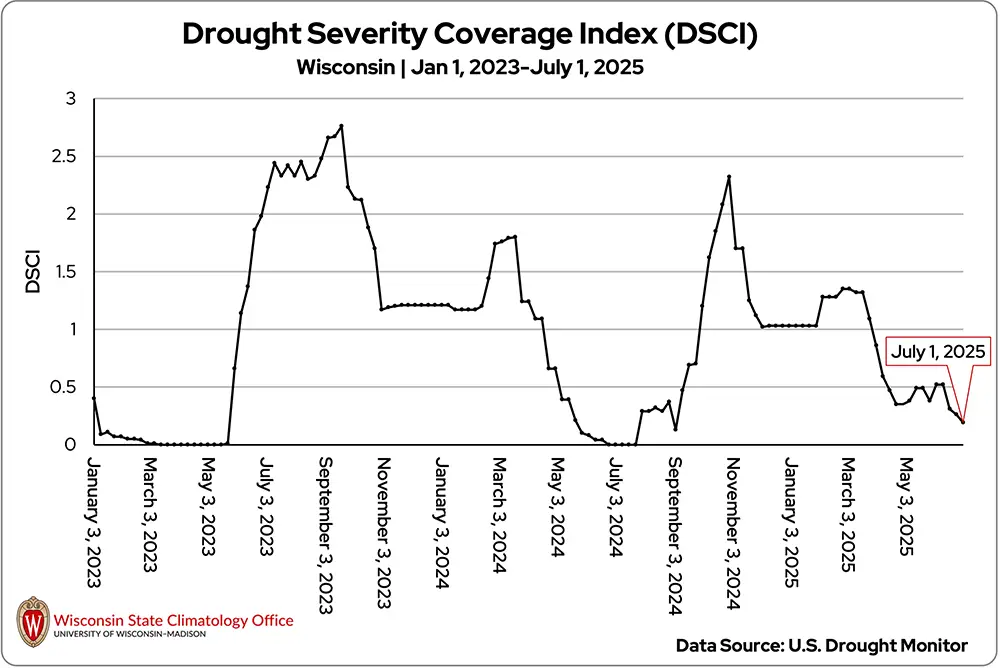
Little change had been seen during the first few weeks of the month, but improvements came in the back half. In northern Wisconsin, abnormal dryness receded to only the far northwest counties by July 1. Improvements were not as widespread in the south, where some pockets of moderate drought (D1) still lingered in portions of state line counties by the end of the month (Figure 5). This improvement is also reflected in the Drought Severity Coverage Index (DSCI), a measure of statewide-averaged drought intensity. On July 1, Wisconsin reported its lowest DSCI value since September 3, 2024 (Figure 6).
Smoke Settles Over Wisconsin
Wisconsin saw minimal wildfire activity during June, with just 52 fires burning a total of 18 acres statewide. Even during the hot and windy stretch late in the month, fewer than 10 fires were reported; elevated humidity levels likely helped suppress ignition and spread.
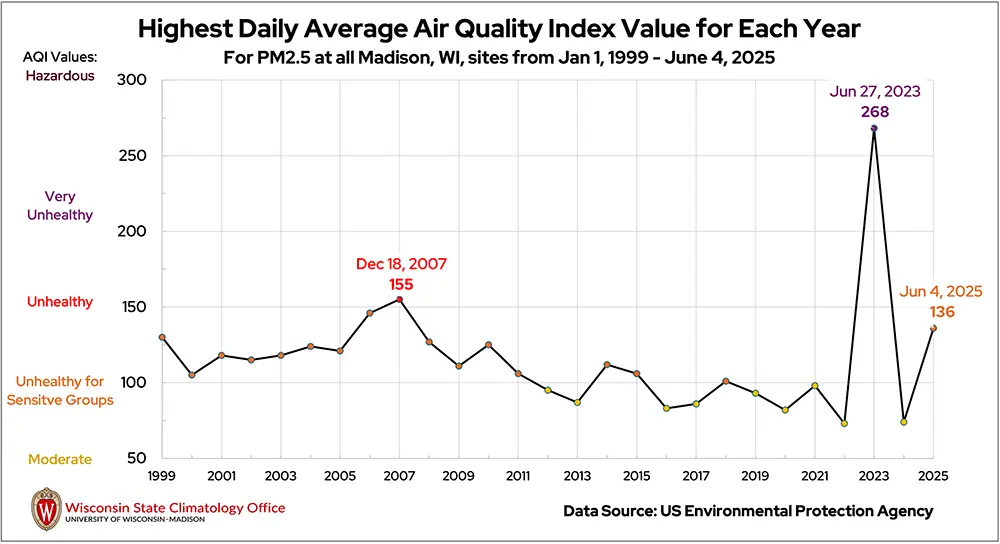
However, air quality told a different story. Smoke from Canadian wildfires lingered into early June, degrading air quality across Wisconsin. The worst of it arrived the morning of June 4, when Madison recorded a peak hourly air quality index (AQI) of 171 and a daily average AQI of 136 — the city’s worst air quality since the widespread event of late June 2023 (Figure 7). Eau Claire recorded some of the most severe conditions statewide during this event, with a daily average AQI of 159 on June 3 — the city’s third worst daily average AQI since records began in 2009, only behind the June 2023 event.
Navigating Haze, Heat, and Humidity in the Fields
June was a productive month for Wisconsin agriculture, with steady crop development. Early in the month, Canadian wildfire smoke raised concerns about crop impacts, but it’s unclear whether the smoke was intense enough to cause significant disruptions. Reduced solar radiation may have lowered temperatures and increased humidity, which could limit photosynthesis or slow hay drydown.
Cooler conditions early in the month slightly delayed growing degree day (GDD) accumulation in southern Wisconsin, while warmer conditions in the north kept development on pace. By month’s end, warmth and timely rain helped drive crop growth.
The mid-to-late-month heat wave, however, introduced challenges. The surge in heat boosted GDD accumulation, but also increased crop water demand, especially with the strong, persistent wind. High dew points provided some relief by limiting evaporative stress, but warm overnight temperatures may have elevated respiration rates in crops, consuming sugars that would otherwise support growth and grain production. The hot, humid days and nights posed risks to livestock, prompting producers to make adjustments such as shifting grazing windows, increasing access to water and shade, and closely monitoring for signs of heat stress.
Specialty crops, such as berries, were also impacted by the heat. While these crops typically benefit from warm conditions, extreme heat can accelerate ripening. One berry farm ended their season early, when normally, picking is good into early July. The intense heat also reduced turnout at ag-tourism farms, with some closing temporarily to protect the health of visitors and staff.
Heavy rains that followed caused some ponding and potential nutrient loss in fields. Heat and moisture also heightened pest and disease risk. Still, the rainfall was welcome as most of the state had been dealing with below-normal precipitation since early May.
For a closer look at how Wisconsin crops responded to the late-June weather, see our Wisconsin Climate Chronicles blog, “Crop Response to the Heat, Humidity, and Heavy Rainfall.”
Climate Corner
The late June heat may have felt intense, but it was nothing compared to what Wisconsinites have experienced in the past! See records of the hottest temperatures the state has ever felt, and dig into why some cities are more prone to 100-degree temperatures than others in our latest Climate Ed-ucation blog, “Sizzling Summer Heat in Wisconsin.”
Climate Stats by Division
June 2025 Temperature (Degrees Fahrenheit)
Color Key
-
Dark blue: Record coolest
-
Royal blue: Bottom ⅒
-
Light blue: Bottom ⅓
-
White: Normal
-
Light orange: Top ⅓
-
Orange: Top ⅒
-
Red: Record warmest
| Division | Avg | Dept |
|---|---|---|
| Northwest | 63.8: normal | 0.3: normal |
| North Central | 63.0: normal | 0.0: normal |
| Northeast | 64.2: top ⅓ | 0.9: top ⅓ |
| West Central | 67.8: top ⅓ | 1.2: top ⅓ |
| Central | 68.1: top ⅓ | 2.0: top ⅓ |
| East Central | 66.6: top ⅓ | 1.5: top ⅓ |
| Southwest | 70.3: top ⅓ | 2.6: top ⅓ |
| South Central | 70.6: top ⅒ | 2.9: top ⅒ |
| Southeast | 69.3: top ⅓ | 2.6: top ⅓ |
| State | 66.3: top ⅓ | 1.2: top ⅓ |
Heating Degree Days
Color Key
-
Dark blue: Record most
-
Royal blue: Top ⅒
-
Light blue: Top ⅓
-
White: Normal
-
Light orange: Bottom ⅓
-
Orange: Bottom ⅒
-
Red: Record fewest
| June 2025 | Since July 1, 2024 | |||
|---|---|---|---|---|
| Division | Avg | Dept | Avg | Dept |
| Northwest | 102: bottom ⅓ | -7: bottom ⅓ | 8,167: bottom ⅒ | -591: bottom ⅒ |
| North Central | 119: bottom ⅓ | -3: bottom ⅓ | 8,371: bottom ⅒ | -510: bottom ⅒ |
| Northeast | 97: bottom ⅓ | -18: bottom ⅓ | 8,011: bottom ⅒ | -536: bottom ⅒ |
| West Central | 51: bottom ⅓ | -18: bottom ⅓ | 7,347: bottom ⅒ | -566: bottom ⅒ |
| Central | 45: bottom ⅓ | -28: bottom ⅓ | 7,200: bottom ⅒ | -607: bottom ⅒ |
| East Central | 58: bottom ⅓ | -24: bottom ⅓ | 7,104: bottom ⅒ | -553: bottom ⅒ |
| Southwest | 26: bottom ⅓ | -27: bottom ⅓ | 6,825: bottom ⅒ | -484: bottom ⅒ |
| South Central | 22: bottom ⅒ | -29: bottom ⅒ | 6,621: bottom ⅒ | -568: bottom ⅒ |
| Southeast | 3: bottom ⅓2 | -32: bottom ⅓ | 6,648: bottom ⅒ | -417: bottom ⅒ |
| State | 47: bottom ⅓ | -25: bottom ⅓ | 7,024: bottom ⅒ | -509: bottom ⅒ |
Liquid-Equivalent Precipitation (Inches)
Color Key
-
Dark brown: Record driest
-
Light brown: Bottom ⅒
-
Beige: Bottom ⅓
-
White: Normal
-
Light green: Top ⅓
-
Green: Top ⅒
-
Dark green: Record wettest
| June 2025 | Since Nov. 1, 2024 | |||
|---|---|---|---|---|
| Division | Avg | Dept | Avg | Dept |
| Northwest | 5.84: top ⅓ | 1.47: top ⅓ | 17.81: normal | 0.15: normal |
| North Central | 6.61: top ⅓ | 2.11: top ⅓ | 21.42: top ⅓ | 2.77: top ⅓ |
| Northeast | 5.26: top ⅓ | 1.05: top ⅓ | 22.04: top ⅒ | 3.91: top ⅒ |
| West Central | 6.27: top ⅓ | 1.19: top ⅓ | 21.08: top ⅓ | 1.23: top ⅓ |
| Central | 5.59: top ⅓ | 0.82: top ⅓ | 22.51: top ⅒ | 2.73: top ⅒ |
| East Central | 4.04: normal | -0.28: normal | 19.90: top ⅓ | 0.50: top ⅓ |
| Southwest | 6.04: top ⅓ | 0.52: top ⅓ | 21.87: top ⅓ | -0.32: top ⅓ |
| South Central | 4.93: top ⅓ | -0.33: top ⅓ | 18.98: normal | -3.01: normal |
| Southeast | 4.07: normal | -0.53: normal | 18.60: normal | -3.02: normal |
| State | 5.65: top ⅓ | 0.95: top ⅓ | 20.49: top ⅓ | 0.98: top ⅓ |
Monthly, seasonal, and annual temperature and precipitation values and rankings published in this report are from NOAA’s National Centers for Environmental Information at the time of posting this climate summary. Values and rankings can change after publishing our climate summaries. To check the most recent values and rankings, visit NOAA’s National Centers for Environmental Information Climate at a Glance Tool.
This report is a product of the Wisconsin State Climatology Office. For questions and comments, please contact us by email (stclim@aos.wisc.edu ) or phone (608-263-2374).