The winter season was eager to arrive in Wisconsin this year, and managed to edge its way into the final month of meteorological fall.
Riding the Temperature Roller Coaster
November’s temperatures ran the full spectrum, soaring from the upper 40s to subfreezing and flipping between warmer than normal to cooler throughout the month (Figure 1).
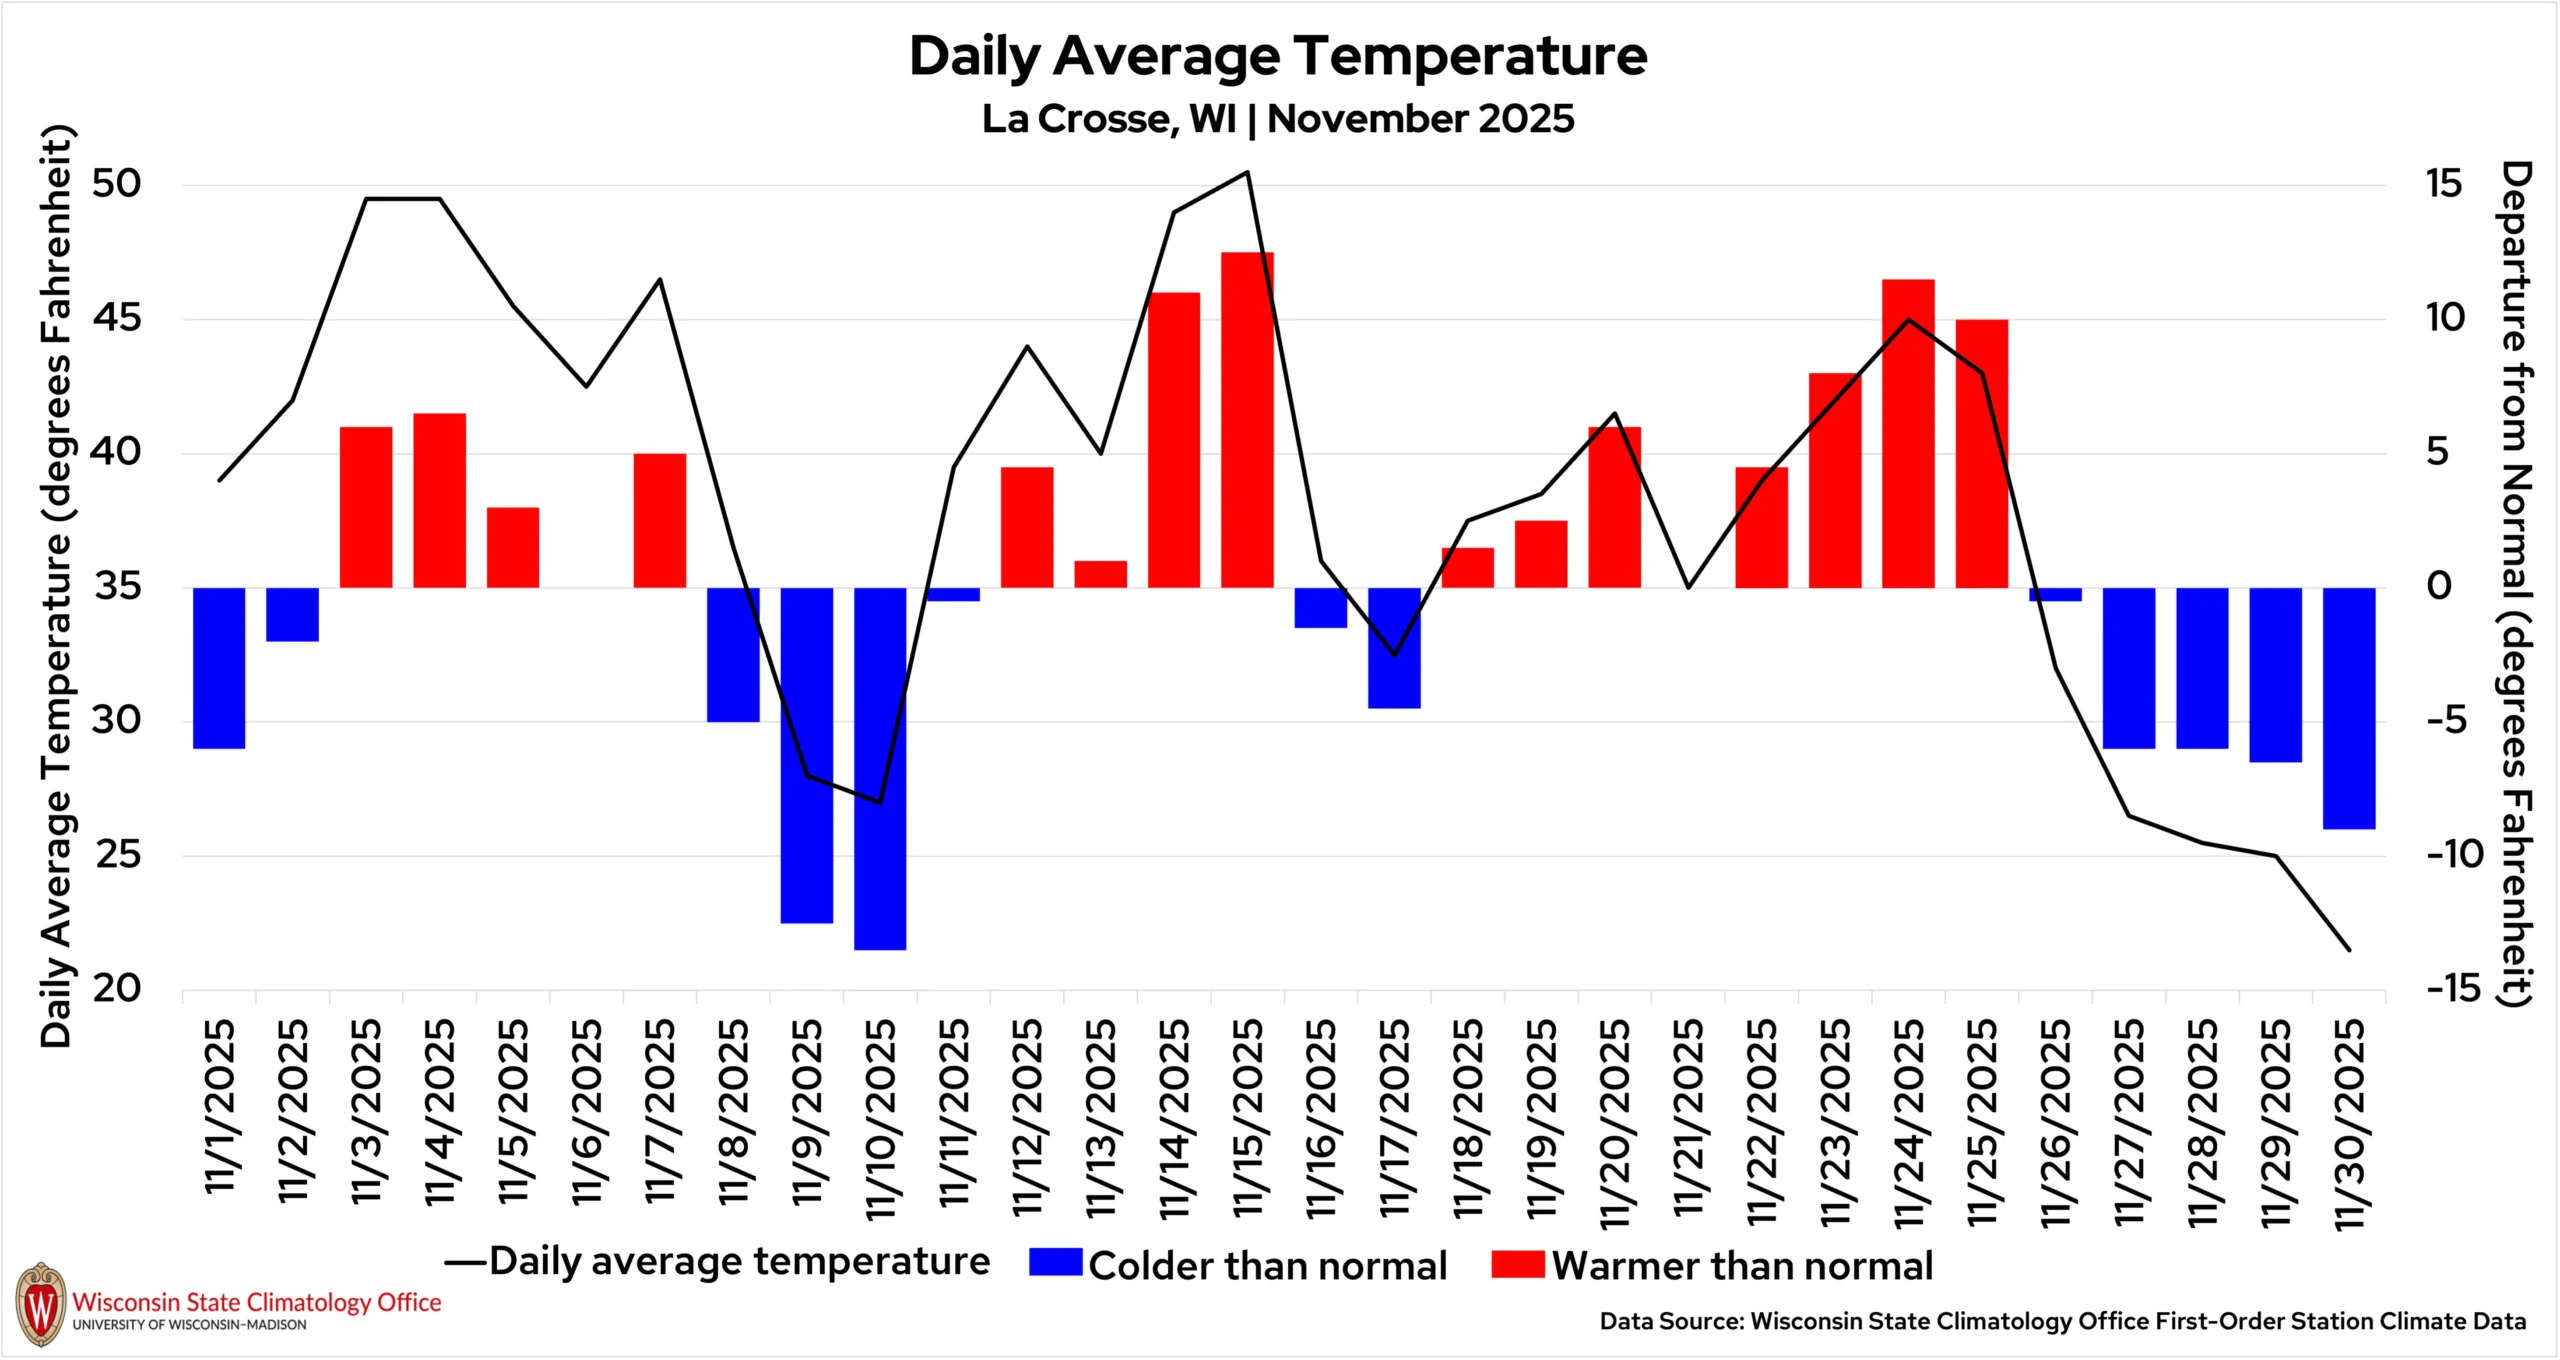
The month started with an early taste of winter when highs between November 8 and 10 matched what are normally early-November lows.
Just a few days later, a powerful warm front surged across the state, sending temperatures soaring on November 14 and 15.
Sixty-two stations set record highs on November 15 alone, with nearly a dozen stations across southeastern Wisconsin reaching 70 degrees or warmer, including a statewide November high of 71 degrees in Steuben (Crawford County) and Yorkville (Racine County).
Madison reached 68 degrees (tying its 1990 record) and Milwaukee hit 69 degrees (tying its 1990 and 1953 records) on November 15. Normally, their highs are in the mid-to-upper 40s.
A cold front quickly returned temperatures to more seasonal levels by November 16.
Warmth made another appearance on November 22 and 23, with western Wisconsin running 10 to 20 degrees above normal and 14 more stations setting record highs.
But winter reclaimed control during the final week of the month, when a strong cold front brought a drastic cooldown and the coldest temperature of both November and fall — three degrees below zero — recorded on November 30 in Lone Rock (Sauk County).
Only a few stations in eastern and southeastern Wisconsin managed to creep above freezing on the last day of fall.
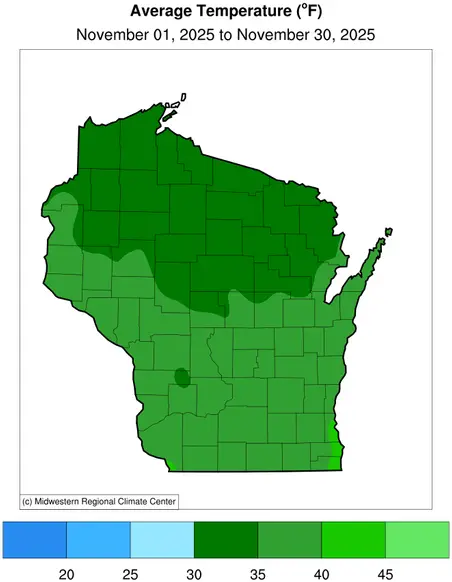
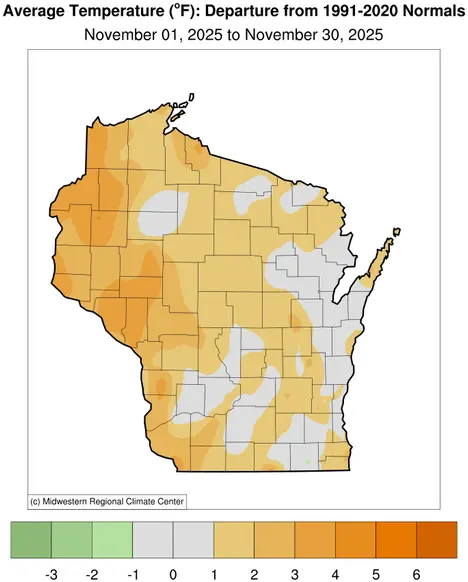
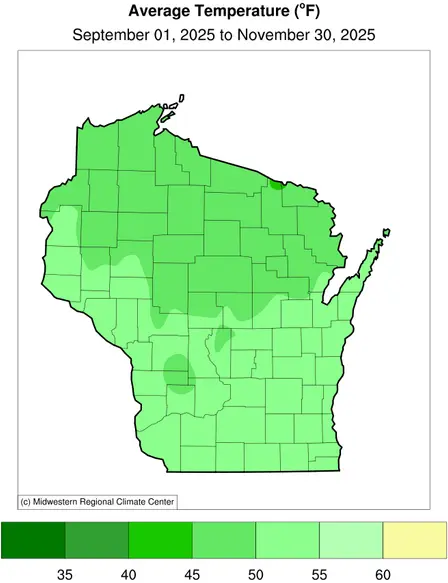
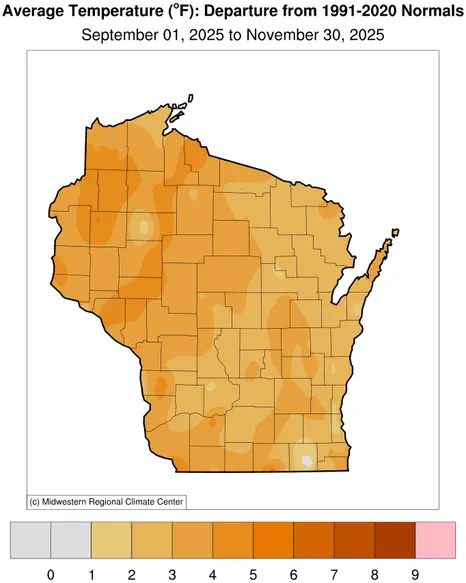
Despite the constant swings in temperatures, statewide average temperatures for the month were 35.3 degrees, 1.9 degrees warmer than normal, in keeping with the warm overall year to date (Figures 2 and 3).
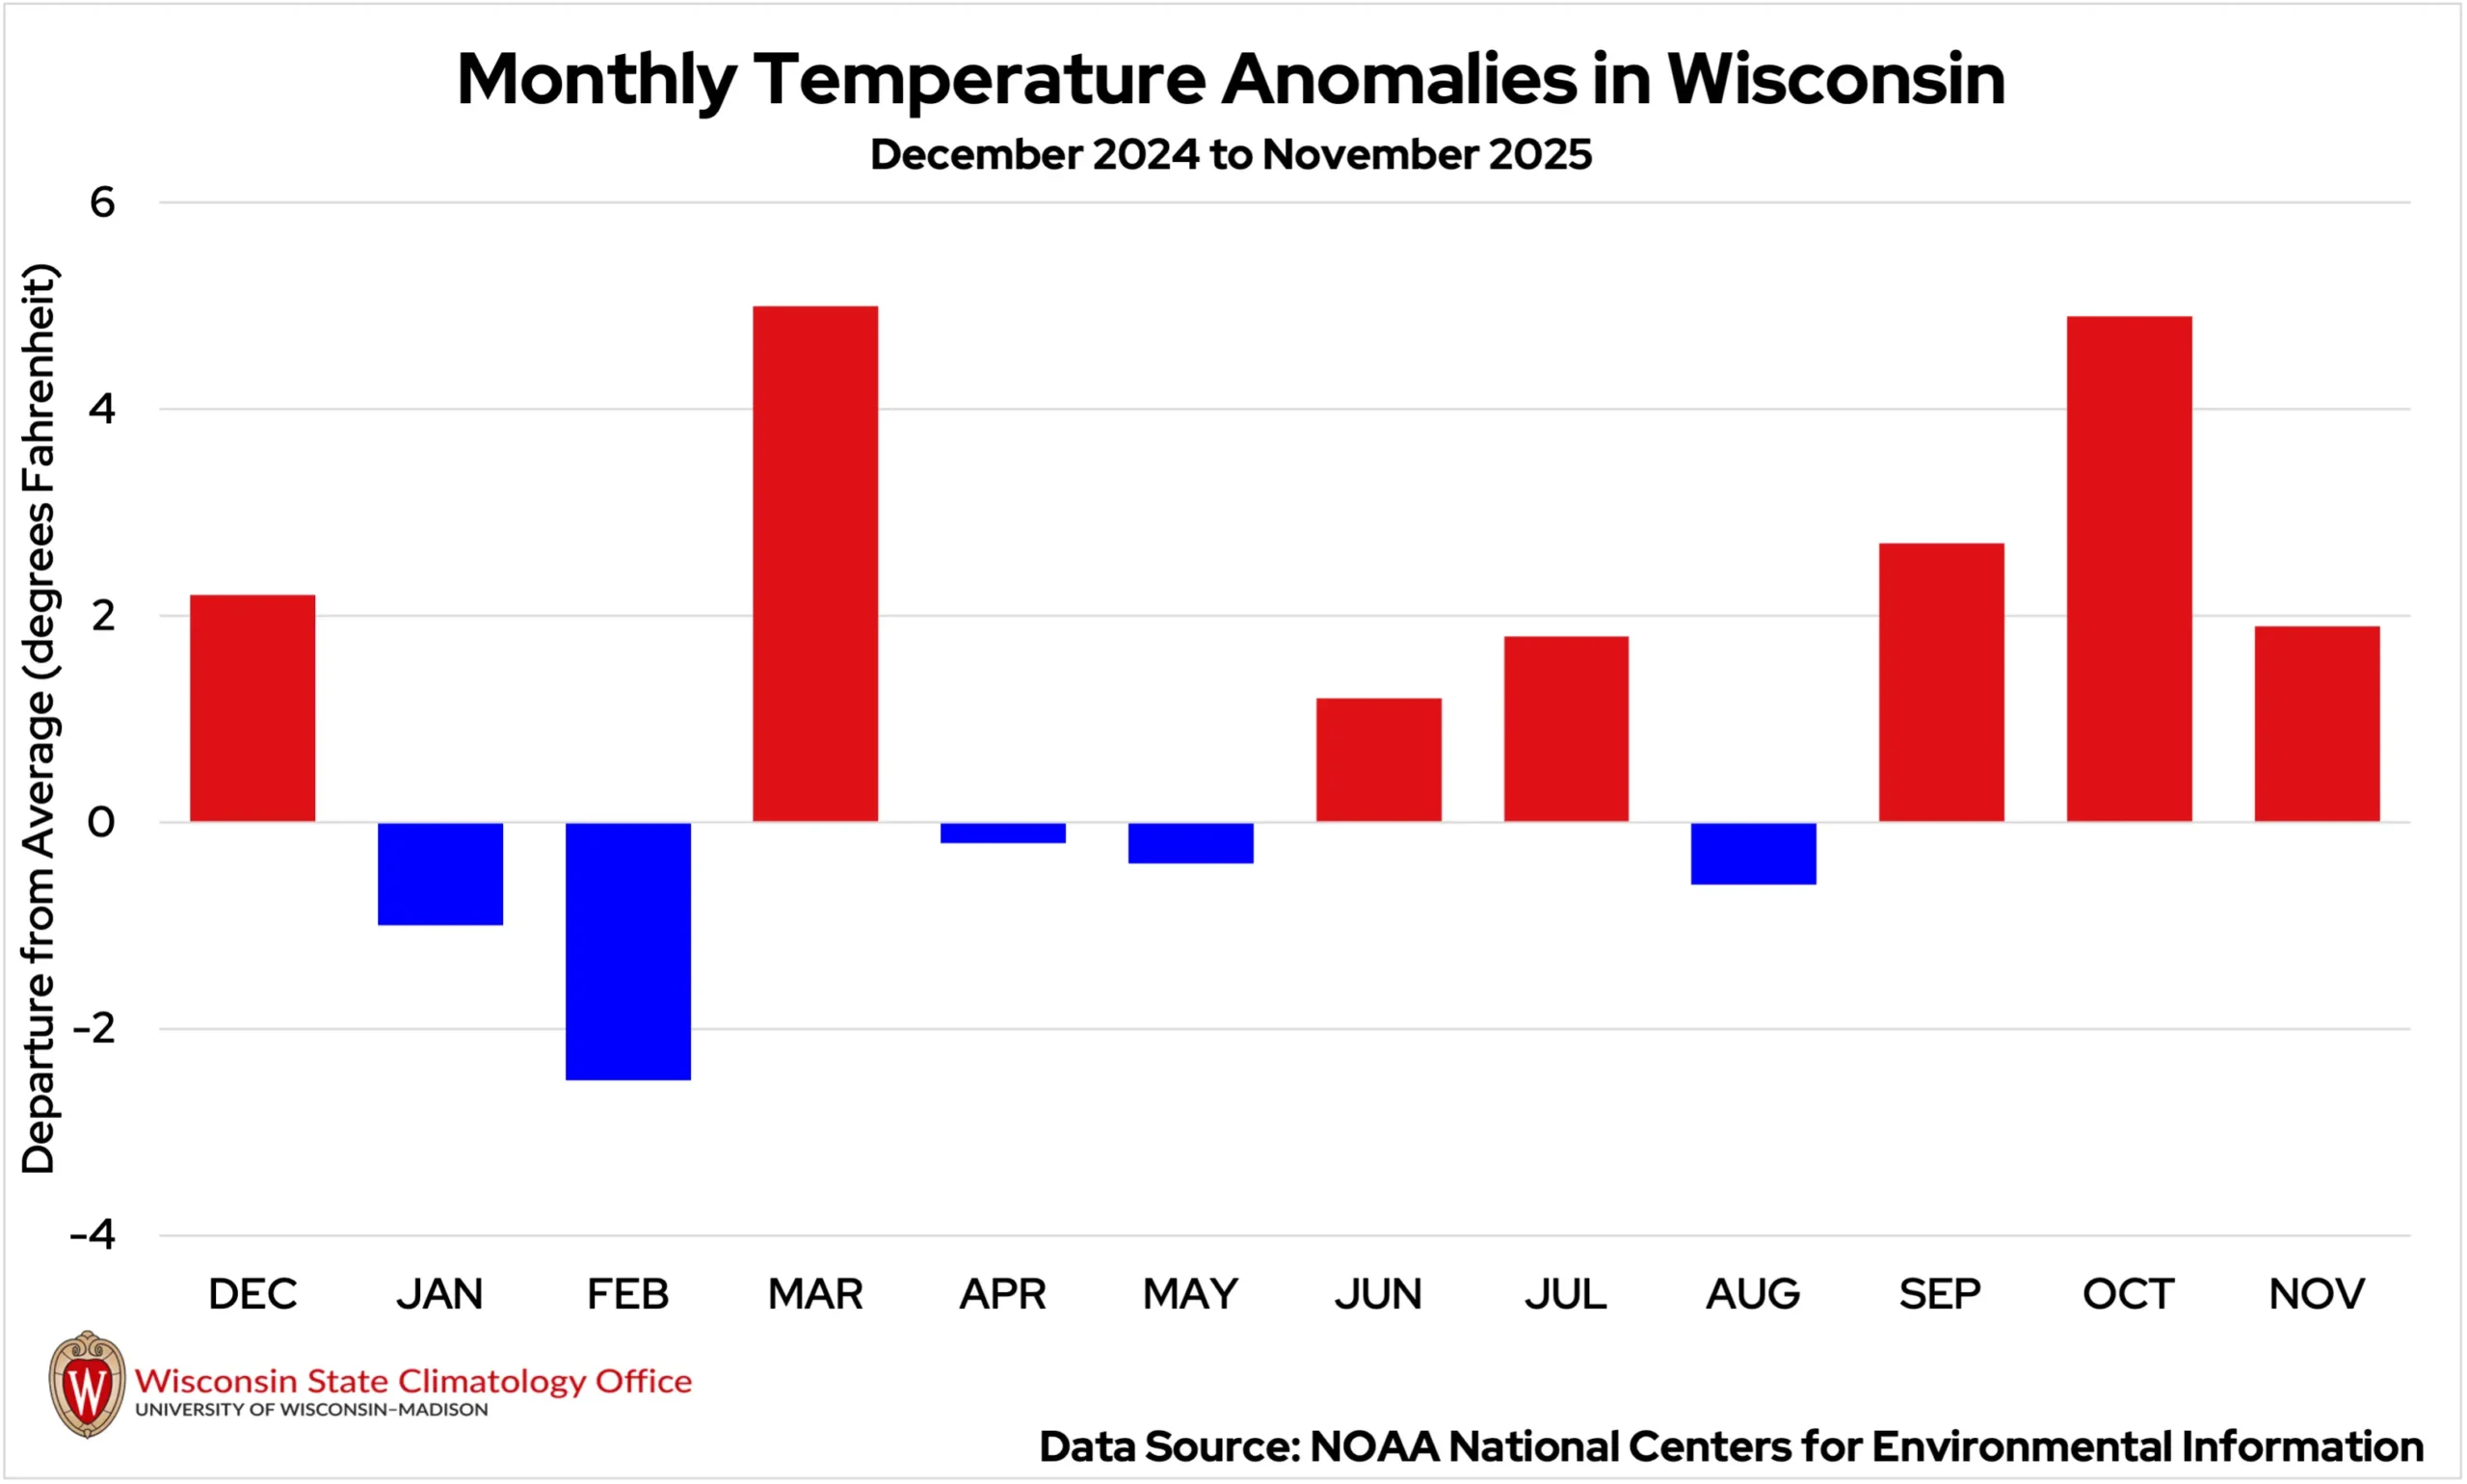
Fall as a whole was consistently warm, with all three months above normal. Adding to the warmth was the season’s hottest temperature — a whopping 91 degrees recorded on October 3 in Mondovi (Buffalo County). Statewide, fall averaged 49.8 degrees or 3.2 degrees above normal. Overall, this fall was the sixth warmest since 1895. (Figure 4).
Say It Isn’t Snow!
Continuing the pattern from recent months, November was a dry one. When precipitation did come, unseasonably cold temperatures provided the first snows of the season much earlier than usual.
Light snowfall in southern Wisconsin on November 8 amounted to Madison’s first inch of snow for the season. This seasonal milestone occurred over two weeks earlier than typical for the capital city.
On November 9 and 10, a low-pressure system shifted over Michigan. Northeasterly winds on the backside of the system blew across Lakes Michigan and Superior, producing potent bands of lake-effect snow from the moisture of the warm lake water.
Five to 10 inches of snow fell in the shoreline communities in Kenosha and Racine counties, while Milwaukee County reported no snow at all. Similar totals were reported in parts of Iron and Ashland counties along Lake Superior. Smaller snow bands brought totals of three to seven inches to parts of Door County.
The middle part of November was largely quiet and dry. By the last week of the month, it had been over 20 days since much of north central Wisconsin had received even a tenth of an inch of precipitation.
That quiet pattern changed right before the Thanksgiving holiday on November 27 as two major snowstorms set their sights on the Badger State.
From November 25 to 26, rain in northwestern Wisconsin transitioned to heavy snow that weighed down power lines and tree limbs. In far northern communities, lake-enhanced snow totals over 20 inches were seen (Figure 5). The highest reported total was 32.3 inches in Mercer (Iron County).
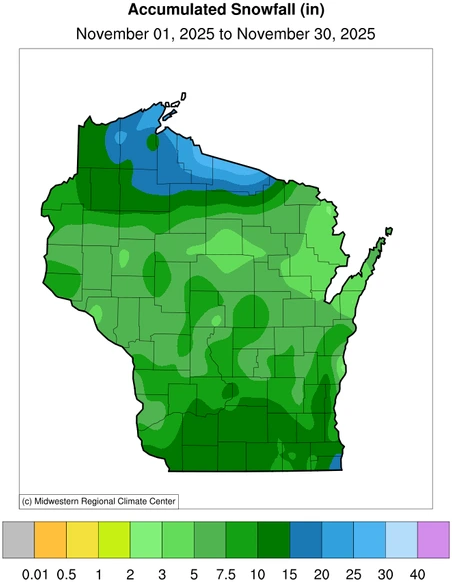
It was southern Wisconsin’s turn from November 29 to 30, as steady snowfall laid nine to 12 inches of snow across the region. The heaviest snow fell in counties bordering the Illinois stateline, where totals over 14 inches were reported.
Milwaukee Mitchell International Airport reported 6.1 inches of snow on November 29, surpassing the previous daily record of 3.3 inches from 1971.
Madison also set a new daily record on November 29, after Dane County Regional Airport measured 9.3 inches of snow. This also made it the city’s snowiest November day on record, breaking the previous record of 7.6 inches set on November 27, 1995.
Madison’s monthly snowfall total was 13.7 inches — the city’s third snowiest November on record! With a monthly total of 9 inches, Milwaukee saw its snowiest November since 1995.
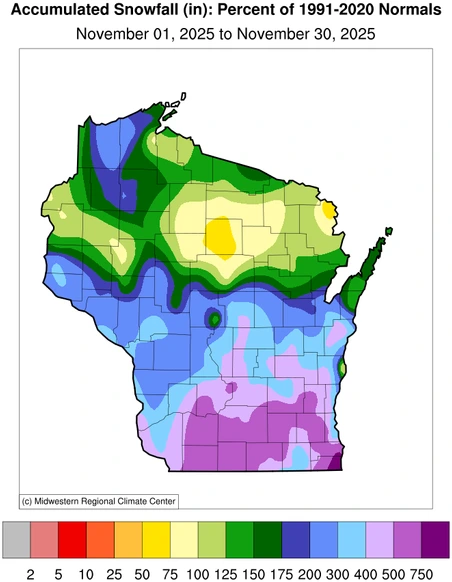
The southern and central counties saw over 400 percent of normal November snowfall, most of which came during the post-Thanksgiving storm (Figure 6).
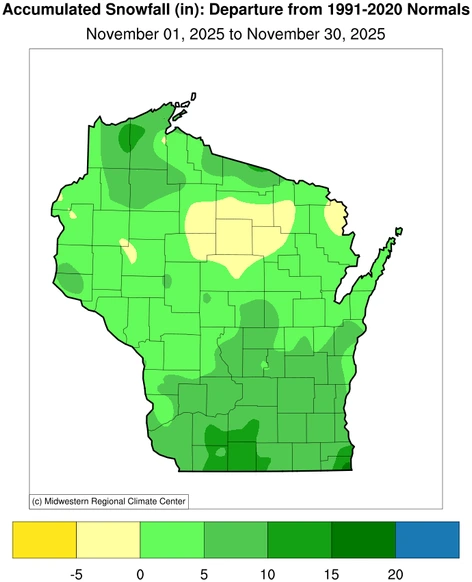
The statewide average snowfall for November was approximately 9.1 inches, estimated to be the 18th snowiest November since 1891.
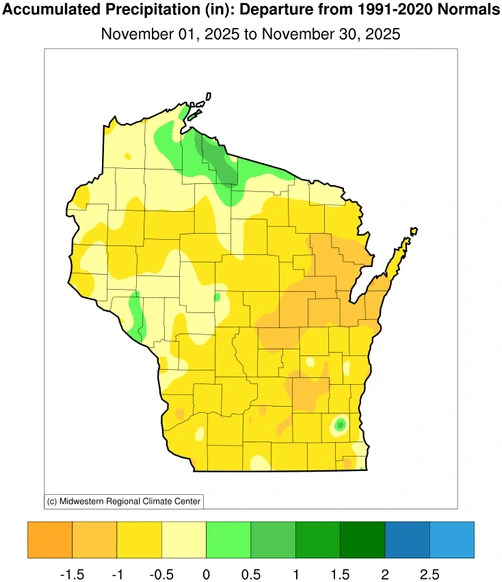
However, the late-month snow wasn’t enough to make up for the dry conditions from earlier in the month, and Wisconsin ended November with a statewide average precipitation total of 1.25 inches, which is 0.74 inches drier than average (Figure 7).

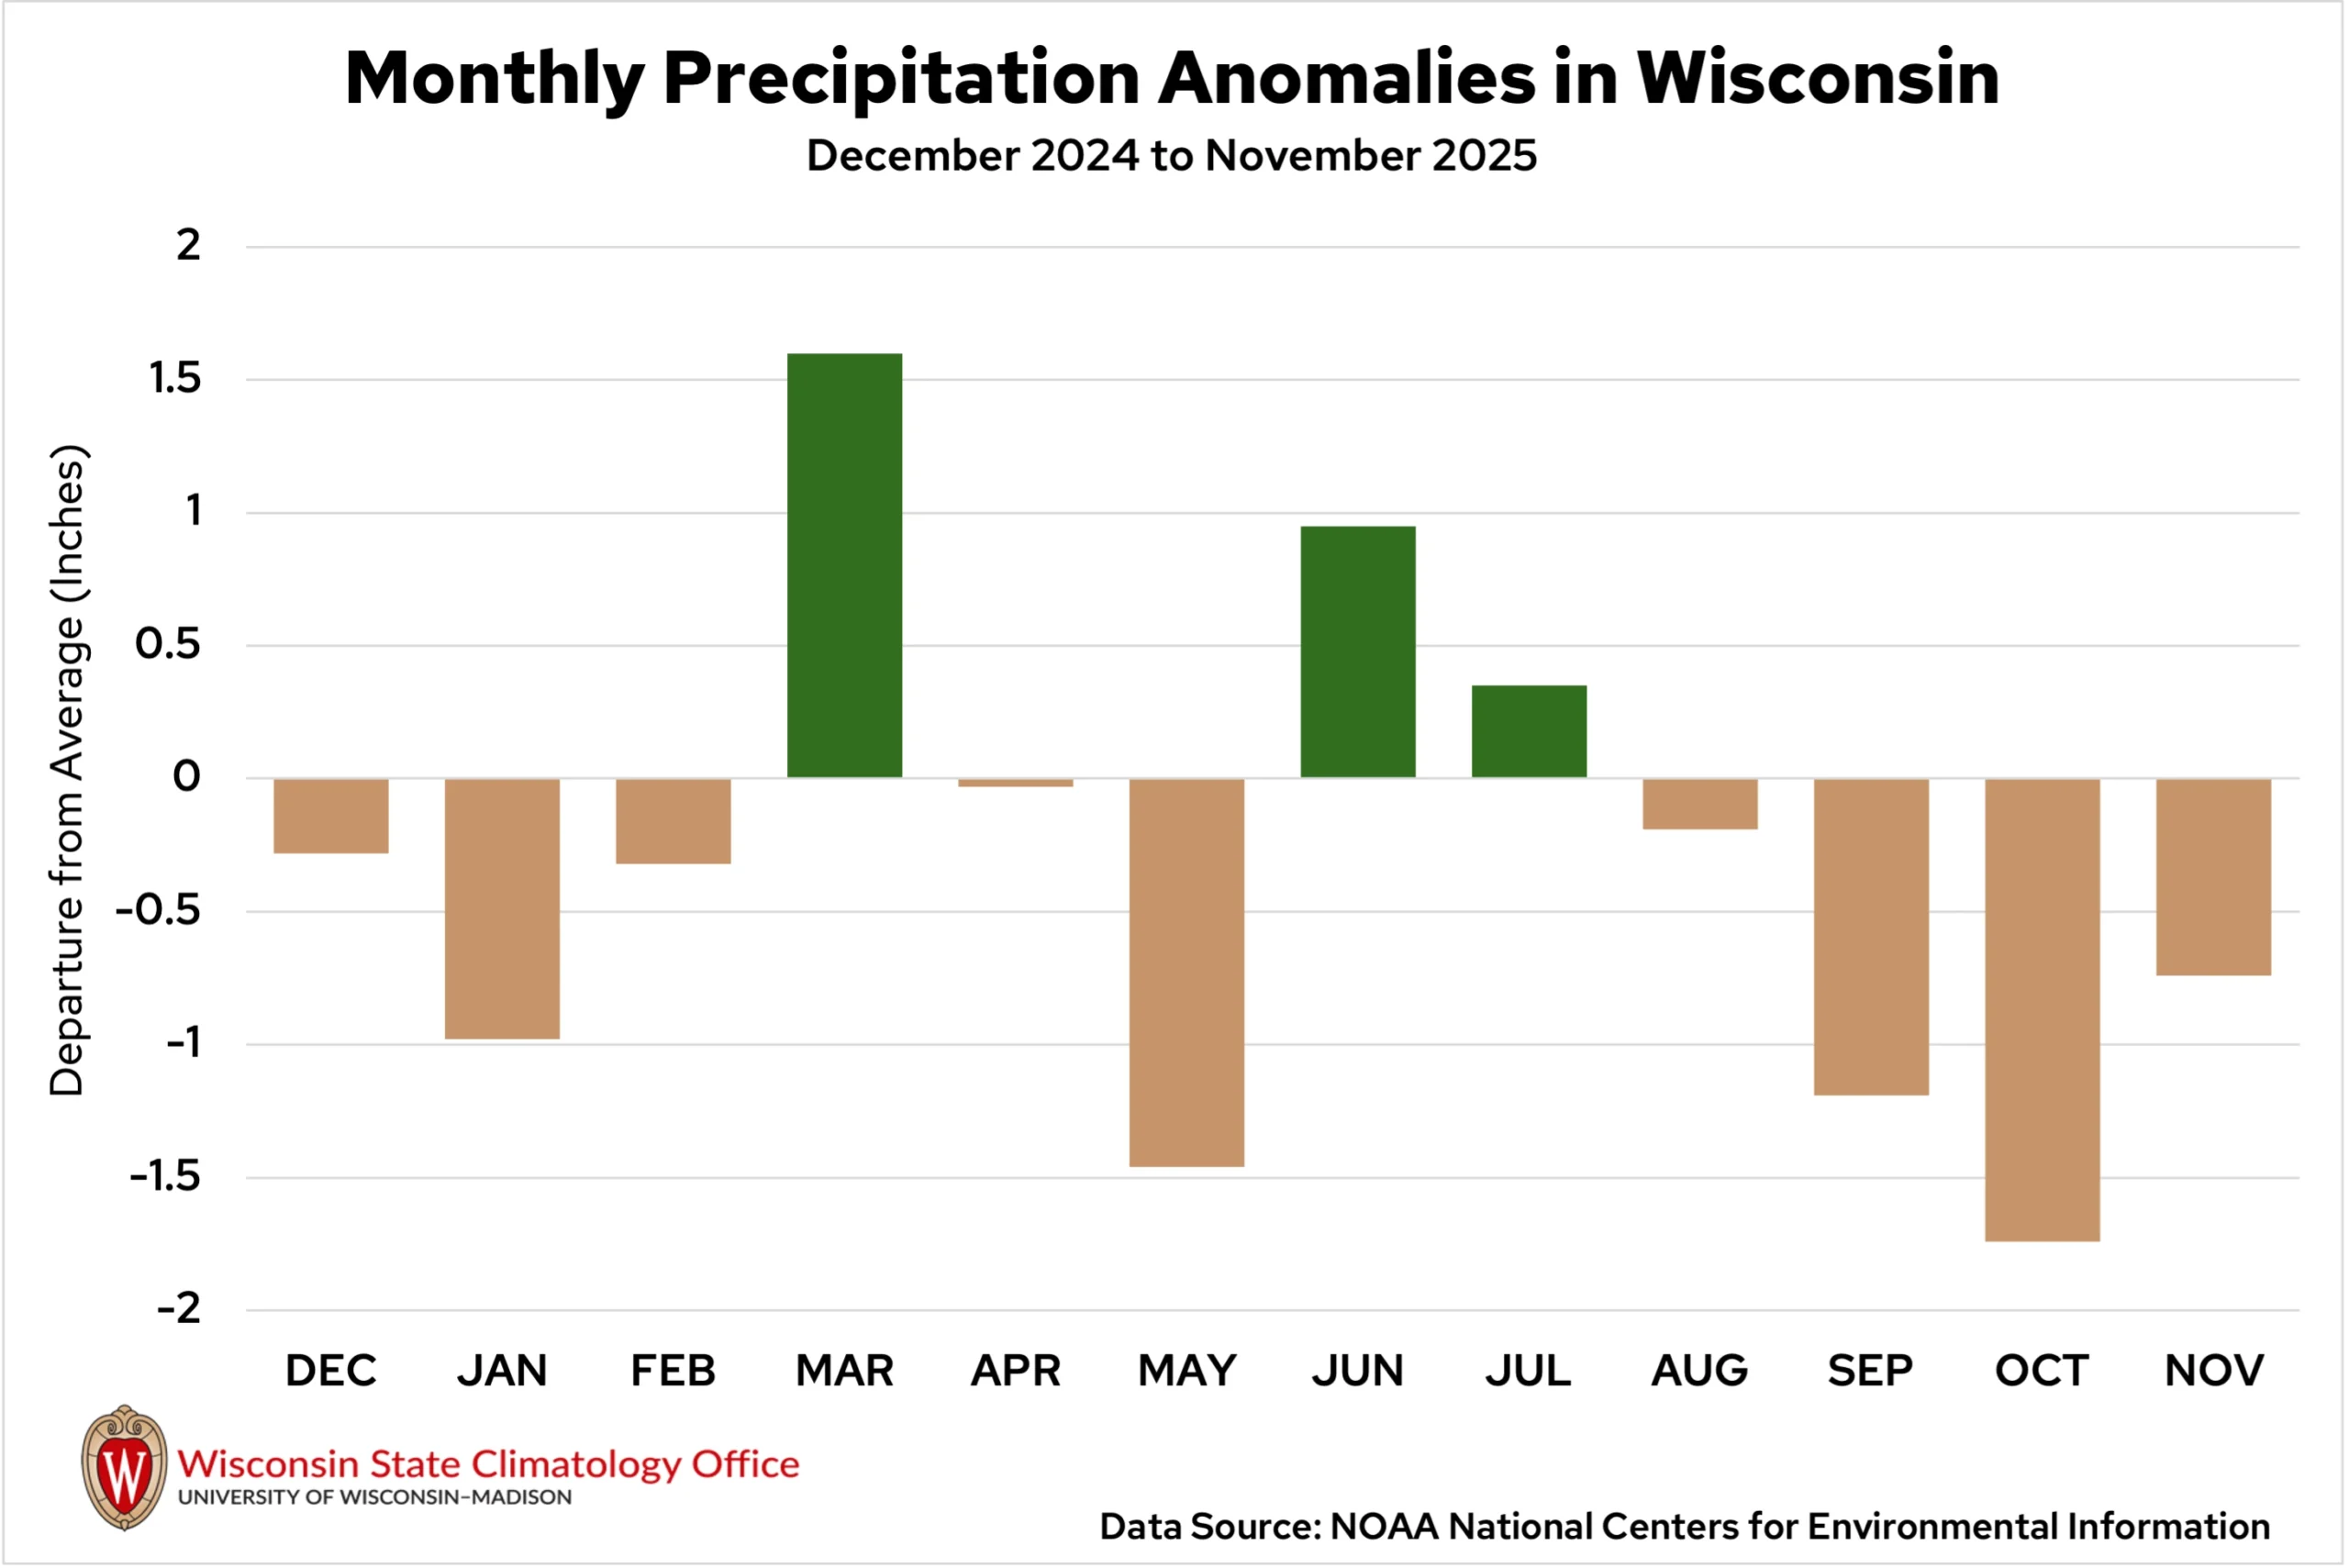
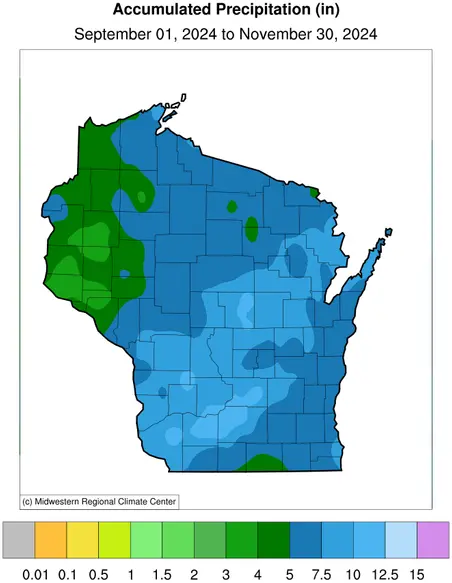
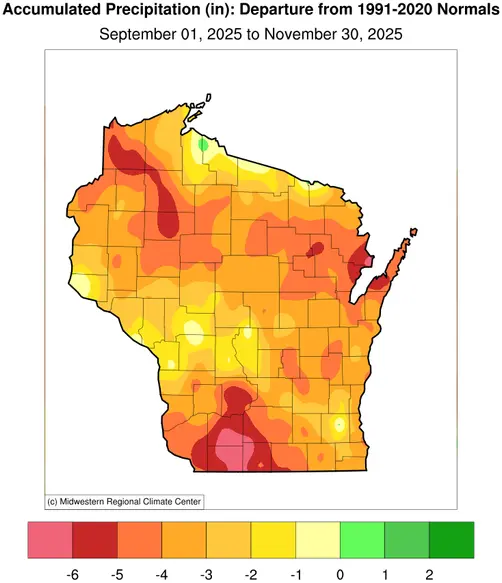
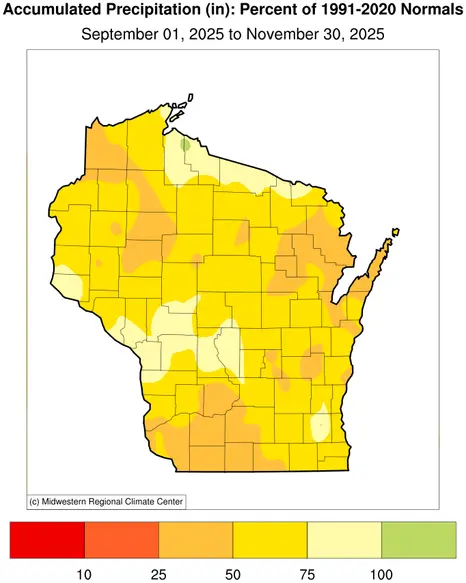
Wisconsin’s fall season was dry, with below normal precipitation statewide during all three months (Figures 8 and 9). Statewide average precipitation for the season was 4.94 inches, 3.65 inches drier than normal, making for the state’s seventh driest fall since 1895.
Severe weather activity was minimal during this fall, with no severe thunderstorm or tornado warnings issued in the state during October or November — only the fifth time that’s been true in the last two decades.
Dry, Drier, Driest
November was characterized by dry conditions, which caused drought to spread and intensify across Wisconsin. Though the growing season has come to an end, having moisture in the soil before frost sets in is crucial in setting up the next growing season for success.
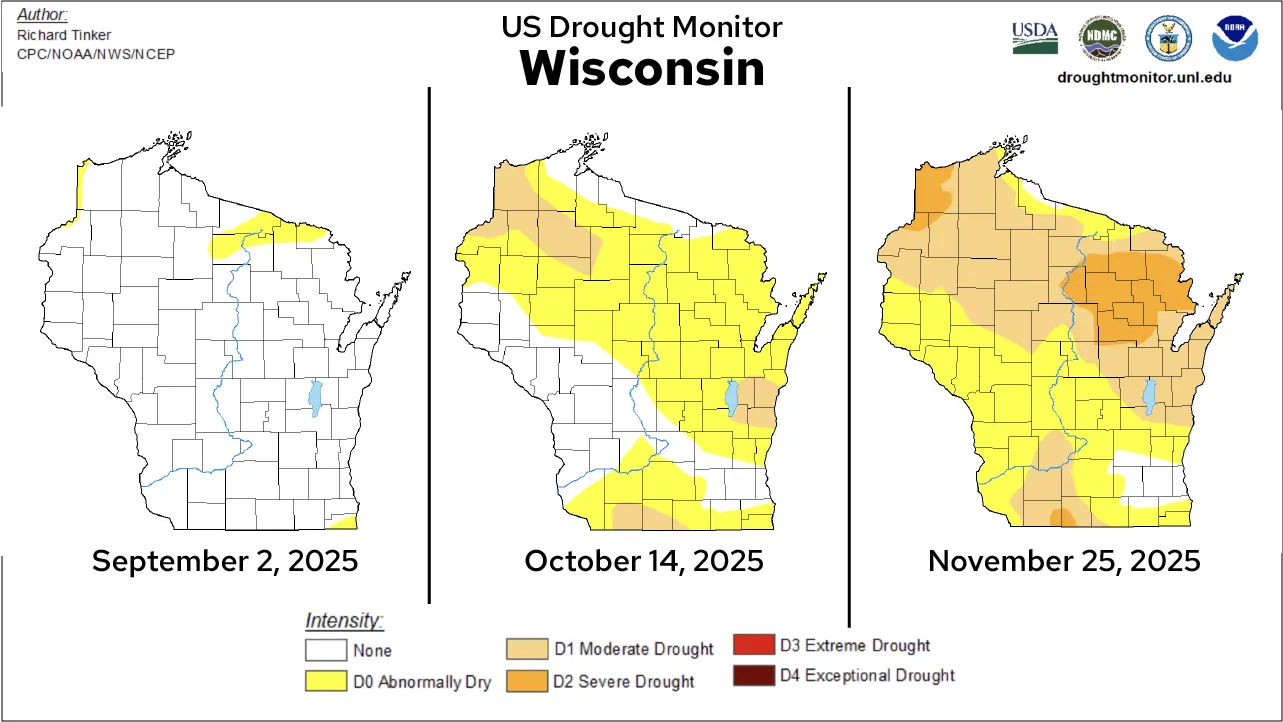
Dry periods in September and October caused abnormal dryness (D0) to spread across northern, eastern, and southern Wisconsin, with pockets of moderate drought (D1) emerging. By the end of the season, persistent dry weather allowed for severe drought conditions (D2) in parts of northwest, northeast, and far southern Wisconsin (Figure 10).
Due to the parched conditions, over 200 wildfires burned in the state during the fall season, many of which were sparked by machinery. Following the major flood event in August, Waukesha and Milwaukee are the only counties in the state still reporting normal soil moisture.
Recent fall seasons have been similarly dry in the Badger State. During both 2023 and 2024, nearly all of the state experienced abnormally dry conditions (D0) during the fall season but saw improvements by the end of November.
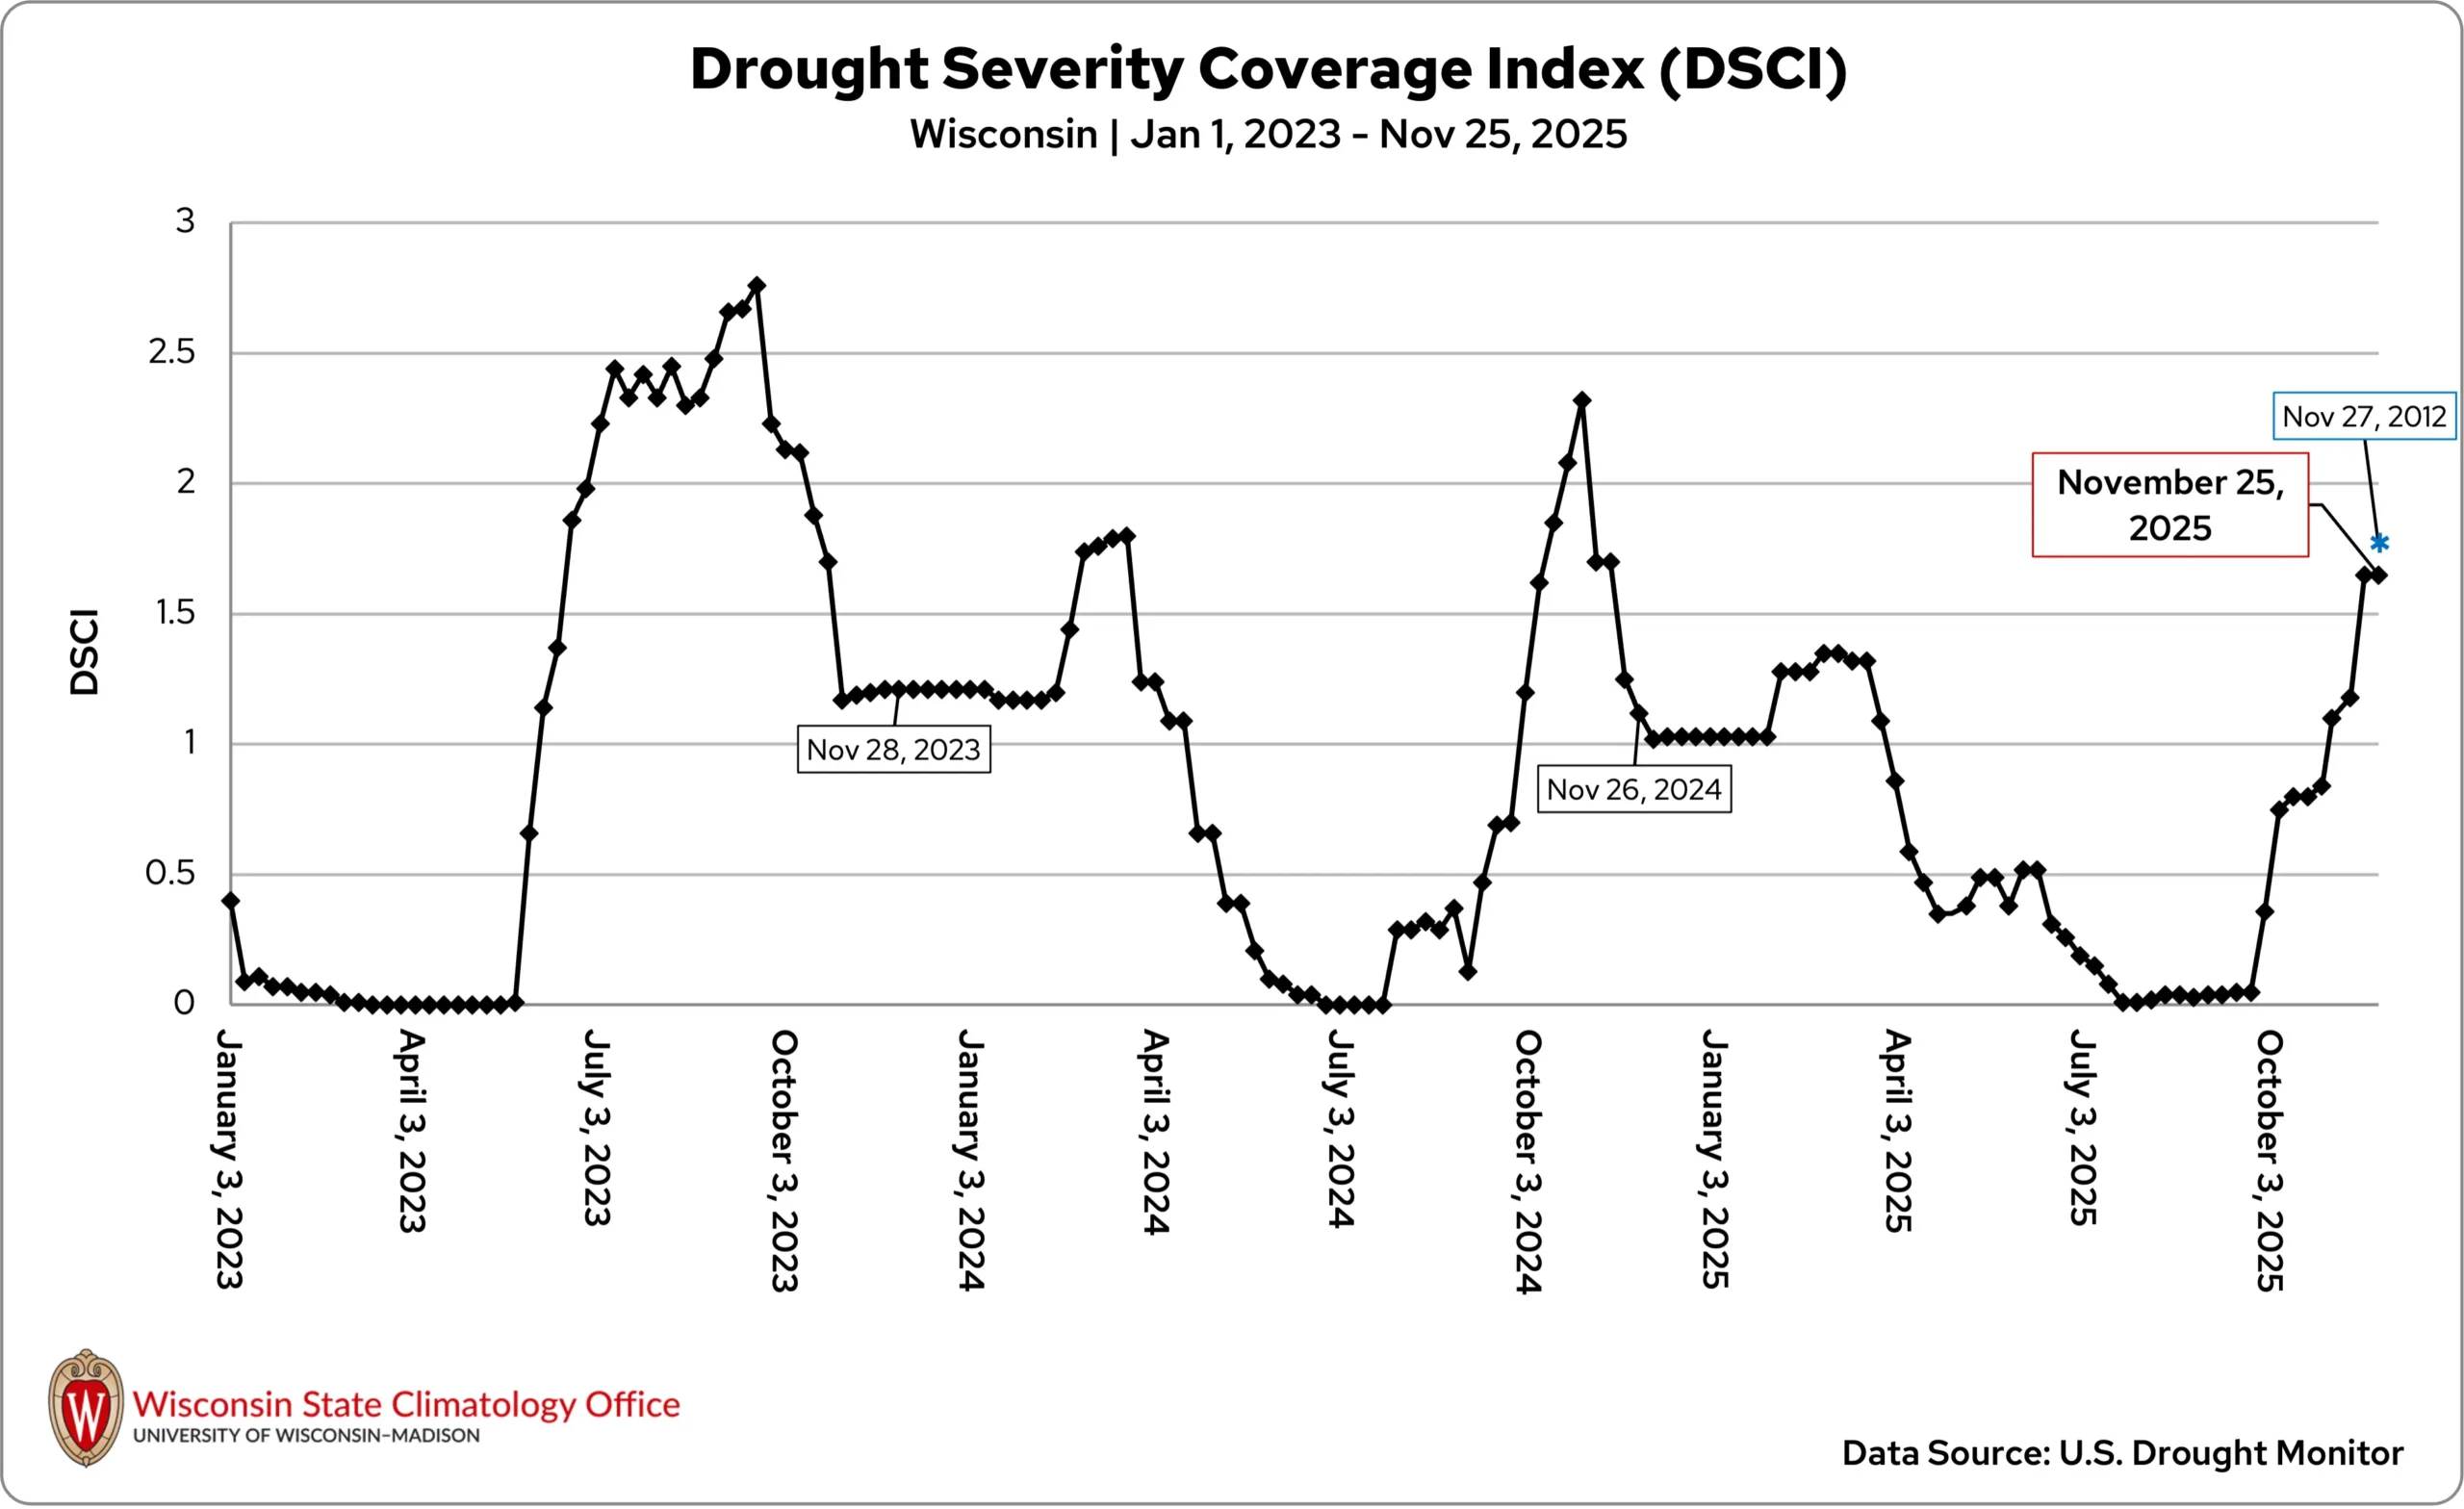
Not only did drought coverage expand across Wisconsin through the 2025 fall season, but the intensity of drought amplified as well. The combination of drought extent and intensity based on the Drought Severity Coverage Index (DSCI) peaked in late November and reached its highest level since last October (Figure 11). In fact, the state will be entering the winter season with the driest conditions since November 2012.
Soils Left Cold and Dry
November’s dry conditions and late-month chill had important implications for Wisconsin’s agricultural landscape. Before the late-November snow arrived, grass and topsoil began to turn crunchy under the deepening cold.
The top layer of soil began to freeze, with one to four inches of frost reported at a handful of locations by month’s end. Without the insulating snowpack, the frost could have extended even deeper.
Because temperatures stayed below freezing, almost none of the late-November snow melted — meaning very little moisture made it into the already-dry soil.
While dry soils are not an immediate winter concern, they could pose issues in spring, when overwintering and perennial crops, along with new seedlings, rely on moisture near the root zone.
Come spring, producers may need to consider limiting tillage or adjusting cover crop termination to help conserve any surface moisture that remains if conditions stay dry.
Looking ahead, a steady snow melt could help rebuild soil moisture. However, if the snow thaws and refreezes, surface ice can form and damage perennial crops like alfalfa.
Climate Corner
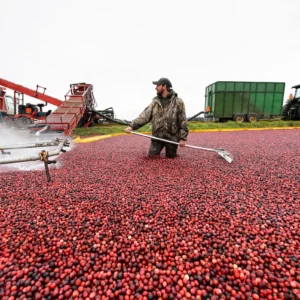
Cranberries are extremely popular items on the holiday menu: as fresh relishes, sauces, juice, frozen products, dried snacks, or incorporated in other dishes.
The popularity of the Wisconsin-native berry has made it the state’s largest fruit crop, and our chilly climate helps keep us as the nation’s top cranberry producer! Learn all about the berry’s history and how growers depend on Wisconsin’s weather in this month’s Climate Ed-ucation blog, From Bogs to Bushels: Why Wisconsin is the Cranberry Capital.
Climate Stats by Division
November 2025 Temperature (degrees Fahrenheit)
Color Key
-
Dark blue: Record coolest
-
Royal blue: Bottom ⅒
-
Light blue: Bottom ⅓
-
White: Normal
-
Light orange: Top ⅓
-
Orange: Top ⅒
-
Red: Record warmest
| Division | Avg | Dept |
|---|---|---|
| Northwest | 33.8Top ⅓ | 2.9Top ⅓ |
| North Central | 32.6:Top ⅓ | 1.7:Top ⅓ |
| Northeast | 33.3:Top ⅓ | 1.0:Top ⅓ |
| West Central | 36.3:Top ⅓ | 2.7:Top ⅓ |
| Central | 36.1:Top ⅓ | 1.7:Top ⅓ |
| East Central | 36.9:Top ⅓ | 1.2:Top ⅓ |
| Southwest | 37.9:Top ⅓ | 2.0:Top ⅓ |
| South Central | 38.1:Top ⅓ | 2.0:Top ⅓ |
| Southeast | 38.4:Top ⅓ | 0.9:Top ⅓ |
| State | 35.3:Top ⅓ | 1.9:Top ⅓ |
Snowfall (inches)
Color Key
-
Purple: Below Normal
-
White: Normal
-
Beige: Above Normal
| Division | Avg | Dept |
|---|---|---|
| Northwest | 12.4Above Normal | 4.9Above Normal |
| North Central | 9.3:Below Normal | -0.1:Below Normal |
| Northeast | 5.0: Normal | 0.0: Normal |
| West Central | 7.1:Above Normal | 3.4:Above Normal |
| Central | 7.2:Above Normal | 4.0:AboveNormal |
| East Central | 7.1:Above Normal | 4.7:Above Normal |
| Southwest | 9.0:Above Normal | 6.5:Above Normal |
| South Central | 10.6:Above Normal | 8.4:Above Normal |
| Southeast | 10.7:Above Normal | 8.9:Above Normal |
| State | 9.1:Above Normal | 4.0:Above Normal |
Liquid-Equivalent Precipitation (Inches)
Color Key
-
Dark brown: Record driest
-
Light brown: Bottom ⅒
-
Beige: Bottom ⅓
-
White: Normal
-
Light green: Top ⅓
-
Green: Top ⅒
-
Dark green: Record wettest
| November 2025 | ||
|---|---|---|
| Division | Avg | Dept |
| Northwest | 1.32: Normal | -0.51: Normal |
| North Central | 1.42: Normal | -0.54: Normal |
| Northeast | 1.11: Bottom ⅓ | -0.87: Bottom ⅓ |
| West Central | 1.24: Normal | -0.60: Normal |
| Central | 1.14: Bottom ⅓ | -0.78: Bottom ⅓ |
| East Central | 0.93: Bottom ⅓ | -1.16: Bottom ⅓ |
| Southwest | 1.28: Bottom ⅓ | -0.91: Bottom ⅓ |
| South Central | 1.19:Bottom ⅓ | -1.05:Bottom ⅓ |
| Southeast | 1.47: Bottom ⅓ | -0.75:Bottom ⅓ |
| State | 1.25:Bottom ⅓ | -0.74Bottom ⅓ |
Monthly, seasonal, and annual temperature and precipitation values and rankings published in this report are from NOAA’s National Centers for Environmental Information at the time of posting this climate summary. Values and rankings can change after publishing our climate summaries. To check the most recent values and rankings, visit NOAA’s National Centers for Environmental Information Climate at a Glance Tool.
This report is a product of the Wisconsin State Climatology Office. For questions and comments, please contact us by email (stclim@aos.wisc.edu) or phone (608-263-2374).