The Extreme Weather Index (EWI) is a metric created by the Wisconsin State Climatology Office to quantify extreme weather variations and trends.
The EWI represents a combined measure of extreme weather by equally weighting temperature and precipitation anomalies on timescales of a month to a year compared with their historical rankings. The index can range from as low as zero (when both temperature and precipitation equal their long-term averages) to as high as 100 (when both temperature and precipitation are record-breaking).
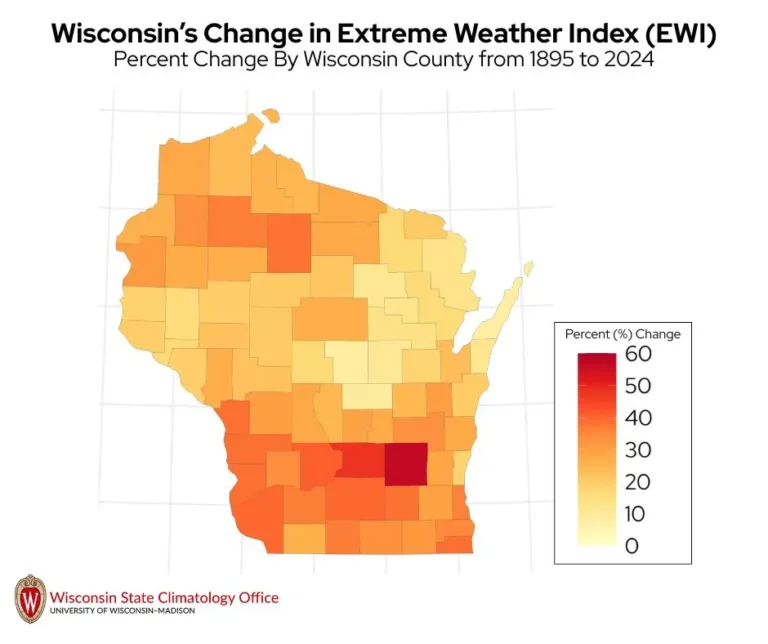
Wisconsin’s EWI, based on annually averaged temperature and precipitation statewide, shows a long-term upward trend of about 28 percent since data became available in 1895. The state’s highest EWI occurred during the 2010s, reflecting the Badger state’s wettest and second-warmest decade on record.
Winter is the season that has contributed the most to the annual EWI trend, due to increasingly warm and wet conditions during December to February.

The EWI has risen throughout the state by an amount that varies substantially by location. The largest increase has occurred in southern Wisconsin, particularly the south-central region (46 percent). Dodge County has experienced the most pronounced trend of more than 50 percent, followed by adjacent Columbia County.

Wisconsin’s EWI has increased the most of any Midwestern state and is among the highest nationally. Only South Carolina, New York, Virginia, Georgia, and Tennessee have seen larger increases in extreme weather.