University of Wisconsin–Madison
UW Crest
Wisconsin State Climatology Office
University of Wisconsin-Madison
  • Mesonet
  • Data and Products Expand Collapse
    • Recent Wisconsin Climate
    • Historic Climate Data
    • Wisconsin Seasons
    • Climate Divisions
    • First-Order Stations
  • Research
  • About
  • Partners Expand Collapse
    • American Association of State Climatologists
    • Center for Climatic Research
    • Wisconsin Initiative on Climate Change Impacts
  • Contact Us
  • Division of Extension
  • Atmospheric and Oceanic Sciences
  • Nelson Institute
  1. Wisconsin State Climatology Office
  2. Wisconsin Seasons
  3. Fall

Fall

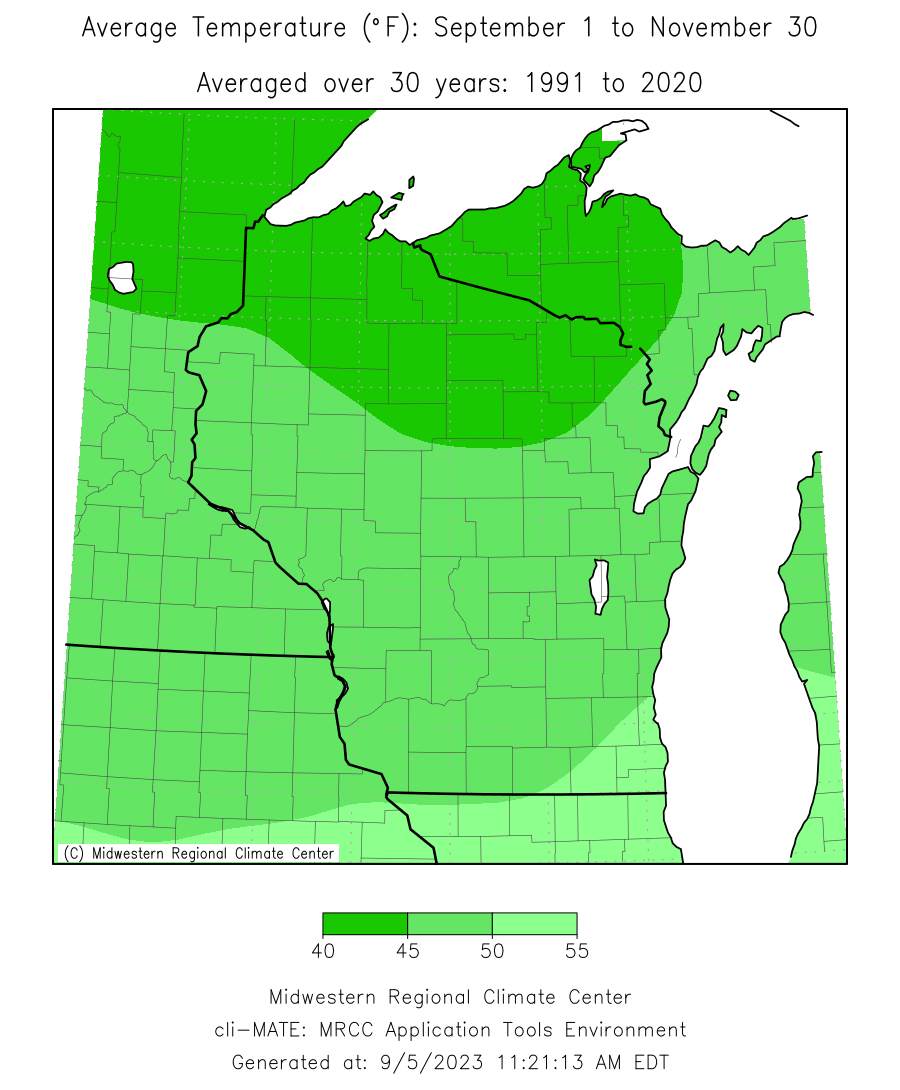
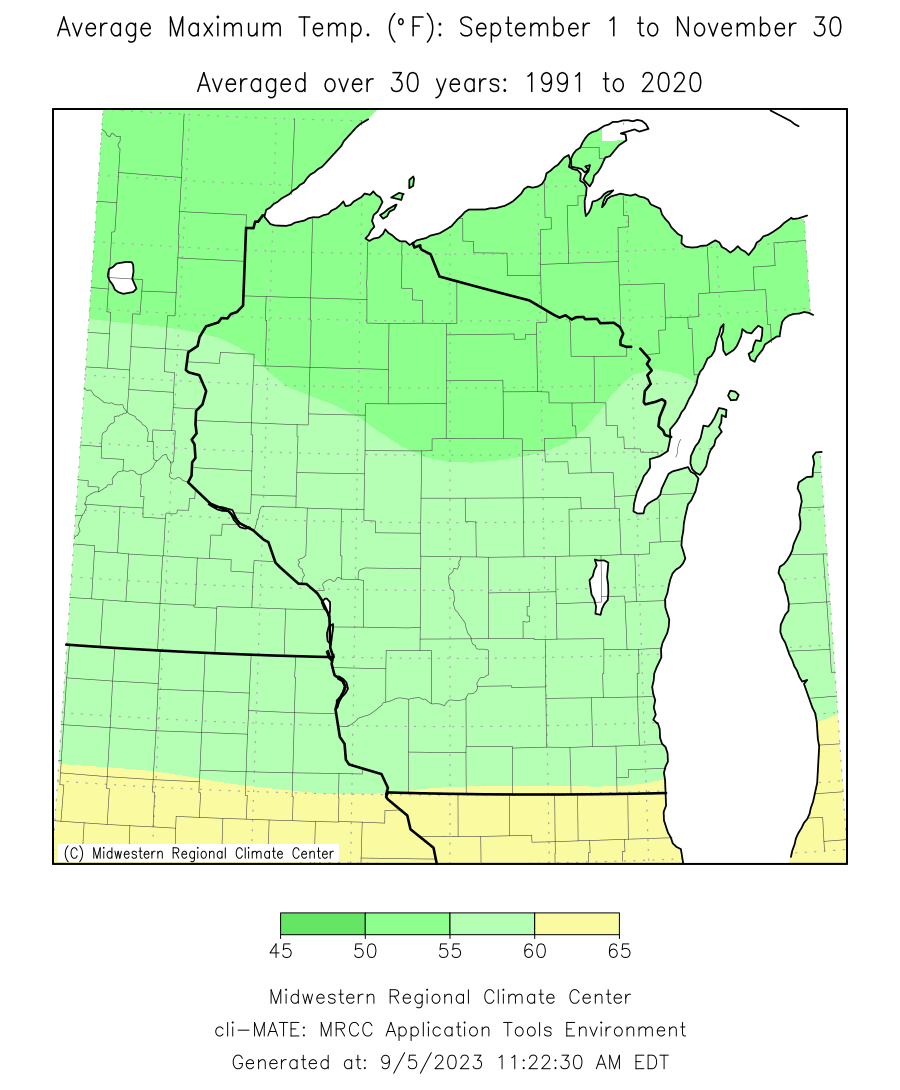
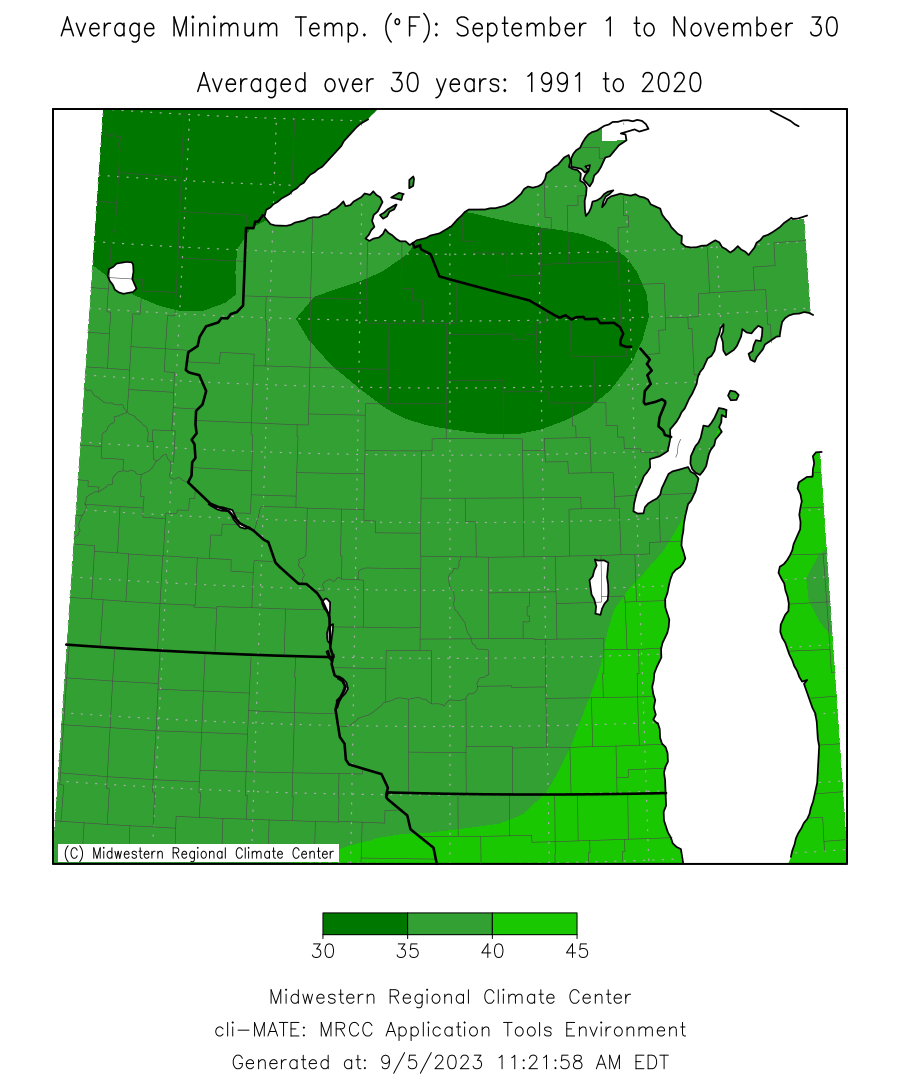
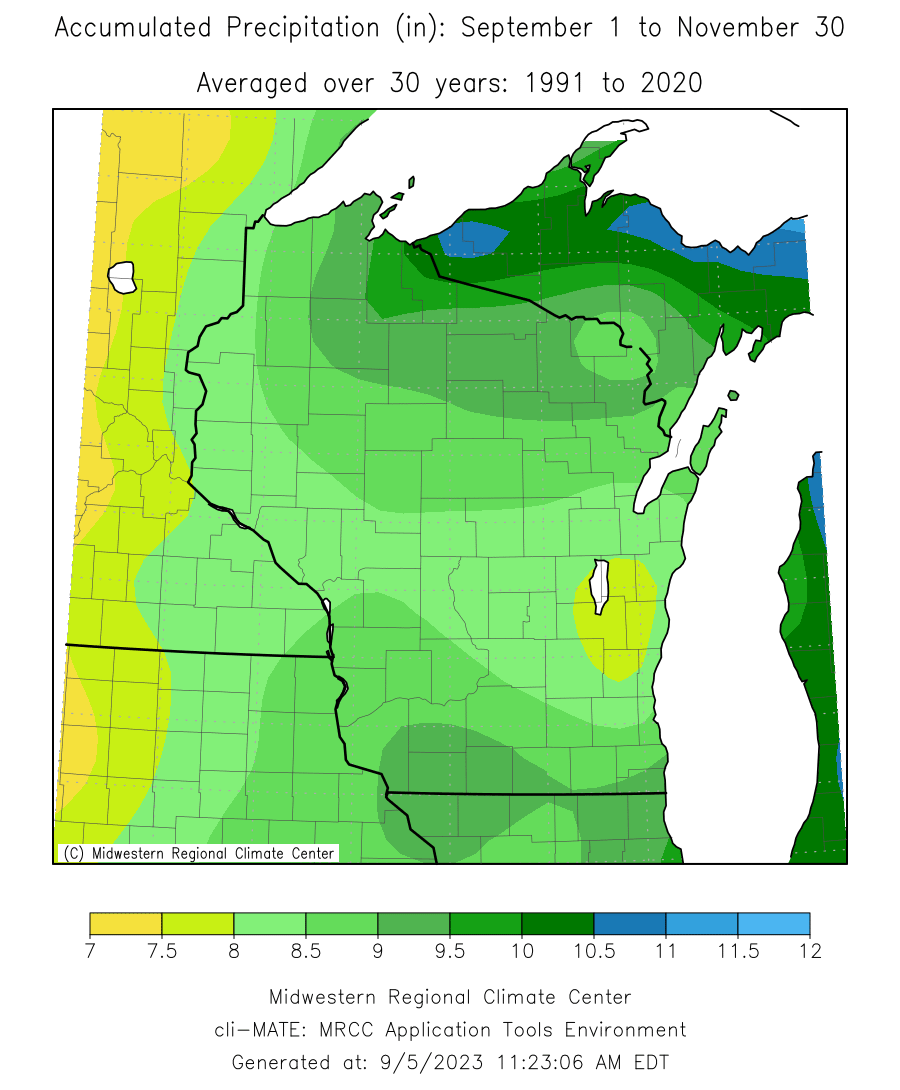
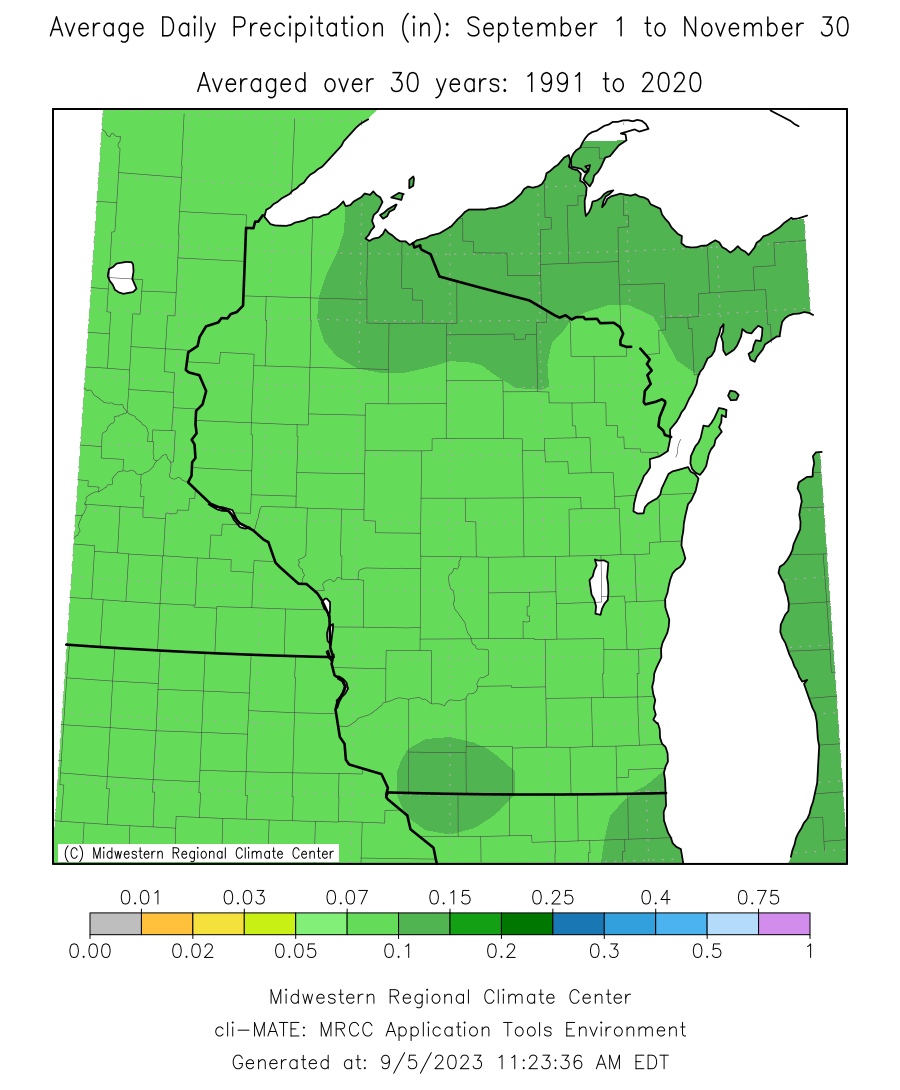
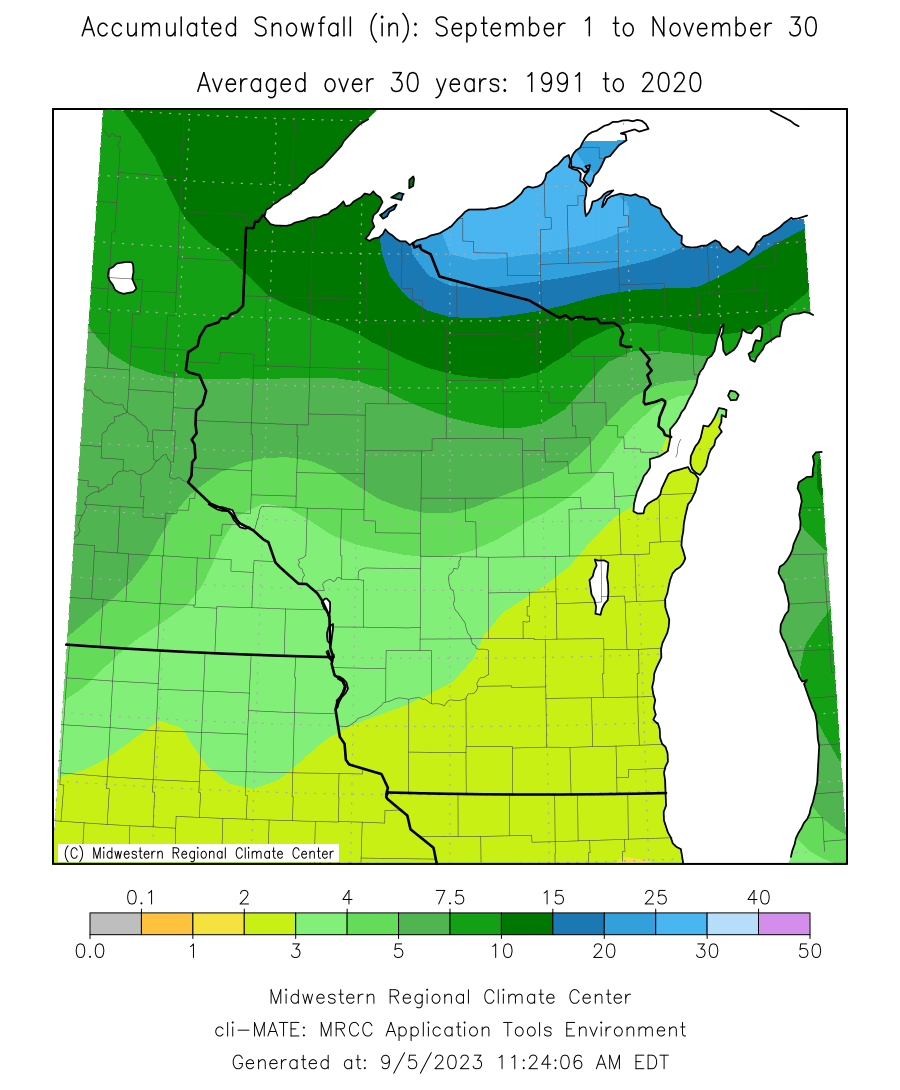
View climate data for meteorological fall (September, October, November). Maps courtesy of the Midwestern Regional Climate Center.

On this page:

  • Temperature
  • Precipitation
  • Snowfall

Temperature

Map of Wisconsin showing an average fall temperature range of 40 to 55 degrees.

Average Temperature

Map of Wisconsin showing an average fall high temperature range of 45 to 65 degrees.

Average High Temperature

Map of Wisconsin showing a fall average low temperature range of 30 to 45 degrees.

Average Low Temperature

Average Fall Temperature Long-Term Variability

Precipitation

Map of Wisconsin showing a fall total precipitation range of 7 to 10 inches.

Total Precipitation

Map of Wisconsin showing a fall daily average precipitation range of 0.05 to 0.2 inches.

Daily Average Precipitation

Total Fall Precipitation Long-Term Variability

Snowfall

Map of Wisconsin showing a fall total snowfall range of 1 to 20 inches.

Total Snowfall

Site footer content

University logo that links to main university website Part of the Universities of Wisconsin

Stay Connected

  • Subscribe to the monthly Wisconsin climate summary newsletter

Archives

  • View the original version of this site

Contact Us

  • Wisconsin State Climatology Office
    1225 W. Dayton St.
    Madison, WI 53706
  • Email: stclim@aos.wisc.edu
  • Phone: (608) 263-2374
    • x twitter
    • instagram

Data used to produce the graphics on this is site is from the Applied Climate Information System (ACIS), Midwest Regional Climate Center (MRCC), NOAA's National Centers for Environmental Education (NCEI), and National Weather Service (NWS).

Website feedback, questions or accessibility issues: webmaster@nelson.wisc.edu.

Learn more about accessibility at UW–Madison.

This site was built using the UW Theme | Privacy Notice | © 2025 Board of Regents of the University of Wisconsin System.