Wisconsin’s climate is changing — temperatures are rising and precipitation patterns are shifting. Two complementary tools can help you investigate these changes from different perspectives:
The Analog Climate Explorer lets you visualize what Wisconsin’s past climate was like by comparing it to places that experience similar conditions today.
The Wisconsin Initiative on Climate Change Impacts’ trends and projections look at how Wisconsin’s climate has changed over time and how it could change in the future.
Together, these tools bring data to life — connecting numbers and maps to real-world experience.
Analog Climate Explorer
What It Is
The Analog Climate Explorer (ACE) is an interactive web tool that shows how Wisconsin’s past climate compares to present-day climates (the average from 1991 to 2020) across the United States.
Developed by Courtney Vanorio through the Nelson Institute for Environmental Studies in collaboration with the Wisconsin State Climatology Office, ACE makes climate change more tangible and easier to understand.
How it Helps
Climate change is often described in numbers — degrees of warming, inches of rain — but those can be hard to visualize. ACE bridges that gap by finding modern-day “analogs” for Wisconsin’s past climate. In other words, it identifies the climate of a place in the United States that Wisconsin once felt like.
For example, the climate of Dane County in March of 2012 was most similar to that of Osage County, Oklahoma — a clear illustration of how unusually warm that March was.
This tool helps connect historical data to see how Wisconsin’s climate has evolved.
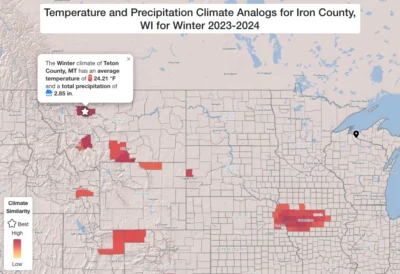
How to Read the Maps
You can view the best matches for each Wisconsin county for a specific year, season, or month. By default, the tool compares both temperature and precipitation, but you can explore each variable separately.
Choosing Iron County and winter 2023 to 2024 shows that the county’s average temperature and total precipitation were most similar to an average winter season in Teton County, Montana.
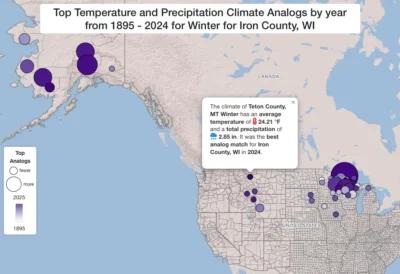
You can also view a time series showing the best match for each year. Each dot represents a year, and larger circles mark counties that were the best match for multiple years.
Wisconsin Climate Trends and Projections
What It Is
The Wisconsin Initiative on Climate Change Impacts (WICCI) provides detailed analyses of how Wisconsin’s climate has changed over the past century — and what’s projected for the future.
This resource includes maps and graphics showing temperature and precipitation trends based on long-term observations and model projections.
How it Helps
These maps and datasets help all of us understand how Wisconsin’s climate has shifted and prepare for what’s ahead.
WICCI’s data-driven analyses reveal clear statewide changes:
- Rising temperatures across all seasons, including extreme temperatures
- Increasing precipitation, especially in heavy rainfall events
How to Read the Maps
The historical climate change maps show how temperature and precipitation have changed in each Wisconsin county between 1950 and 2024.
For example, this figure shows the change in the annual minimum temperature from 1950 to 2024.
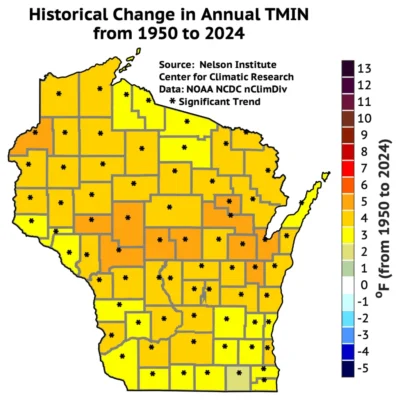
Most counties have warmed by about three to five degrees. Counties marked with asterisks indicate a statistically significant trend, meaning the change is likely not due to random weather fluctuations.
The projections show what changes are anticipated between 2041 and 2060, relative to the 1991 to 2020 historical average.
For example, this figure shows the projected change in annual precipitation by mid-century under a scenario where greenhouse gas emissions peak around mid-century and then decline.
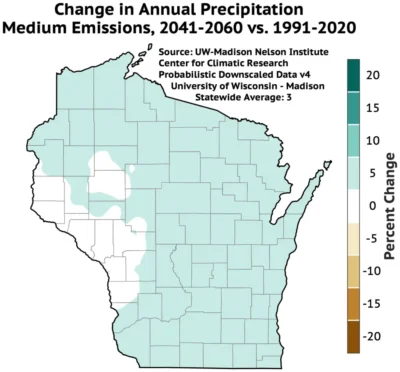
These changes are relative to the historical average (1991 to 2020). Most counties are projected to see about a five percent increase in annual precipitation.