From heat and smoke to floods and storms, August packed a barrage of extremes and ended with an early taste of fall. Summer as a whole was wet, warm, and sticky.
From Sweltering to Sweater Weather
August began on a slightly cooler note for the first few days of the month, but that quickly changed as southerly winds ushered in a burst of heat and humidity from August 7 through 10. The National Weather Service issued a heat advisory for parts of the Fox Valley, Green Bay, and the Northwoods, where heat indices climbed into the triple digits.
All 73 existing Wisconet stations reported highs of at least 80 degrees on August 8, and several locations — such as Black River Falls, Plymouth, and Yorkville — topped 90 degrees. On August 10, West Allis (Milwaukee County) and Jackson (Washington County) recorded 95 degrees, the state’s hottest temperatures of the month.
Overnight temperatures provided little relief, especially in the southern part of the state, where nighttime dew point temperatures stayed in the upper 60s to low 70s during this early-month heat wave.
Even though everyone has different sensitivities to humidity, dew points in the 60s are usually noticeable, while those near 70 degrees bring a Florida-like feel. Normally, Wisconsin’s minimum dew point temperatures in August are in the mid-40s, so the well-above-average dew points made the nights feel especially oppressive.
In Green Bay from August 8 to 9, the overnight low of 74 degrees paired with a dew point near 70 degrees created a particularly muggy night. In Sheboygan County, high dew point temperatures supported dense fog formation, which caused two multi-vehicle crashes.
With another heat wave in the books, Wisconsin has averaged nine nights with lows of 70 degrees or warmer so far in 2025, adding to the increasing trend in the number of very warm nights.
Eventually, the heat faded, and by late in the month, Wisconsin got its first taste of fall. Wisconsin’s first-order weather stations recorded impressive streaks of daily high and low temperatures at or below normal (Table 1).
| Location | Average temperature departure from normal (°F) from August 21-31 |
|---|---|
| Milwaukee | -6.3° |
| Green Bay | -6.3° |
| Madison | -5.3° |
| La Crosse | -5.2° |
| Eau Claire | -4.5° |
| Wausau | -4.4° |
Incredibly, much of northwestern and north-central Wisconsin saw high temperatures only in the 50s on August 24. For reference, the last time Knight (Iron County) saw a high temperature below 60 degrees was June 14, and before that, May 24. Furthermore, not a single Wisconet station recorded a temperature above 70 degrees on August 25.
The lowest statewide temperature of the month was 35 degrees in Eagle River (Vilas County) on August 26 and in Ashland (Ashland County) and Florence (Florence County) on August 29.
The state’s first frost advisory of the season was issued for the morning of August 29 in northern Wisconsin, where lows dipped into the 30s. Remarkably, a very light layer of frost was reported early that morning near Rhinelander.
Typically, frost conditions do not set in until mid-September up north. For this purpose, frost conditions are defined as temperatures less than or equal to 36 degrees. For those tracking the risk of frosts and freezes, the National Weather Service Frost Freeze Decision Support Tool forecasts the probability of conditions conducive to frost or freeze in Wisconsin over the next seven days.
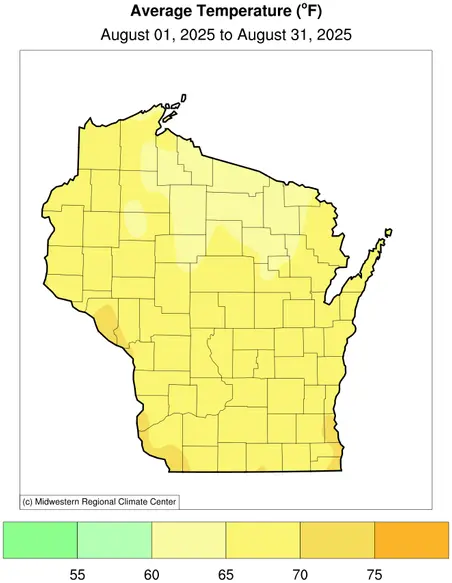
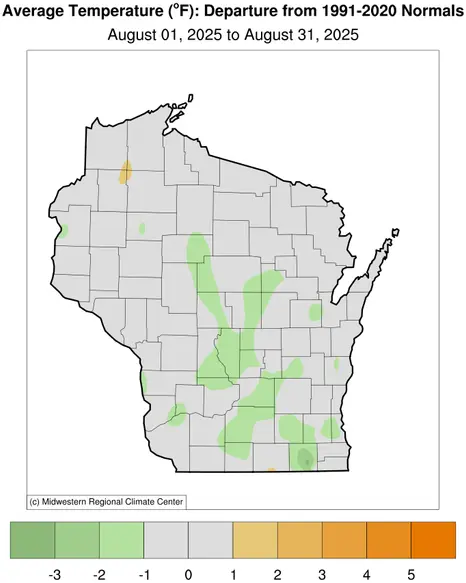
Overall, the month averaged 66.6 degrees, 0.6 degrees cooler than the 1991 to 2020 normal (Figures 1 and 2).
A Humid Summer
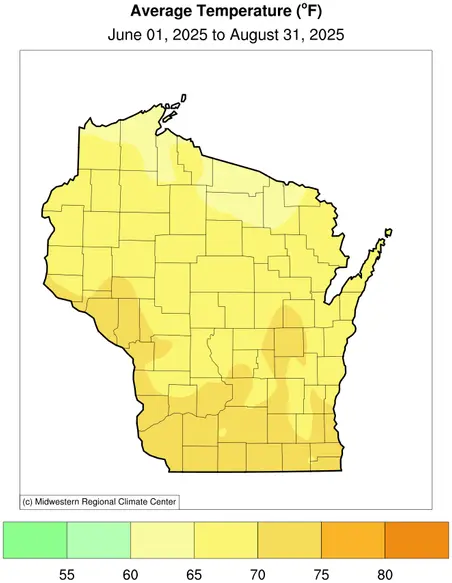
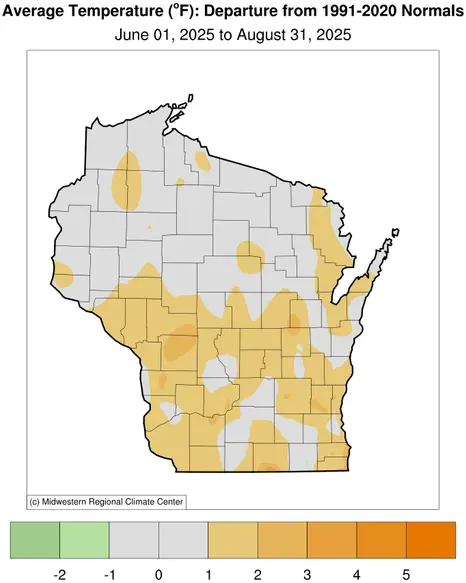
As a whole, summer was warm and sticky. The statewide average temperature for June 1 through August 31 (meteorological summer) was 68 degrees, 0.8 degrees warmer than normal (Figure 3).
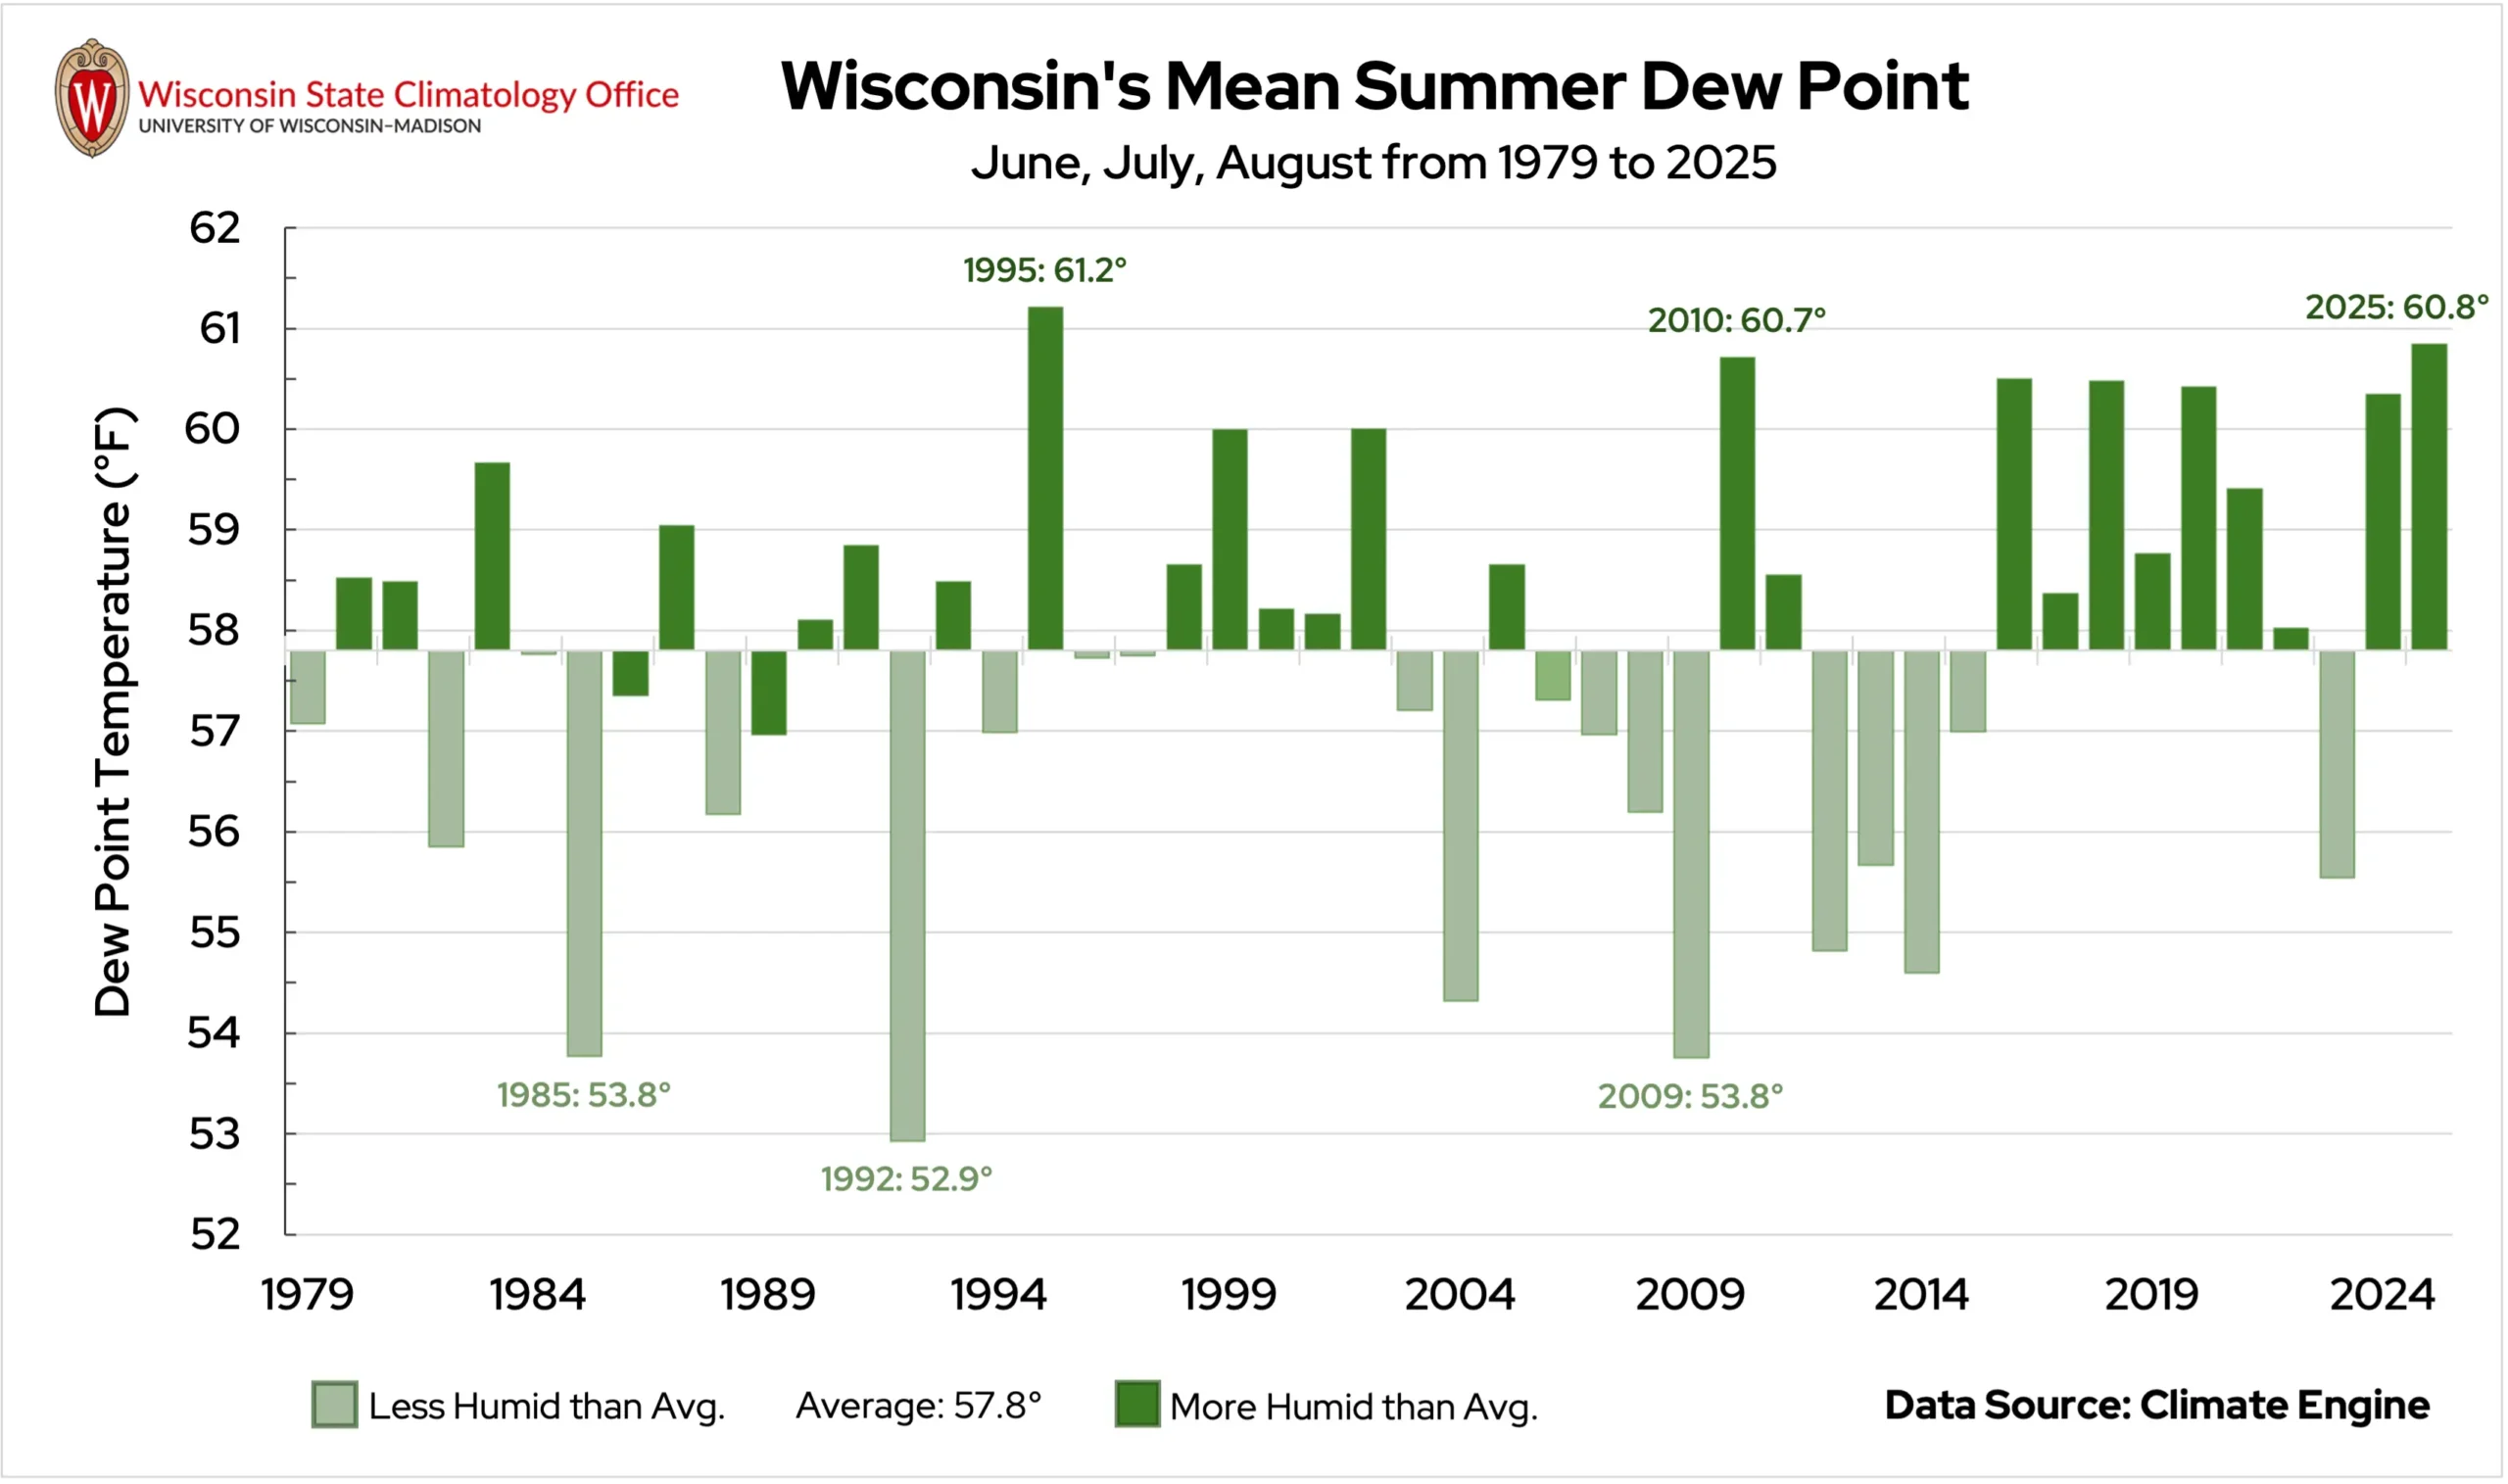
Dew points averaged 60.8 degrees for the summer, which ranks second against all summers on record going back to 1979 (Figure 4) and was surpassed only by the dangerously hot summer of 1995 that produced the deadly Chicago heat wave.
Once again, though, Wisconsin avoided the 100-degree mark — a threshold the state has not reached in recent years. Triple-digit heat used to be a more regular feature of Wisconsin summers.
Nearly three-quarters of all weather stations in the state have logged at least one 100-degree day in their history, but not this summer. The season’s hottest reading was 98 degrees at Kenosha Airport (Kenosha County) on June 23.
This adds to the year-to-year variability that has long characterized the state’s trend — or lack thereof — in hot days, with Wisconsin averaging eight days at or above 90 degrees thus far in 2025.
Downpours for Some, Drizzle for Others
August brought an overabundance of rain to some parts of Wisconsin, while other areas became parched. This is seen when comparing the verified highest and lowest rainfall totals for the month: a CoCoRaHS observer near New Berlin (Waukesha County) measured 14.29 inches of rain, while an observer near Marshfield (Wood County) reported only 0.87 inches.
After a dry first week of the month, disaster struck southeast Wisconsin. On the evening of August 9, heavy rain began to pound the region and didn’t let up until the early morning hours of August 10.
The Milwaukee Mitchell International Airport measured 6.91 inches of rain over the two days, nearly double the city’s average rainfall for the entire month of August. This deluge helped boost Milwaukee’s end-of-the-month rainfall total to 8.94 inches of rain — the city’s second-wettest August on record (August 1987 remains number one with 9.05 inches), and ninth-wettest month overall.
Numerous other locations in the region reported over 12 inches of rain from the August 9 event, which need to be verified by the State Climate Extremes Committee to determine if a new state record for the largest single-day rainfall was set.
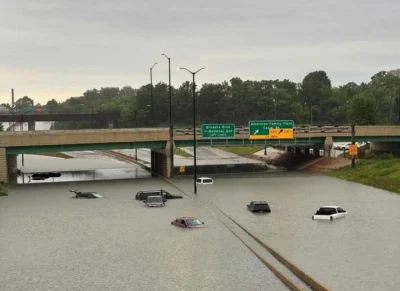
Rivers swelled to record heights, and the Federal Emergency Management Agency’s Preliminary Damage Assessment found more than 4,500 residential and commercial buildings impacted, amounting to over $75 million in damage (Image 1).
The event was categorized as a 1,000-year flood, which speaks to the low probability of a flood of that magnitude occurring in that region rather than the regularity with which it occurs.
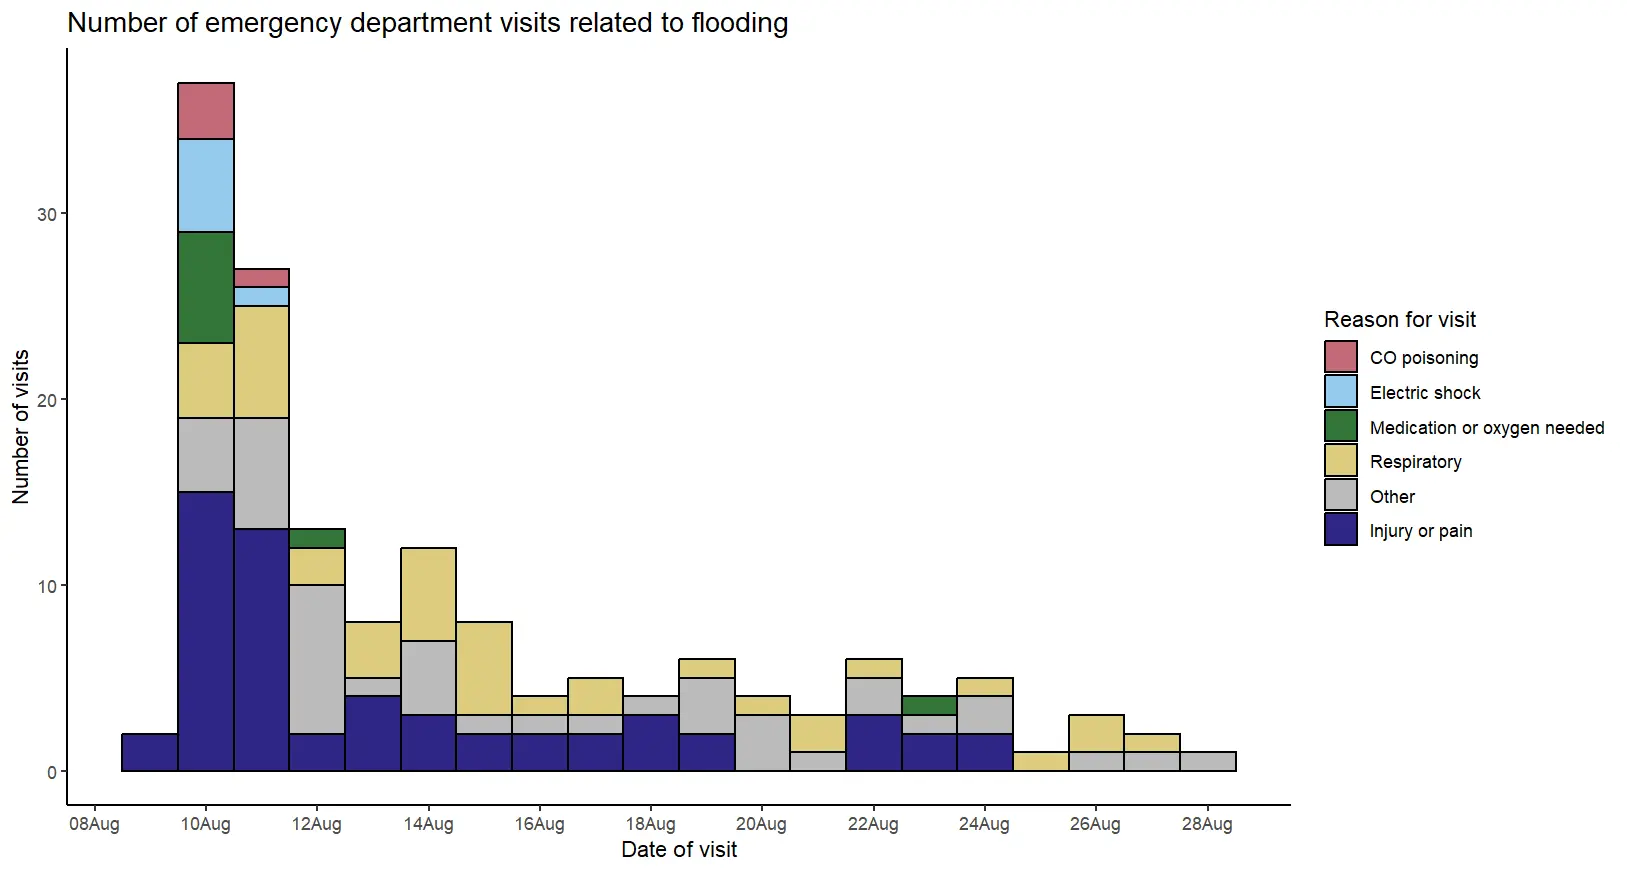
Three deaths and three missing persons are thought to have been linked to the flooding, though an official connection hasn’t been made. Following the event, emergency departments in Milwaukee and Waukesha Counties saw an increase in visits related to flooding, with the most common reason listed as injury or pain (Figure 5).
There are also potential long-term impacts of flooding, such as respiratory issues from mold and mental health concerns with repeated flooding.
You can find a more extensive discussion about the meteorological setup of August 9, rainfall amounts, and impacts in our Wisconsin Climate Chronicle blog.
August 16 through 18 marked another soggy stretch for many in the state, impacting nearly all regions except for the far north (the place where rain was really needed).
Street flooding was seen in Lancaster (Grant County) on August 16, as well as in Winnebago and Outagamie Counties. Two motorists had to be rescued after their vehicles became stranded under a bridge in Stevens Point (Portage County). Roadways were submerged in parts of Pepin and Monroe counties on August 17. Walworth County saw water overflowing ditches onto roads and seeping into basements on August 18, and emergency managers in Rock County reported stalled cars in flood waters in Beloit.
Western Wisconsin received the most rain over those three days, with totals over four inches through Pierce, Pepin, and Buffalo counties. The village of Plum City in Pierce County reported 5.36 inches of rain between August 16 and 18.
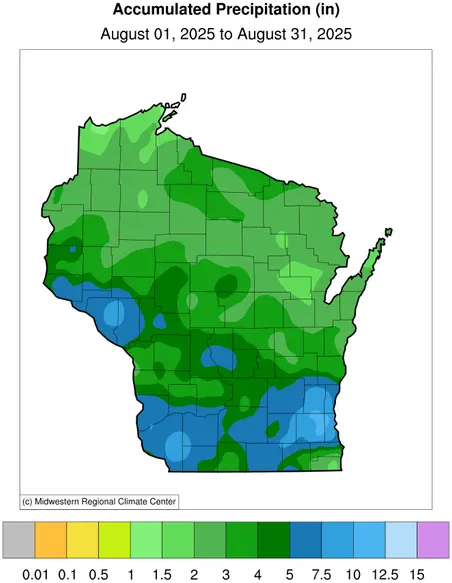
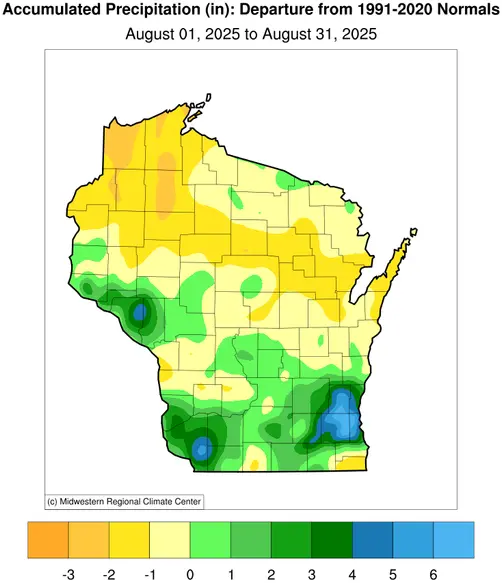
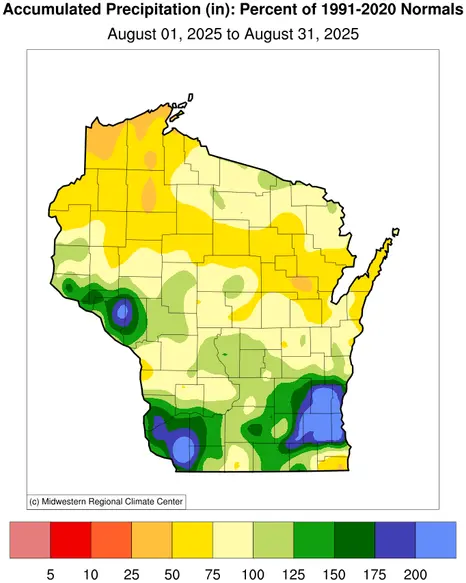
Despite the downpours, the persistently dry conditions of the state won out, and the statewide average precipitation was 0.19 inches below the 30-year average, with a total of 3.71 inches in August (Figures 6 and 7).
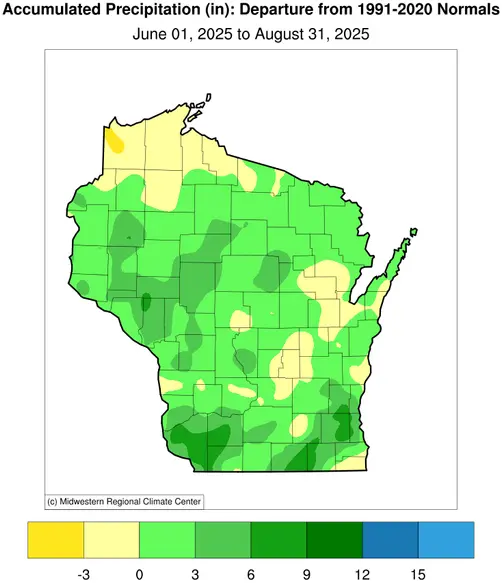
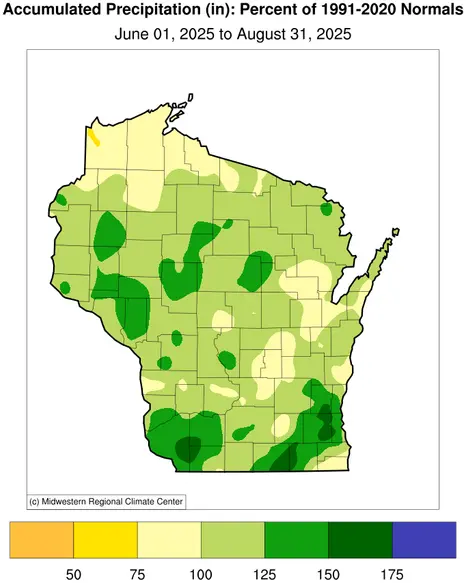
The summer season was a wet one for most of Wisconsin, with the state’s average precipitation 1.44 inches above average (Figure 8). Flooding was common in many areas of the state, especially in the southwest, where 11 flash flood warnings were issued over the three months.
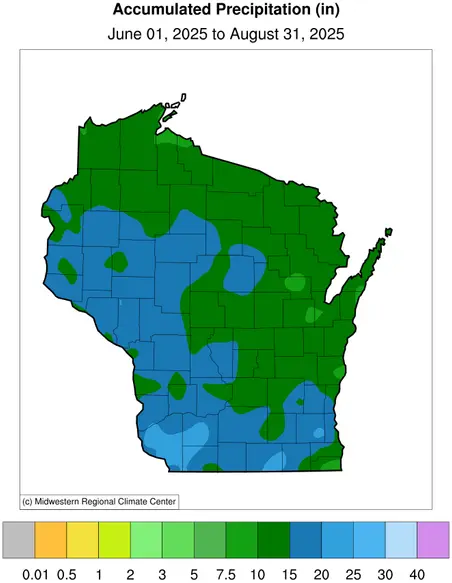
A season total of 16.25 inches of rain in Milwaukee makes it the city’s seventh-wettest summer since 1927. Meanwhile, just 30 miles away, the Kenosha COOP station experienced its fourteenth driest summer since 1944 after measuring only 7.93 inches of rain.
Severe Storms Pack a Punch
The month as a whole was less active than average in terms of severe weather, with 10 fewer severe storm warnings than the 30-year average for August. The storms that did develop were packed into two days.
Before the major floods in southeast Wisconsin on the evening of August 9, a cluster of severe storms formed over north central Wisconsin in the afternoon. Wind gusts of 40 to 60 miles per hour took down trees as the storms moved across the northeast.
Door County suffered the most extensive tree damage, which blocked main roadways and left more than a dozen visitors stranded in Newport State Park and on Cana Island. Power outages forced many local stores and restaurants to close, causing them to lose a significant amount of revenue during their busiest time of year. The National Weather Service later found evidence of a weak tornado in the county near Peninsula State Park (Table 2).
August 2025 Tornadoes in Wisconsin
| Location | Date | Enhanced Fujita (EF) Rating | Estimated Maximum Winds | Damage Reported |
|---|---|---|---|---|
| Peninsula State Park (Door Co.) | August 9 | EF0 | 73 mph | Numerous trees uprooted |
Additionally, a house in Kewaunee County was struck by lightning and caught fire, and two hikers were struck in Kettle Moraine State Forest in Jefferson County.
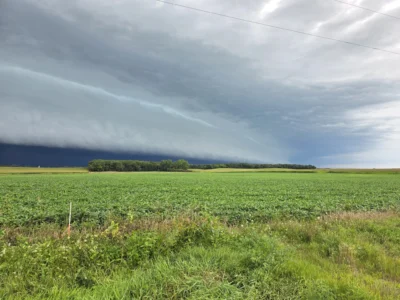
Another round of storms moved across the state on August 16 (Image 2). While the cloud structure and frequent lightning strikes made for a photogenic scene, the storms packed quite a punch. According to emergency managers, three homes in Grant County were struck by lightning and caught fire, and a strike in Sawyer County hit a shed and fried electrical outlets in nearby buildings.
Ping-pong ball to hen egg-sized hail (1.5 to 2.0 inches in diameter) was seen in parts of southern Wisconsin. Wind gusts up to 60 miles per hour took a toll on trees, power lines, and crops across Rock, Dodge, and Columbia counties, with the Dalton Rod & Gun Club in Green Lake County hit particularly hard. The storms weakened as they progressed eastward, where the Waushara County Fair continued despite toppled tents and minor flooding.
Summer 2025 brought a large number of severe storms, many of which were packed into just a few days. The number of severe thunderstorm and tornado warnings issued in the state by the National Weather Service from June through August was higher in 2025 than in the previous three summers.
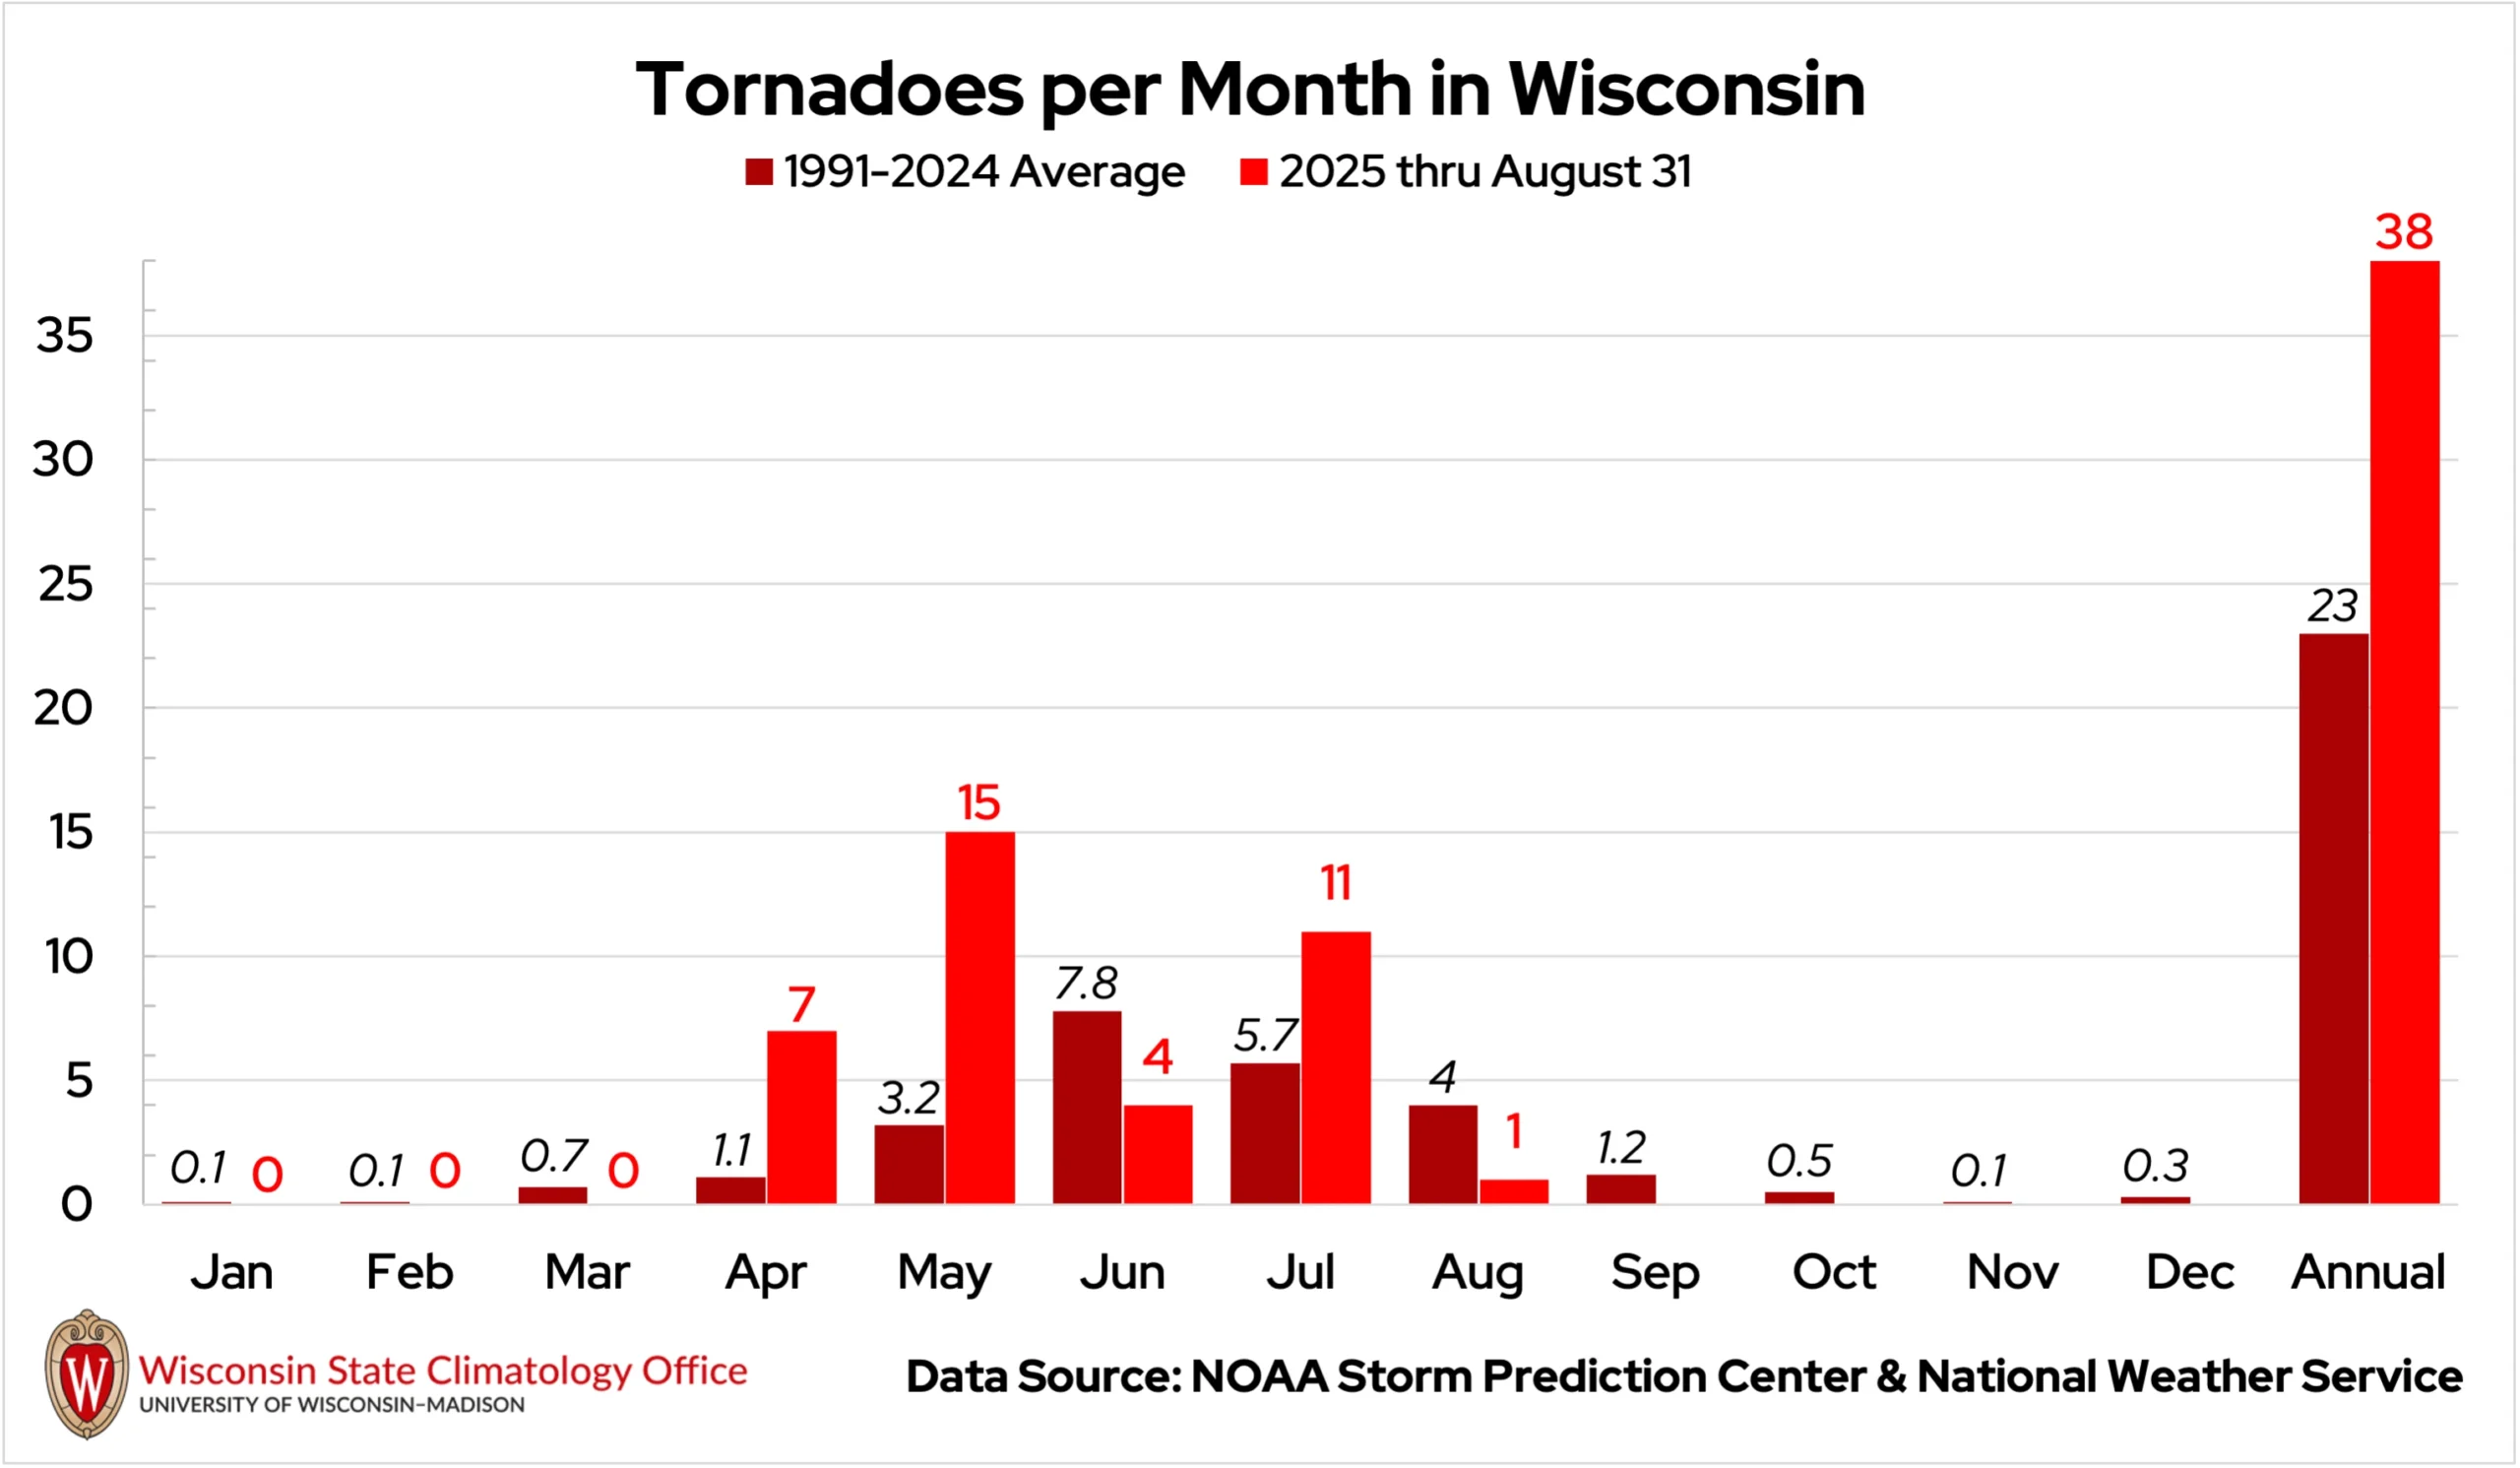
Fifteen tornadoes occurred in the state between June 1 and August 31, 2025, which is about two fewer than average for that time period. However, due to an incredibly active spring, Wisconsin’s tornado count for the entire year stands at 38, which is 15 more than the annual average (Figure 9). This ties for the sixth most tornadoes Wisconsin has experienced in a year.
Reprieve from Drought
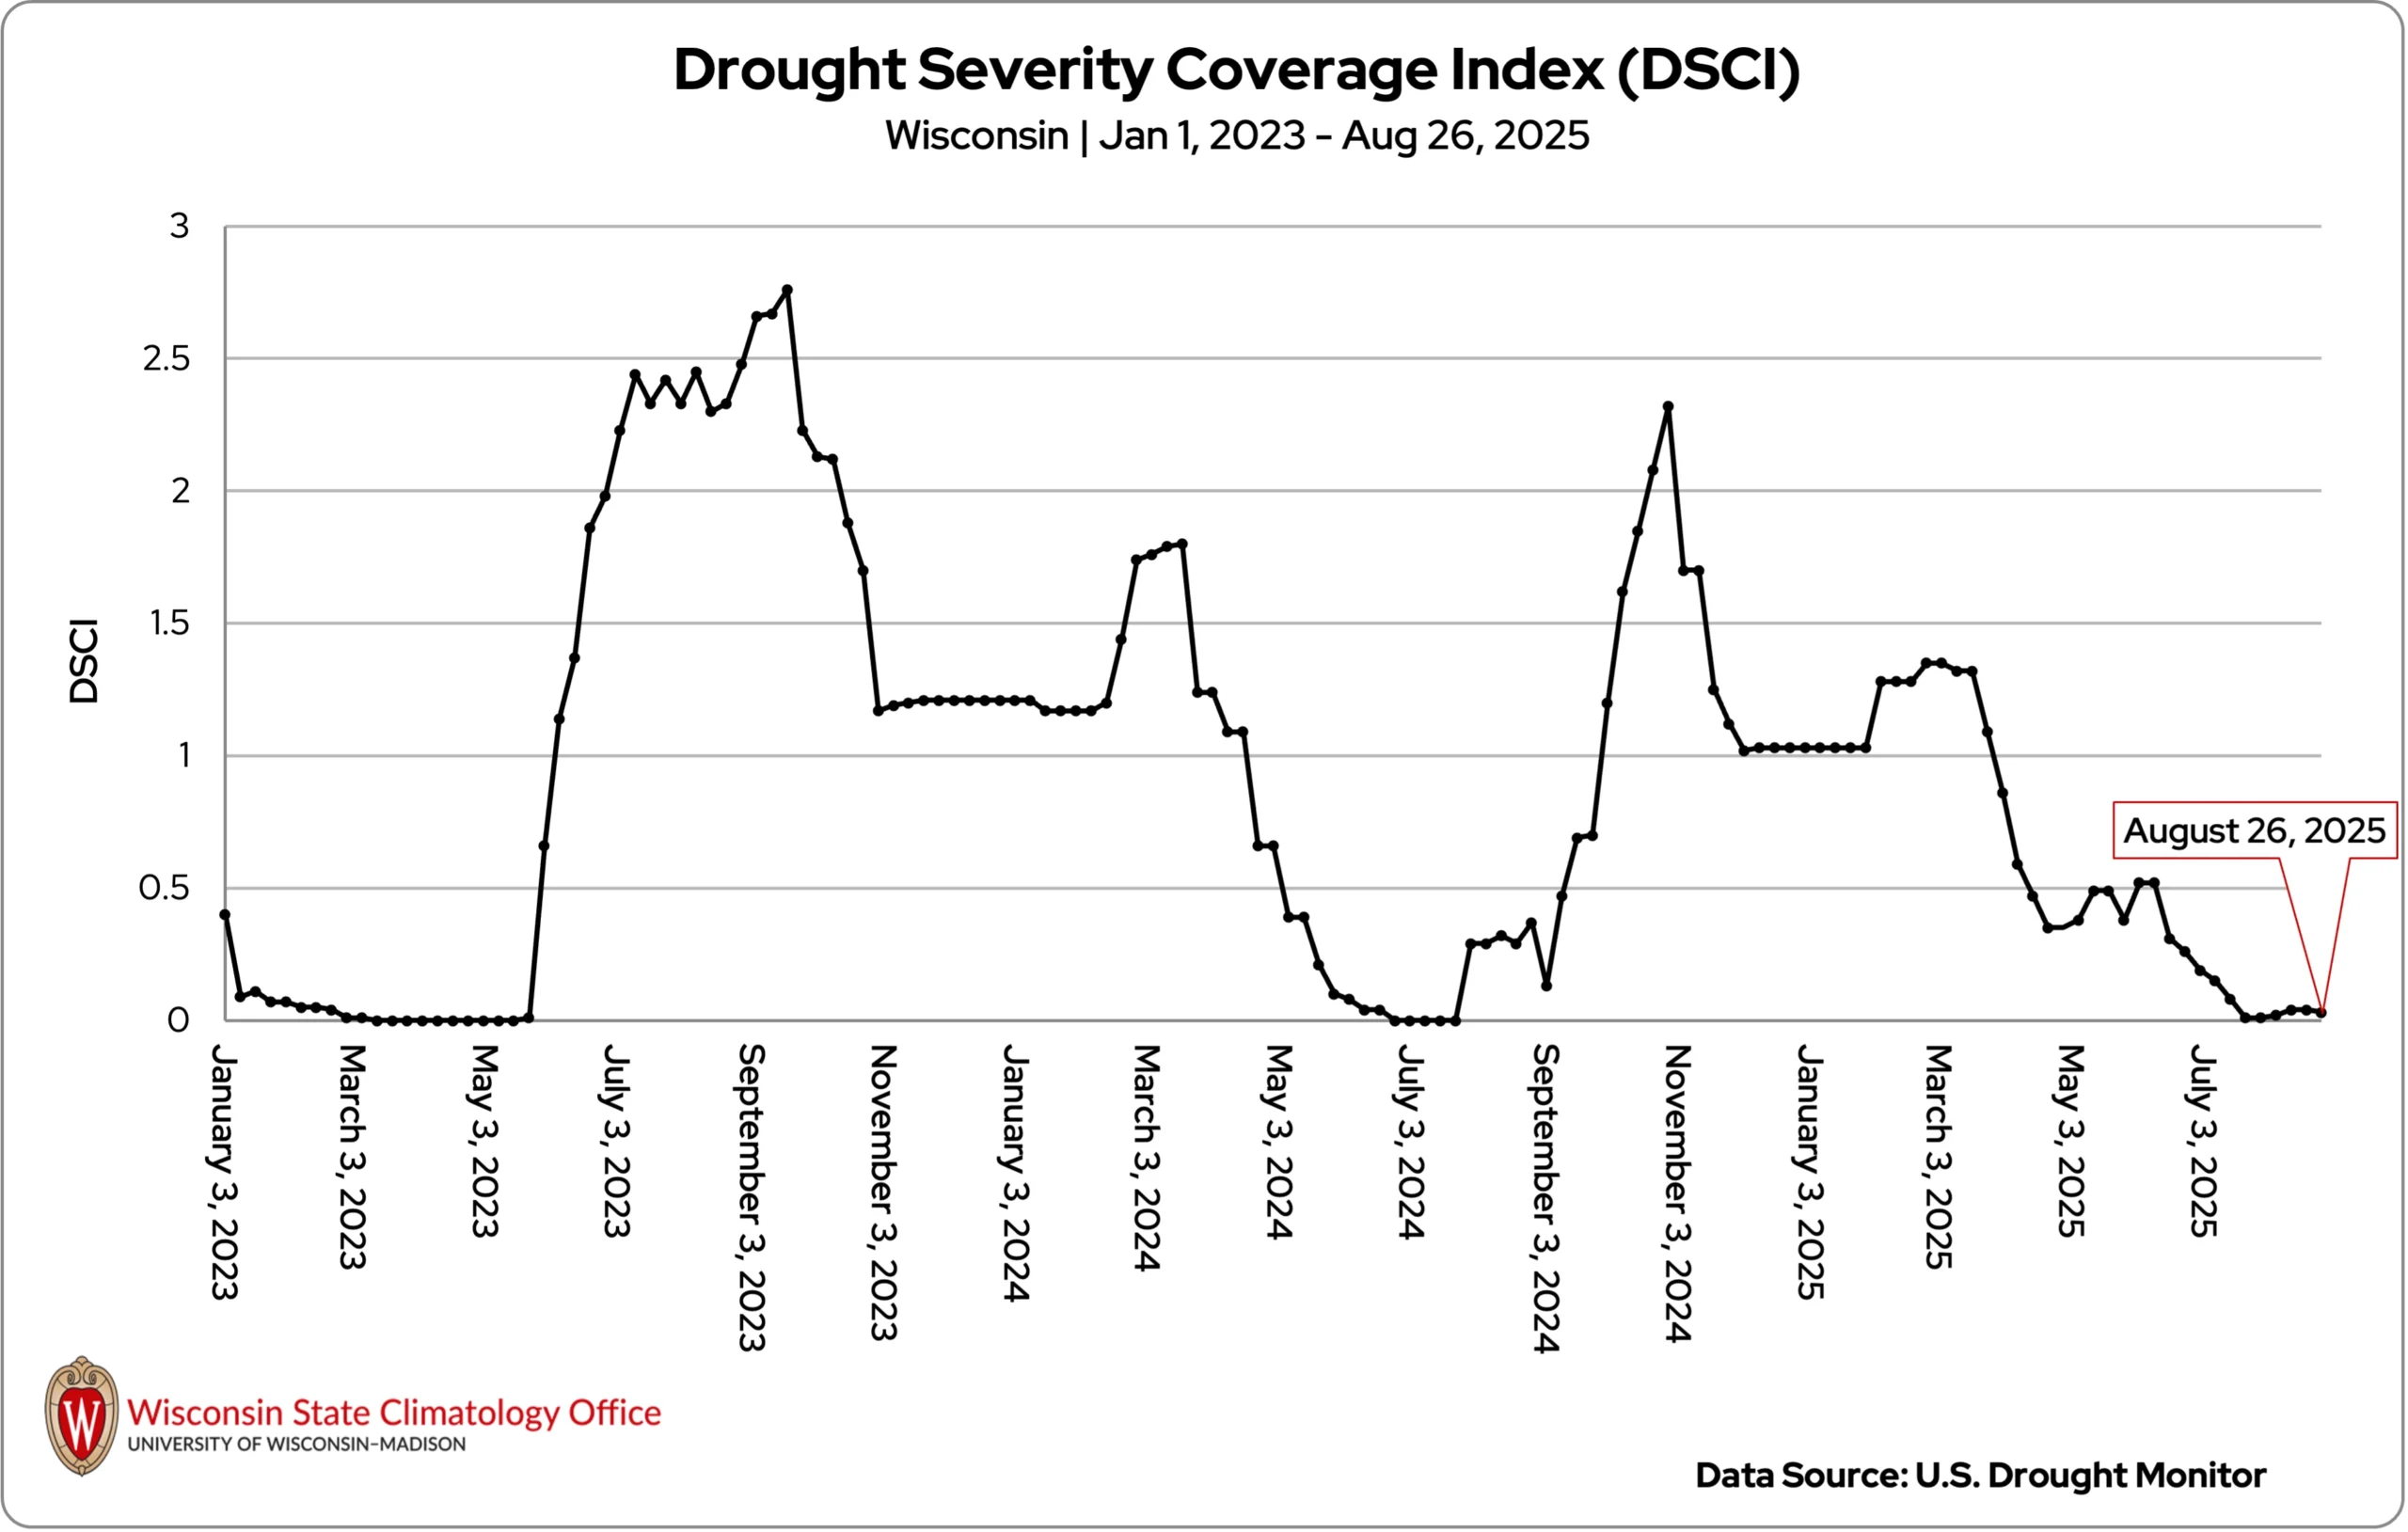
Thanks to the soggy summer, drought conditions improved across the state throughout the season!
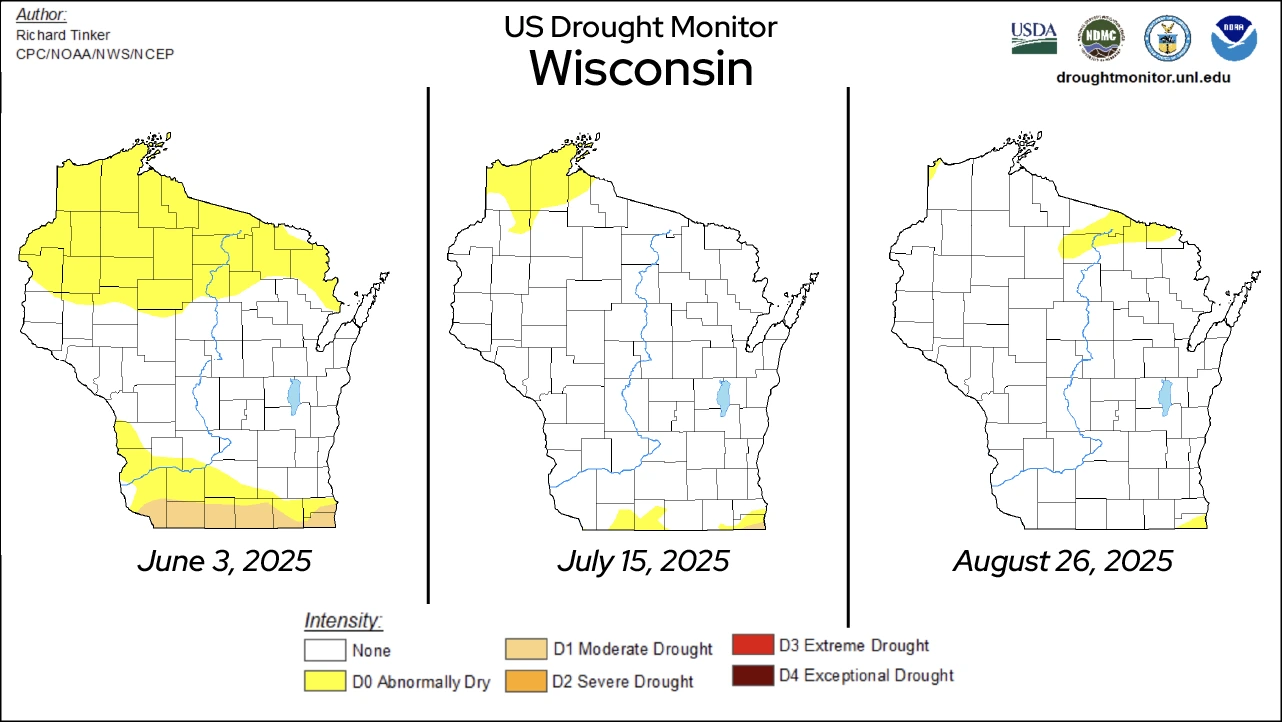
While drought wasn’t particularly acute in June, the southern stateline was in moderate drought conditions (D1), and abnormally dry conditions (D0) had spread across the northern region (Figures 10 and 11).
Beneficial rounds of rain and thunderstorms through June and July helped improve dry conditions, and made Wisconsin completely free of drought on July 22!
Through August, areas of abnormal dryness (D0) began to reemerge in northern Wisconsin as the majority of the rainy systems stayed to the south. Kenosha County experienced persistent dry conditions throughout the entire summer season.
Smoky Start to August
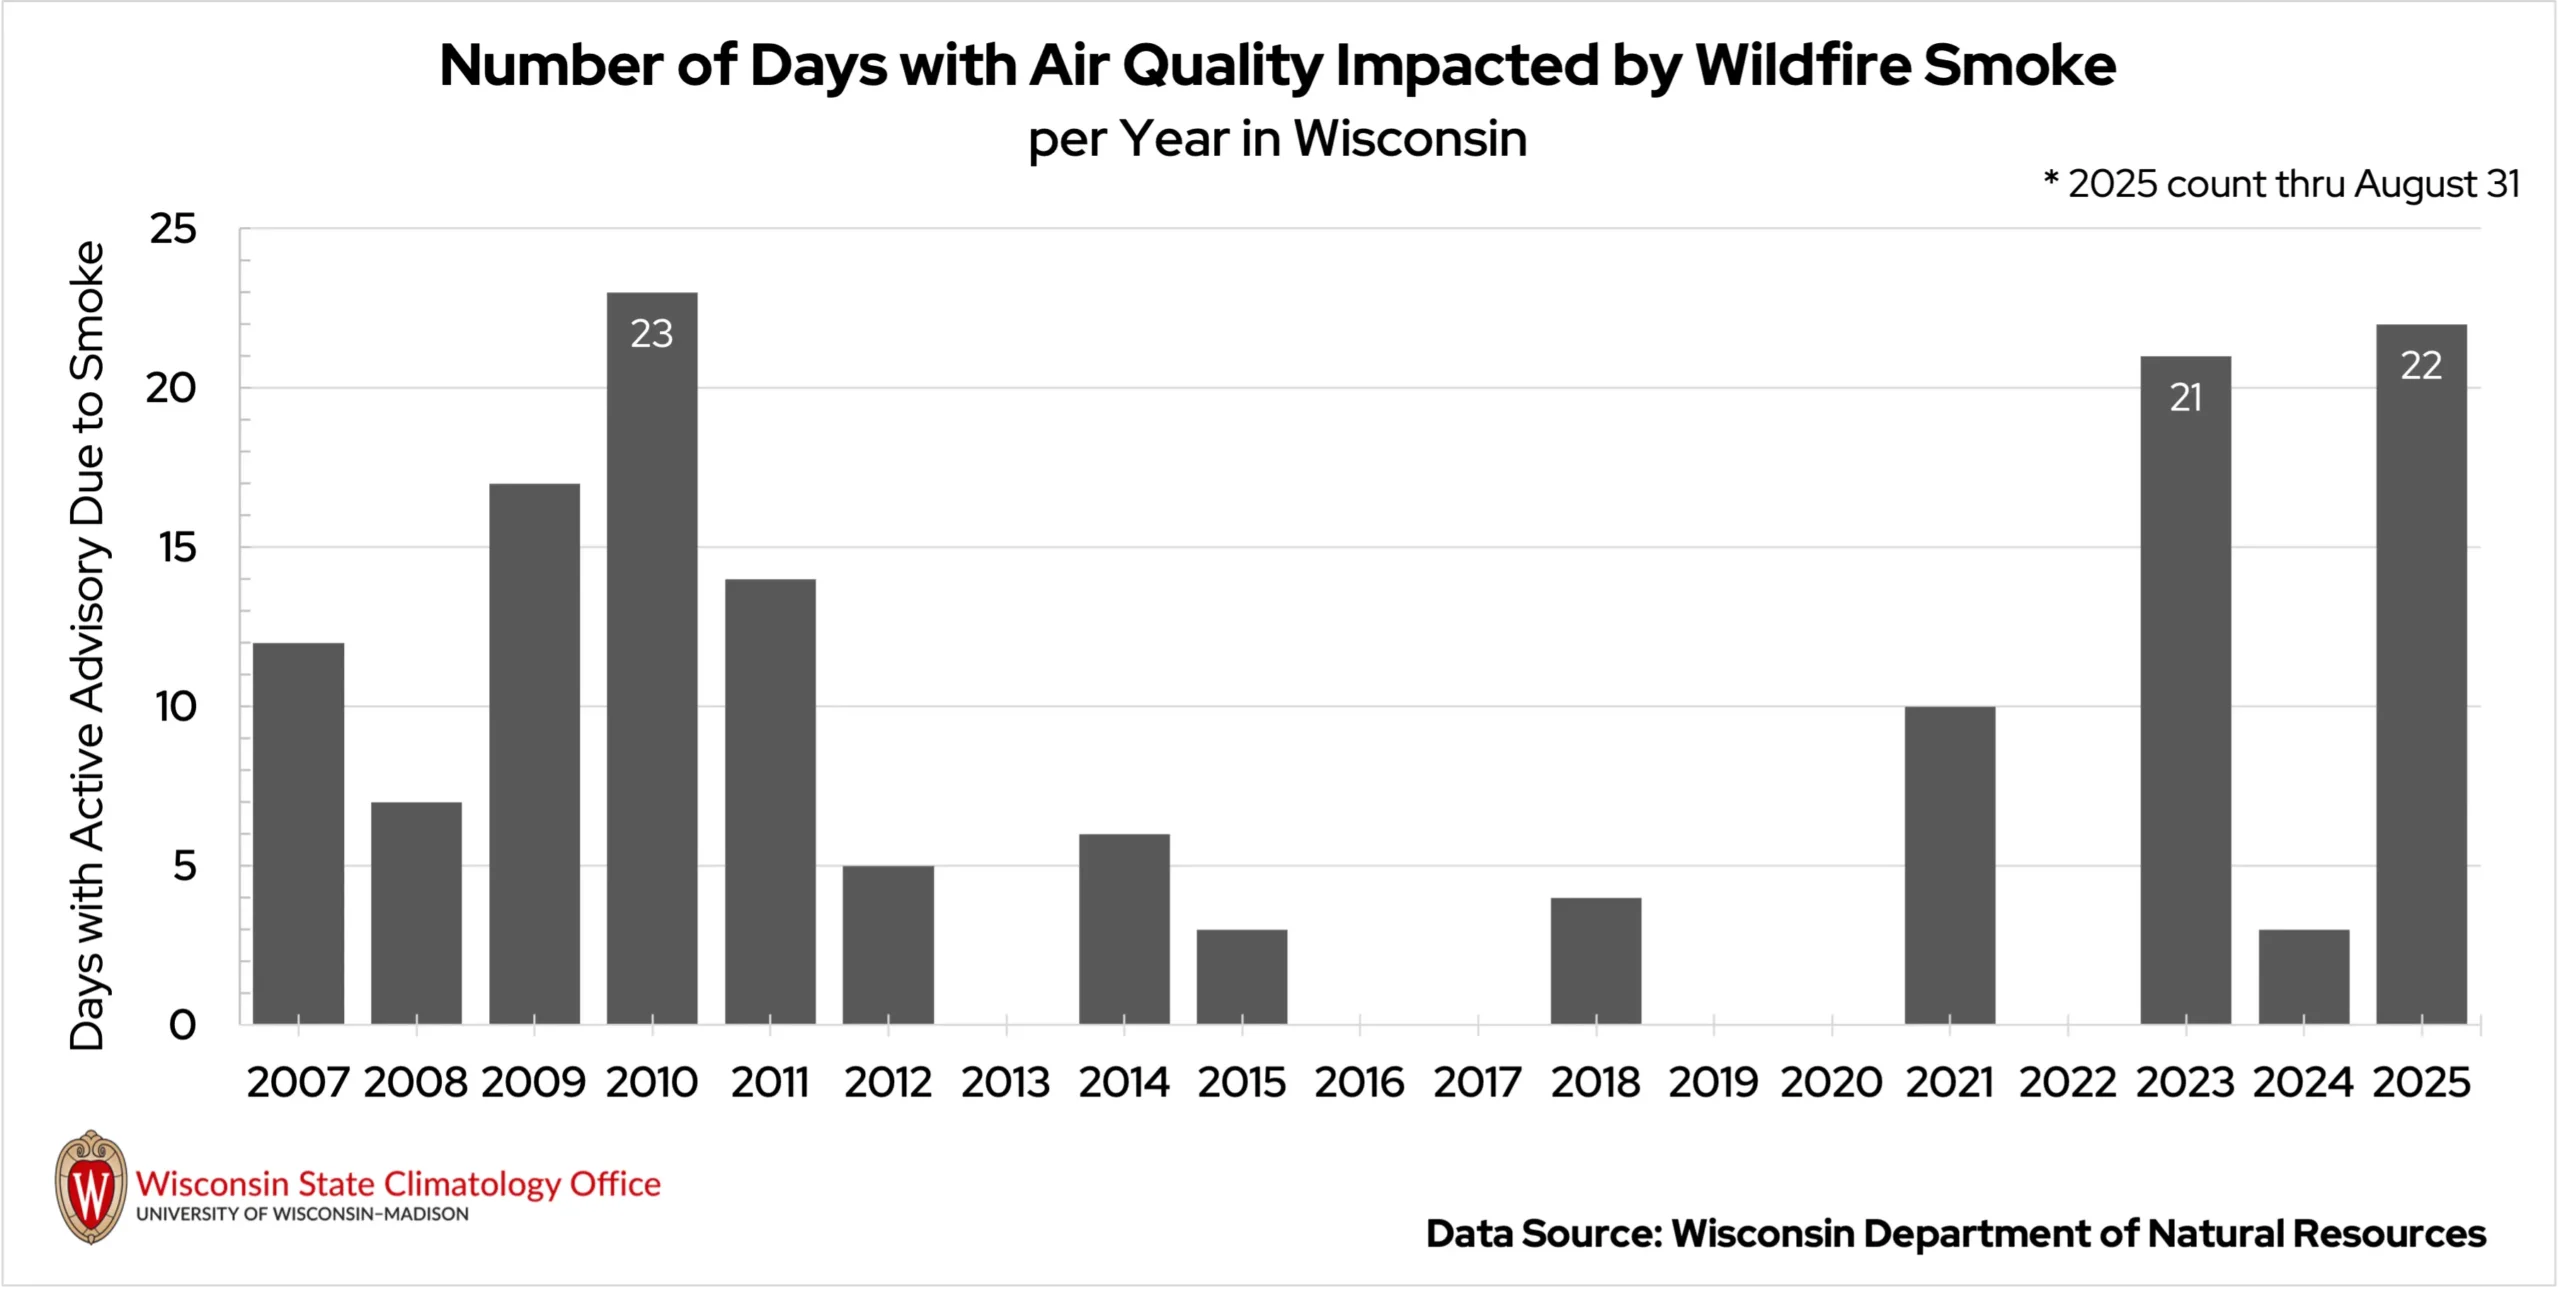
Following a smoky end to July, Wisconsin endured an unprecedented stretch of poor air quality, with nine consecutive days under an air quality advisory from July 29 to August 6. This was the longest streak on record since the Wisconsin Department of Natural Resources began tracking air quality in 2007, although multi-day alerts only began in 2023. While wildfire smoke was heavier in 2023, that year only saw four consecutive days of advisories.
Thanks to the smoky start to August, the total annual number of smoke-impacted days was brought to 22 in 2025 as of August 31. This marks the second-most number of days in a year with Air Quality Advisories attributable solely to wildfire smoke, rather than to other factors such as elevated ozone (Figure 12).
Battered by the Weather
August brought notable setbacks for Wisconsin agriculture. The severe storms on August 9 struck an agriculturally fruitful part of the state — Door County. Apple orchards mostly held up, but softer cherry trees lost limbs. Thankfully, the storms struck after most cherries were harvested and well before apples ripened, minimizing losses.
The heavy rain in southeastern Wisconsin, also on August 9, left fields saturated. Some farms faced nutrient loss, delays in hay harvest, or direct crop damage.
One New Berlin farm reported losing 10 acres of pumpkins as well as peppers and melons to standing water, costing the farm an estimated $25,000 to $30,000.
A soybean farmer in Whitewater expected plants to yellow earlier than they should from excessive moisture, though another noted that the late-season rains might actually help fill pods.
By late in the month, cool nights in northern Wisconsin raised an early frost risk, roughly two to three weeks ahead of the median first-frost date. Farmers and gardeners were pressed to protect sensitive crops and plants.
Climate Corner
The Atlantic hurricane season has been off to a slow start this year, but we’re now entering what is typically the most active time of year in the tropics.
This got us thinking: has Wisconsin ever been hit by a tropical storm? Though it might seem impossible, the remnants of tropical storms sometimes venture into the Midwest! Dr. Data investigated and didn’t have to go back that far in the history books to find his answer. Read more in this month’s Climate Ed-ucation blog!
Climate Stats by Division
August 2025 Temperature (degrees Fahrenheit)
Color Key
-
Dark blue: Record coolest
-
Royal blue: Bottom ⅒
-
Light blue: Bottom ⅓
-
White: Normal
-
Light orange: Top ⅓
-
Orange: Top ⅒
-
Red: Record warmest
| Division | Avg | Dept |
|---|---|---|
| Northwest | 65.6: Normal | -0.3: Normal |
| North Central | 64.2: Normal | -0.7: Normal |
| Northeast | 64.7: Normal | -0.8: Normal |
| West Central | 68.0: Normal | -0.4: Normal |
| Central | 67.3: Normal | -0.8: Normal |
| East Central | 67.5: Normal | -0.6: Normal |
| Southwest | 68.8: Normal | -0.6: Normal |
| South Central | 68.7: Normal | -0.8: Normal |
| Southeast | 69.0: Normal | -0.6: Normal |
| State | 66.6: Normal | -0.6: Normal |
Heating Degree Days
Color Key
-
Dark blue: Record most
-
Royal blue: Top ⅒
-
Light blue: Top ⅓
-
White: Normal
-
Light orange: Bottom ⅓
-
Orange: Bottom ⅒
-
Red: Record fewest
| August 2025 | Since July 1, 2025 | |||
|---|---|---|---|---|
| Division | Avg | Dept | Avg | Dept |
| Northwest | 70: Normal | 1: Normal | 96: bottom ⅓ | -16: bottom ⅓ |
| North Central | 94: Normal | 8: Normal | 126: bottom ⅓ | -15: bottom ⅓ |
| Northeast | 85: Normal | 8: Normal | 107: bottom ⅓ | -16: bottom ⅓ |
| West Central | 40: Normal | 0: Normal | 50: Normal | -15: Normal |
| Central | 50: Normal | 5: Normal | 50: Normal | -12: Normal |
| East Central | 44: Normal | 2: Normal | 53: Normal | -13: Normal |
| Southwest | 36: Normal | 1: Normal | 43: Normal | -11: Normal |
| South Central | 35: Normal | 2: Normal | 35: Normal | -12: Normal |
| Southeast | 32: Normal | 0: Normal | 38: Normal | -9: Normal |
| State | 43: Normal | 2: Normal | 52: Normal | -11: Normal |
Liquid-Equivalent Precipitation (Inches)
Color Key
-
Dark brown: Record driest
-
Light brown: Bottom ⅒
-
Beige: Bottom ⅓
-
White: Normal
-
Light green: Top ⅓
-
Green: Top ⅒
-
Dark green: Record wettest
| August 2025 | Since Nov. 1, 2024 | |||
|---|---|---|---|---|
| Division | Avg | Dept | Avg | Dept |
| Northwest | 2.60: bottom ⅓ | -1.37: bottom ⅓ | 25.34: normal | -0.47: normal |
| North Central | 3.34: normal | -0.38: normal | 28.24: top ⅓ | 1.89: top ⅓ |
| Northeast | 2.36: bottom ⅓ | -1.05: bottom ⅓ | 28.93: top ⅓ | 3.60: top ⅓ |
| West Central | 4.16: normal | -0.23: normal | 30.19: top ⅓ | 1.83: top ⅓ |
| Central | 3.77: normal | -0.23: normal | 30.18: top ⅓ | 2.50: top ⅓ |
| East Central | 2.97: normal | -0.52: normal | 27.73: top ⅓ | 1.13: top ⅓ |
| Southwest | 5.08: top ⅓ | 0.92: top ⅓ | 32.98: top ⅓ | 2.04: top ⅓ |
| South Central | 5.32: top ⅓ | 1.18: top ⅓ | 29.81: top ⅓ | -0.46: top ⅓ |
| Southeast | 6.54: top ⅒ | 2.74: top ⅒ | 30.58: top ⅓ | 1.49: top ⅓ |
| State | 3.71: normal | -0.19: normal | 28.91: top ⅓ | 1.45: top ⅓ |
Monthly, seasonal, and annual temperature and precipitation values and rankings published in this report are from NOAA’s National Centers for Environmental Information at the time of posting this climate summary. Values and rankings can change after publishing our climate summaries. To check the most recent values and rankings, visit NOAA’s National Centers for Environmental Information Climate at a Glance Tool.
This report is a product of the Wisconsin State Climatology Office. For questions and comments, please contact us by email (stclim@aos.wisc.edu) or phone (608-263-2374).