December 2024 showcased the dynamic nature of winter in the Badger State, from dramatic temperature swings and underwhelming snowfall to hard-to-predict lake ice and dense fog.
A Dry Start to Winter
The first month of meteorological winter was ever-so-slightly drier than average, with a statewide precipitation average of 1.25 inches (rain plus melted snowfall). While this may seem minimal, December is climatologically Wisconsin’s third-driest month, so last month’s amount is just 0.27 inches below normal, or 82 percent of normal (Figure 1). The western half of the state experienced a few pockets of slightly above-normal totals.
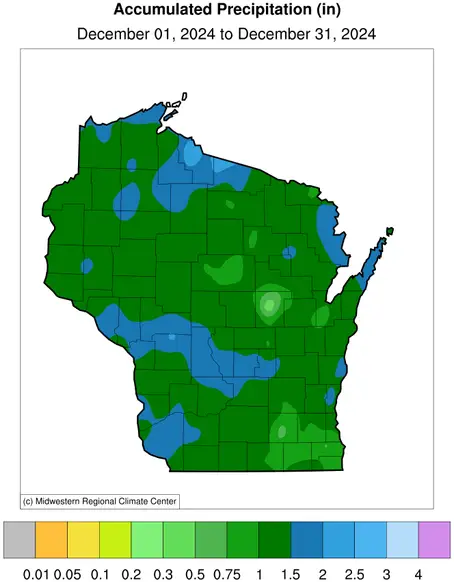
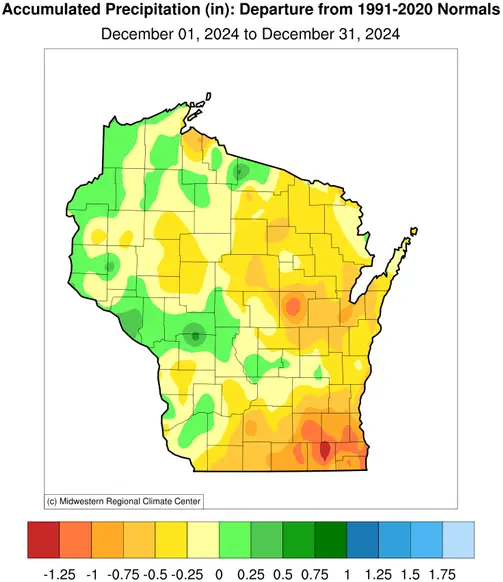
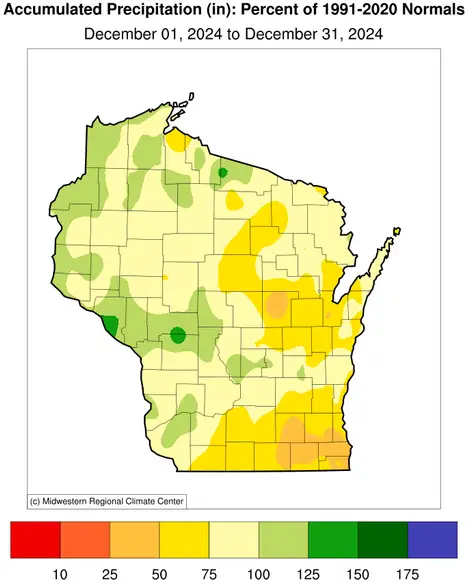
A significant share of this precipitation was reported at Rest Lake in Vilas County, which received an unseasonably large 1.35 inches in just 24 hours on December 28, and Lynxville (Crawford County) saw 1.15 inches. While one would reasonably imagine that this precipitation fell as snow, it actually came down in liquid form as a result of the above freezing temperatures.
On the other hand, the majority of Wisconsin experienced below-normal precipitation, particularly in the southeast. Lake Geneva in Walworth County logged just 1.08 inches of precipitation for the entire month compared to its normal 2.31 inches for December. Similarly, Whitewater in Jefferson County accumulated a meager 0.89 inches, 0.86 inches below its normal.
Snowfall Shortfall
Snowfall amounts ranged substantially across the state: southern and northwestern Wisconsin received 2.5 to 5 inches, while central and northern regions saw 5 to 10 inches (Figure 2). A few areas in central and east-central Wisconsin recorded 10 to 15 inches, and the lake-effect snowbelt in far north-central Wisconsin accumulated 10 to 20 inches.
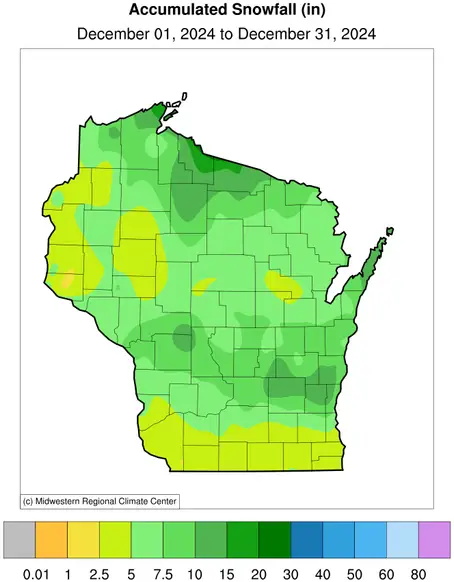
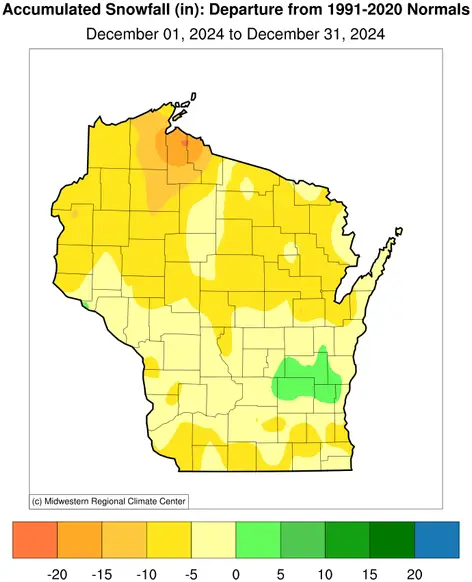
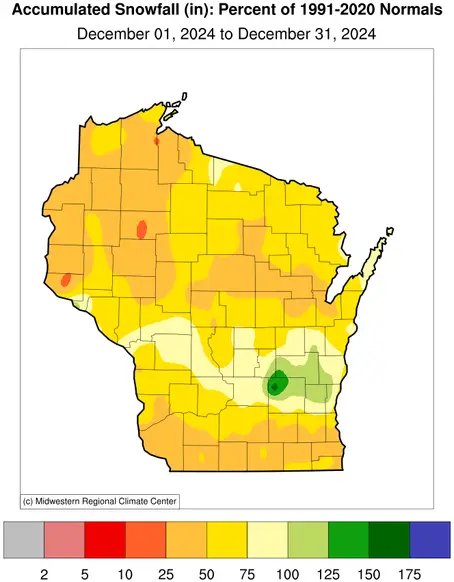
Despite these amounts, snowfall was below normal across most of the state, especially in north-central Wisconsin, which fell 10 to 20 inches short of normal. Portions of Calumet, Fond du Lac, Sheboygan, Ozaukee, Washington, and Dodge Counties were the lone exceptions, with totals slightly above normal by less than five inches.
A standout event was the Alberta Clipper from December 19 to 20 bringing snowfall to most of Wisconsin, most notably to the southern half of the state. Alberta Clippers are fast-moving low-pressure systems that originate in the Canadian province of Alberta, often delivering light to moderate snowfall, brisk winds, and a sharp drop in temperatures as they sweep across the Midwest.
La Crosse set a daily snowfall record for December 19 with 6.6 inches, and localized totals were in the 7 to 11 inch range over portions of Columbia, Dodge, Washington, and Ozaukee Counties. This snowstorm and an additional coating on December 23 helped ensure a White Christmas for most of Wisconsin — a nostalgic hallmark of the season that has become increasingly uncommon in recent years due to milder Decembers (Figure 3).
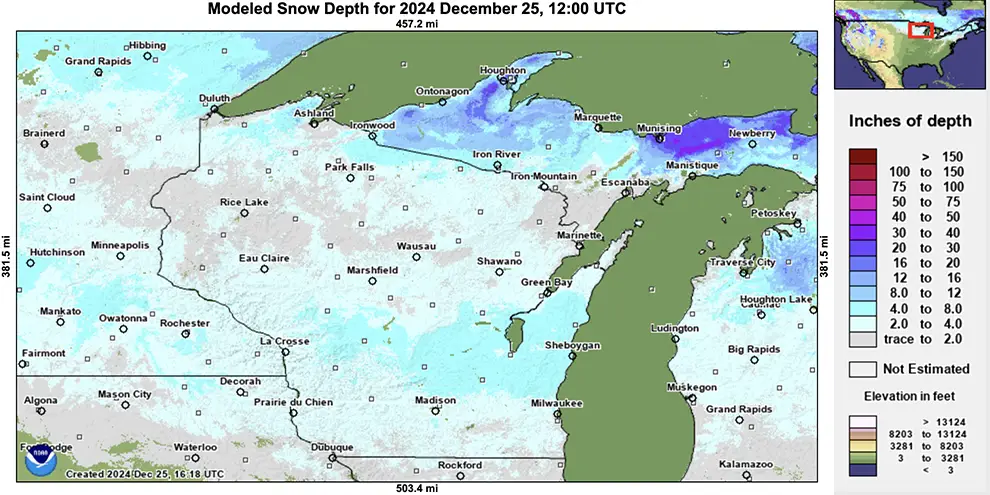
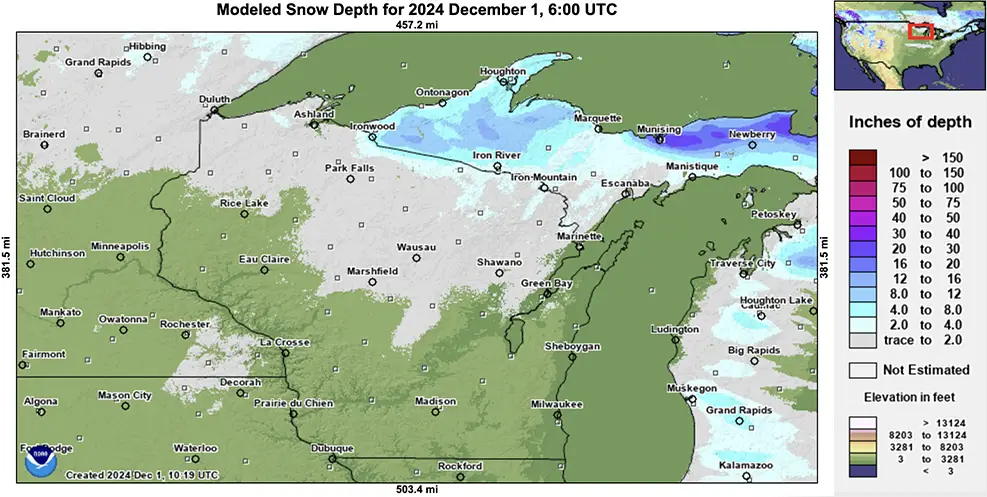
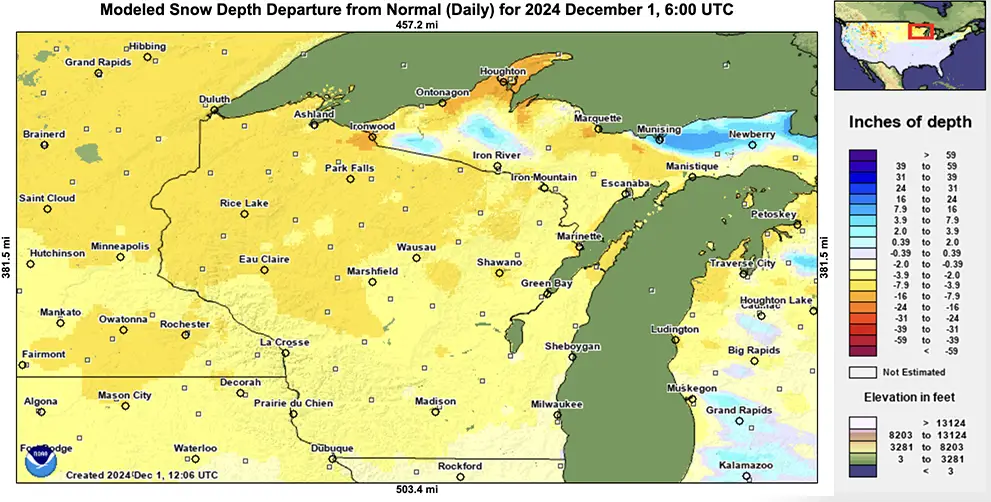
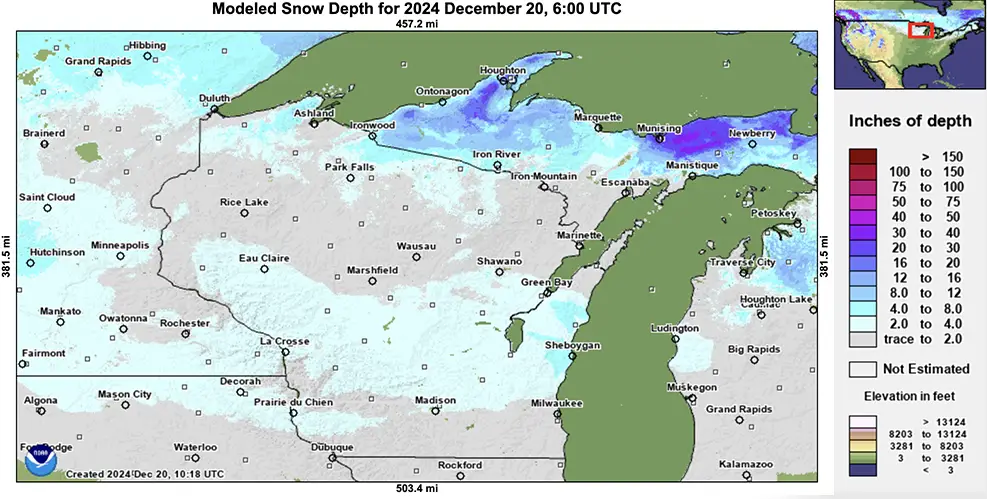
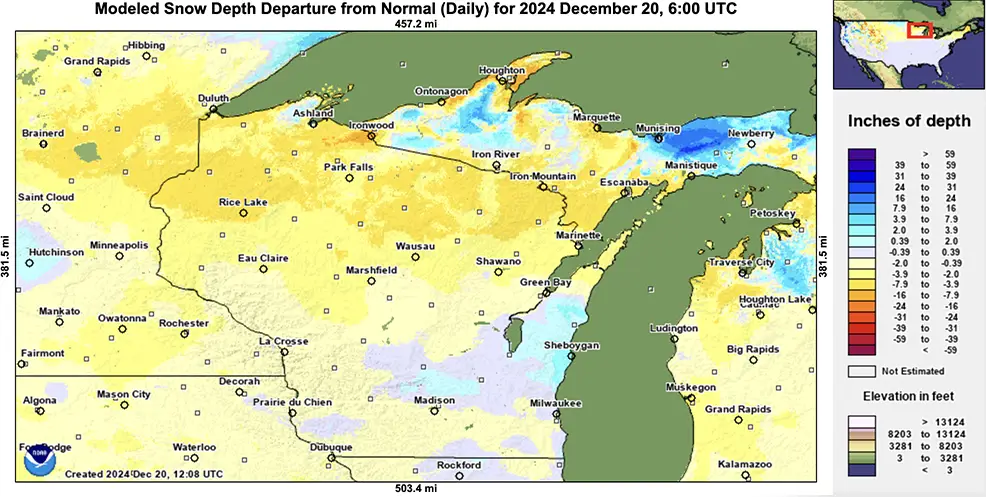
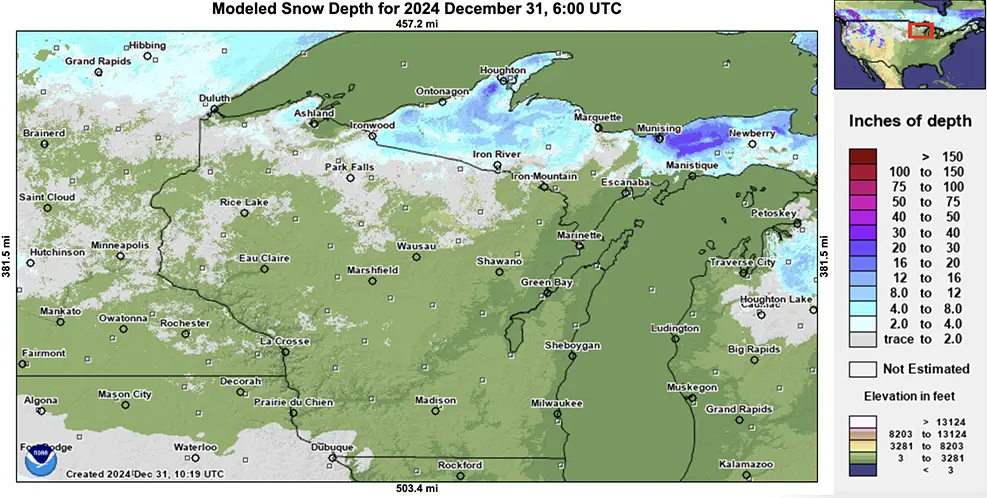
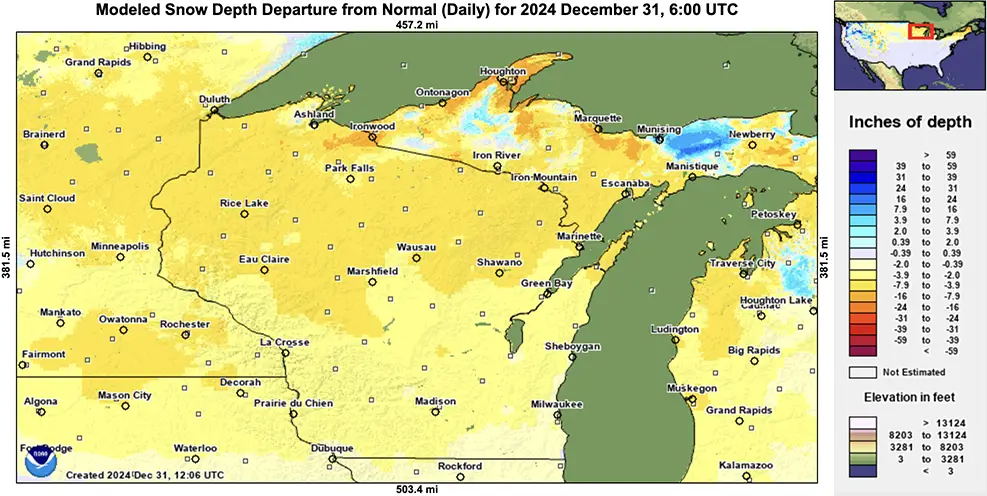
Below-normal snowfall combined with above-freezing temperatures made it difficult to maintain snow on the ground. Figure 4 highlights the state’s snow depth — or lack thereof — at the beginning, middle, and end of December, as well as the consistently below-normal snowpack throughout the month. The exceptions were the slightly above-normal snowpack in east-central Wisconsin following the December 19 event and the lake effect region of northern Ashland and Bayfield Counties.
Unfortunately, the lack of snow has made it difficult for snowmobilers and cross country skiers to enjoy the trails. Fortunately, temperatures have been cool enough to make snow at ski resorts.
A See-Saw of Temperatures
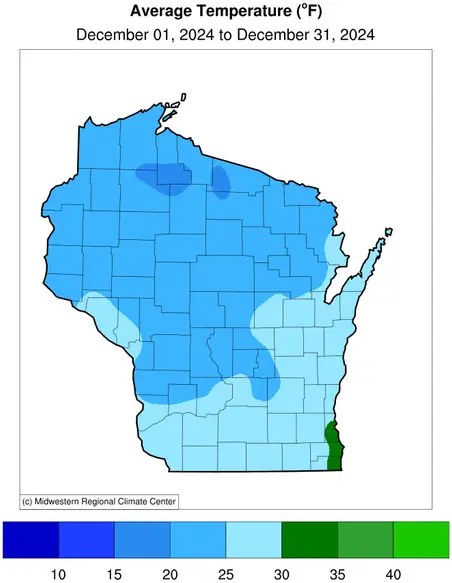
December brought a much more seasonable chill to Wisconsin compared to the record breaking warmth of December 2023. Temperatures averaged 23.7 degrees (Fahrenheit) compared to the long-term statewide average of 21.4 degrees (Figure 5), and the month featured a temperature see-saw, with significant fluctuations day-to-day (Figure 6).
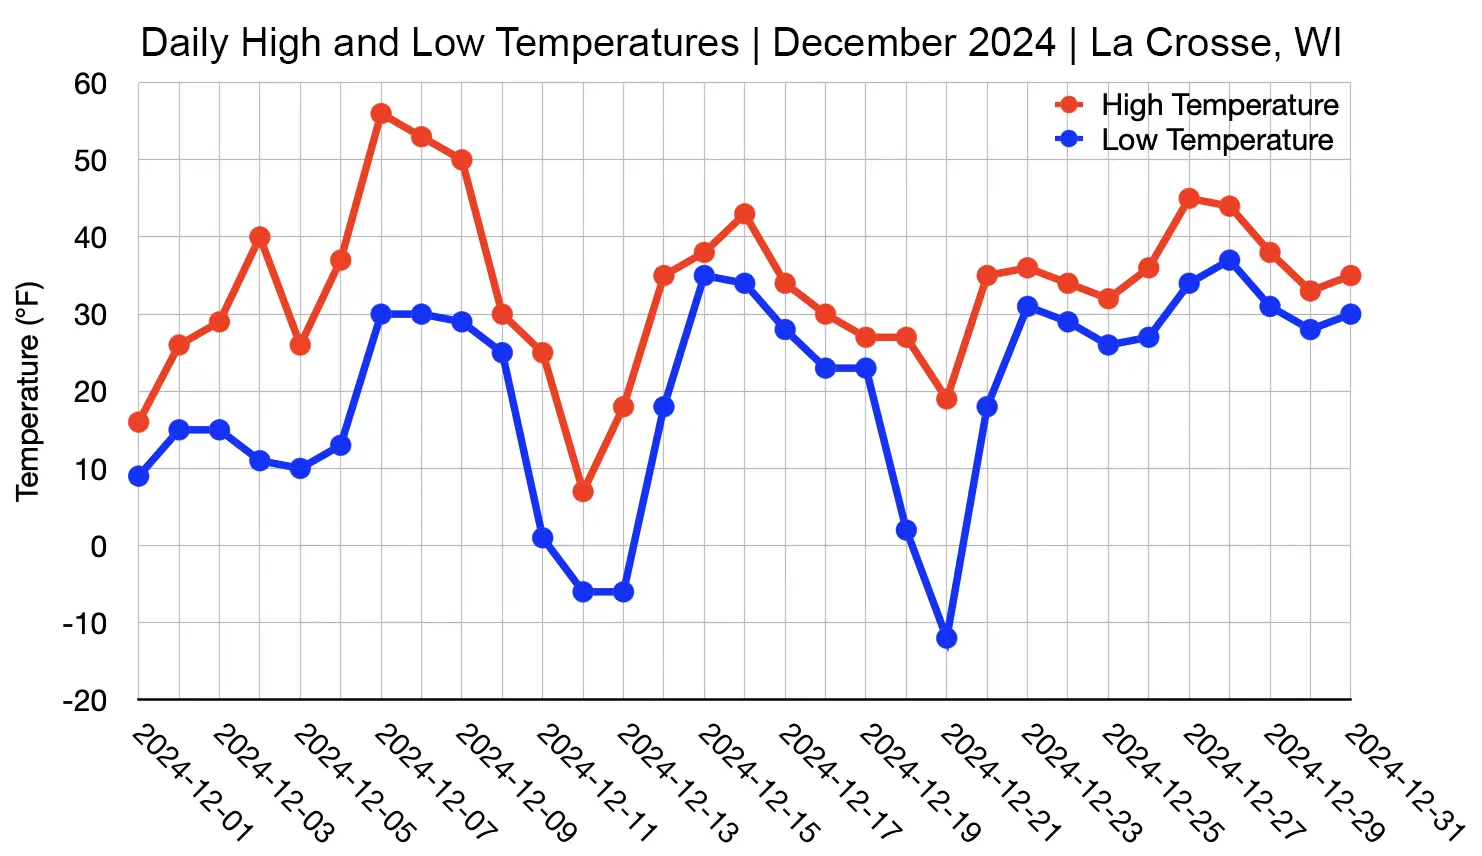
On December 12, Madison dropped to minus one degree, and La Crosse hit six degrees below zero, the first subzero readings of the winter at both locations. Interestingly, these subzero milestones aligned closely with their historical averages. On the flip side, however, just three days later, Madison’s low temperature skyrocketed to 37 degrees, while La Crosse’s low reached 35 degrees. In Wausau, high temperatures varied wildly from 46 degrees on December 7 to only 2 degrees on December 12 and then up to 38 degrees three days later.
These dramatic temperature swings were felt throughout the state, with extremes highlighting this dynamic month. Wisconsin recorded its coldest reading of the year when Butternut (Ashland County) plunged to a frigid 25 degrees below zero on December 13 and 14, surpassing the previous low of minus 23 degrees in Sparta back on January 20. Minus 25 degrees also tied for the coldest temperature recorded on December 13, 2024, in the contiguous United States.
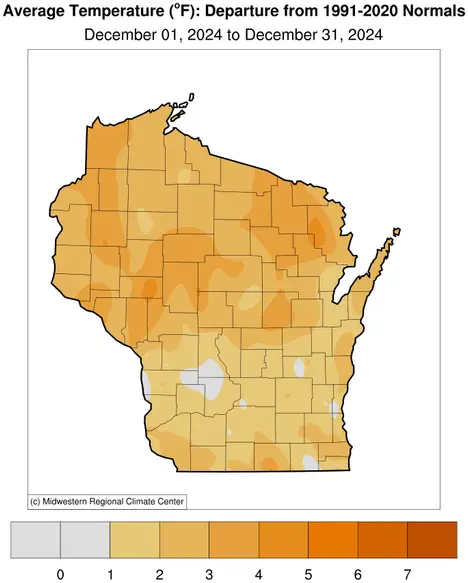
On the opposite end of the spectrum, Prairie du Chien (Crawford County) enjoyed an unseasonably warm 57 degrees on December 7 and 8, marking the highest temperature of the month statewide. Interestingly, while temperatures fluctuated wildly, both maximum and minimum temperatures trended above normal throughout December (Figure 7).
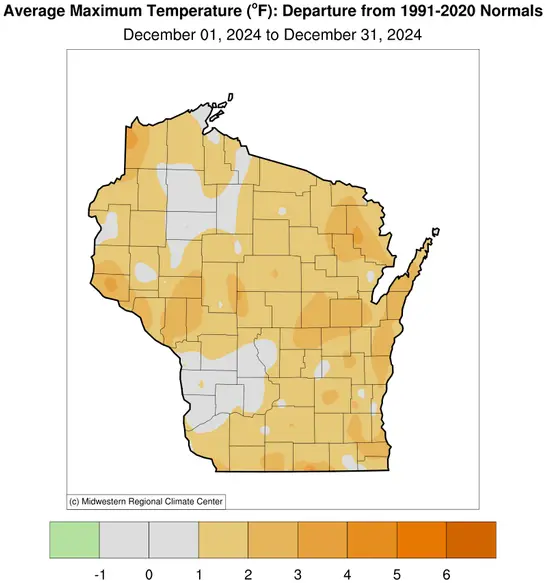
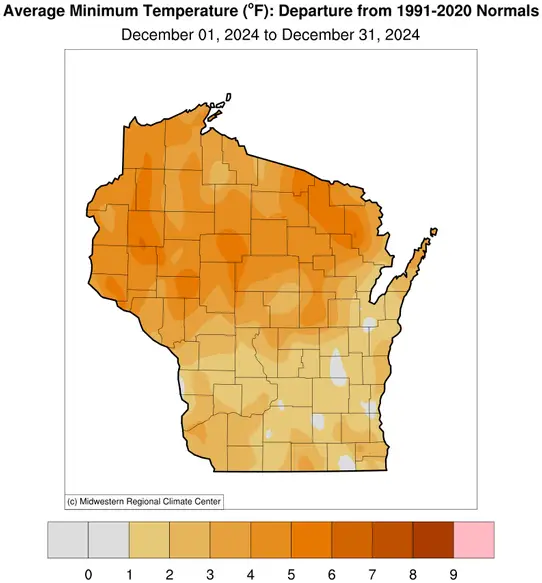
Maximum temperatures averaged 1.6 degrees above normal, while minimum temperatures were particularly warm at 3.1 degrees above normal. A key factor was the lack of a deep snowpack, which typically reflects sunlight and promotes rapid cooling after sunset. Without snow cover, the ground absorbed and released more heat, keeping overnight temperatures elevated.
Lake Ice Uncertainty
Winter thus far has also been a rollercoaster for Madison-area lake ice. Determining when the lakes officially “close” or “open” is guided by tradition and specific vantage points. The process remains somewhat subjective, with the general rule that a lake must remain ice-covered for at least 24 hours before being officially declared “frozen.”
This season, Lake Mendota proved particularly troublesome, with an unusual brief freeze-over on Christmas Day that melted just two days later (Table 1). Stretches of mild weather and sustained winds kept the lake mostly open until it finally froze on January 7. Lake Monona also experienced multiple freeze-thaw cycles, freezing and opening twice in the second half of December before freezing again for a third time on January 5.
| Mendota | Monona | Wingra | |
|---|---|---|---|
| Date lake froze | December 25 January 7 |
December 13 December 22 January 5 |
December 1 |
| Date lake opened | December 27 | December 17 December 28 |
N/A |
Meanwhile, Lake Wingra had a more typical start to the season, freezing on December 1 and remaining ice-covered. For more information about Madison’s lake ice records, check out the State Climatology Office’s Madison Lake Ice page.
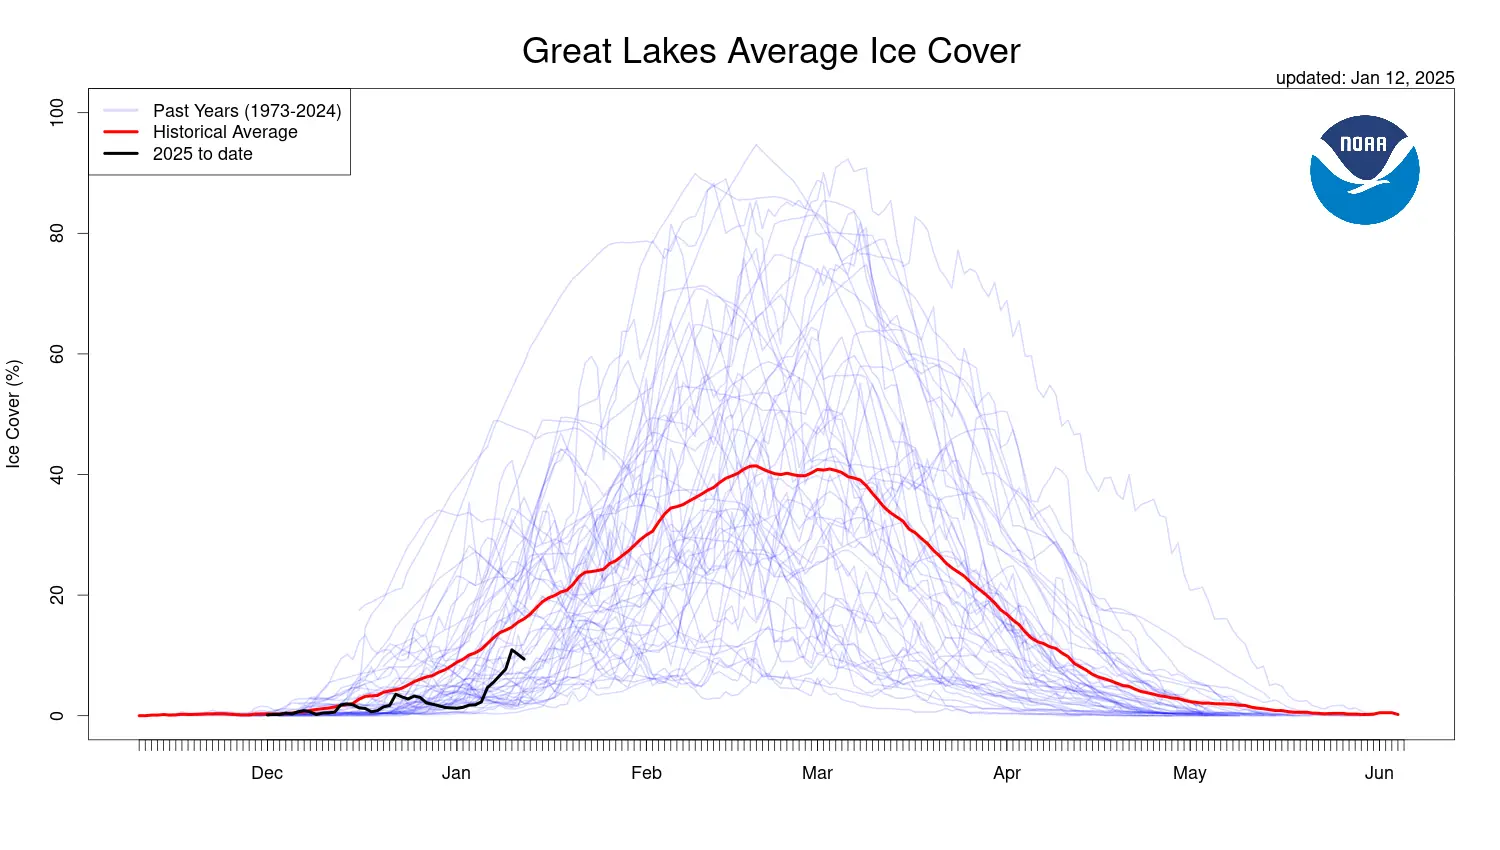
The Great Lakes experienced similarly inconsistent ice development this December, with below-average ice cover persisting through much of the month. An animation of the Great Lakes surface, provided by NOAA’s CoastWatch and the Great Lakes Environmental Research Laboratory, shows fluctuating ice concentrations through December, as cold snaps were offset by periods of warmth and wind. All five of the Great Lakes lagged in ice formation compared to historical averages, and by December 31, total ice cover was still well below the seasonal norm (Figure 8).
Unusually Foggy
December was marked by an unusually high number of foggy days across Wisconsin. Typically, most of the state experiences no more than three days of thick fog during the month, based on 50-year averages. However, three to four times more foggy days than usual occurred this December, with the exception of Green Bay, which generally has more fog than other areas.
Far northern Wisconsin was one of the areas that experienced dense fog on multiple occasions over the month, causing visibility to plummet below a quarter mile. In these areas, the fog was not just a visibility issue. It also led to freezing fog, which created hazardous icy conditions on roads and sidewalks, making travel risky, and led to the deposition of hoar frost (crystals formed directly from water vapor) on free-standing objects.
Persistent Dryness
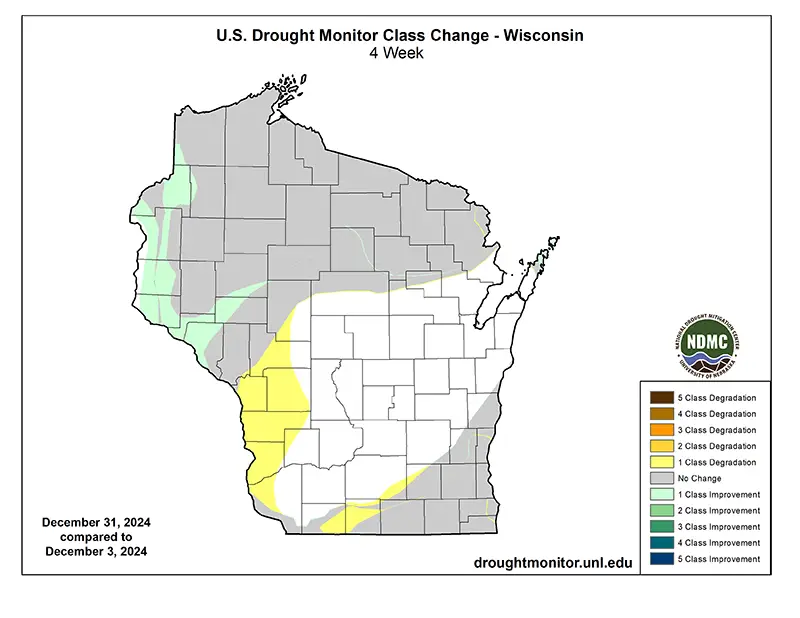
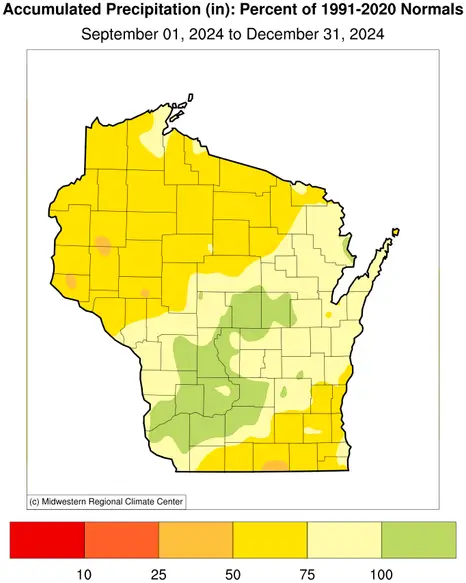
While drought typically is not top-of-mind during the winter, northern and southern Wisconsin remained in abnormally dry to moderate drought conditions (Figure 9), stemming from dryness dating back to September (Figure 10). December and winter in general, being Wisconsin’s driest season, tend to offer little opportunity for drought improvement.
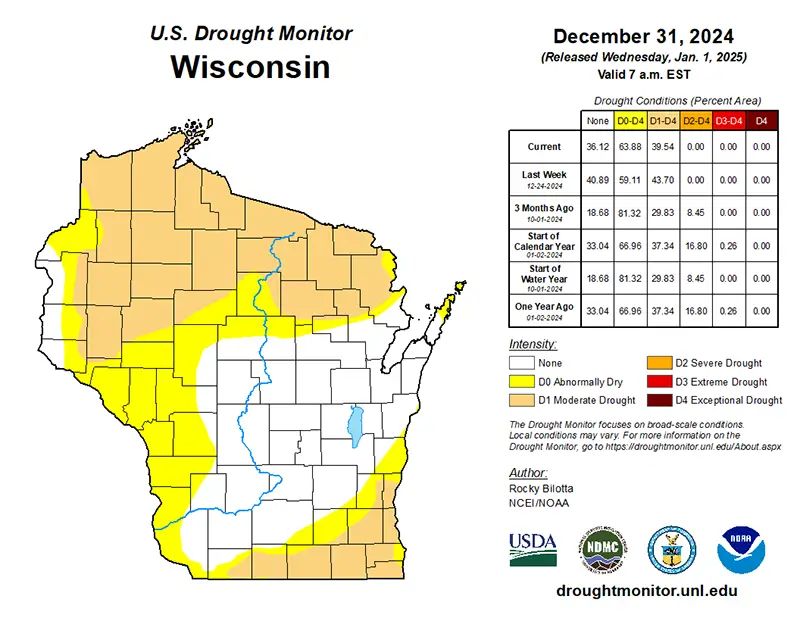
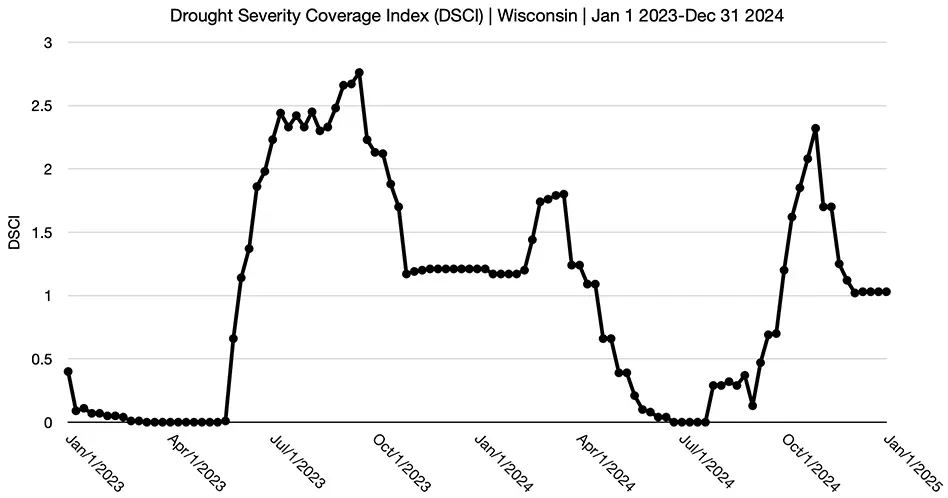
As a result, the Drought Severity Coverage Index remained consistent throughout the month (Figure 11). However, rainfall and snow melt during the month, though insufficient to fully resolve the drought, offered some replenishment to the lingering moisture deficits.
Outlook
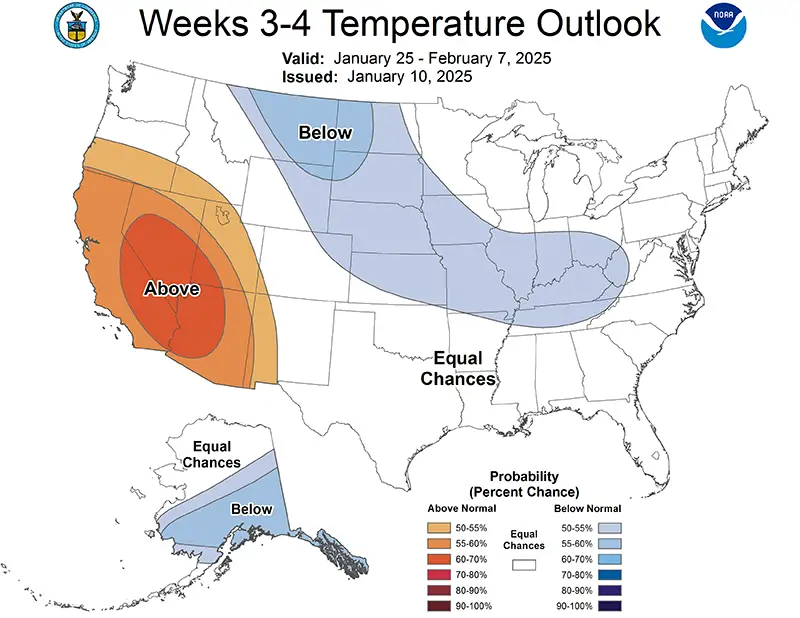
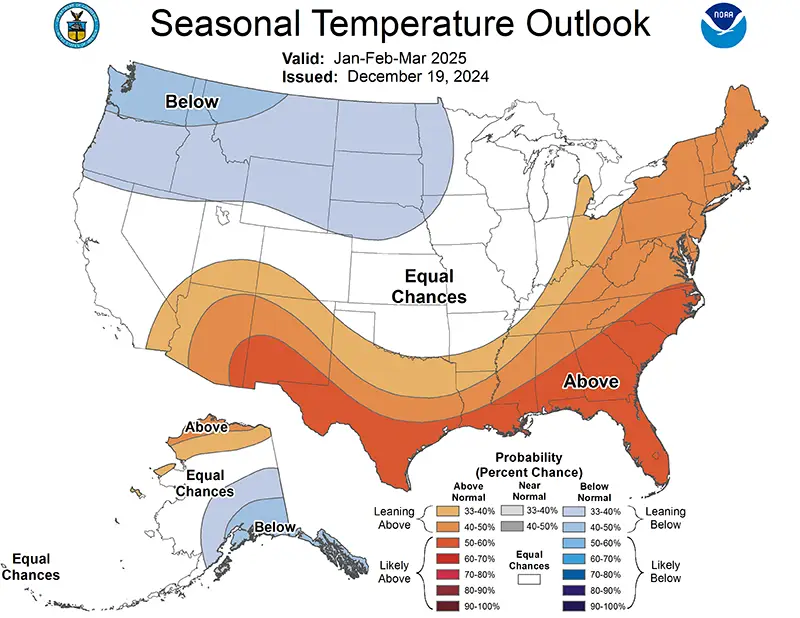
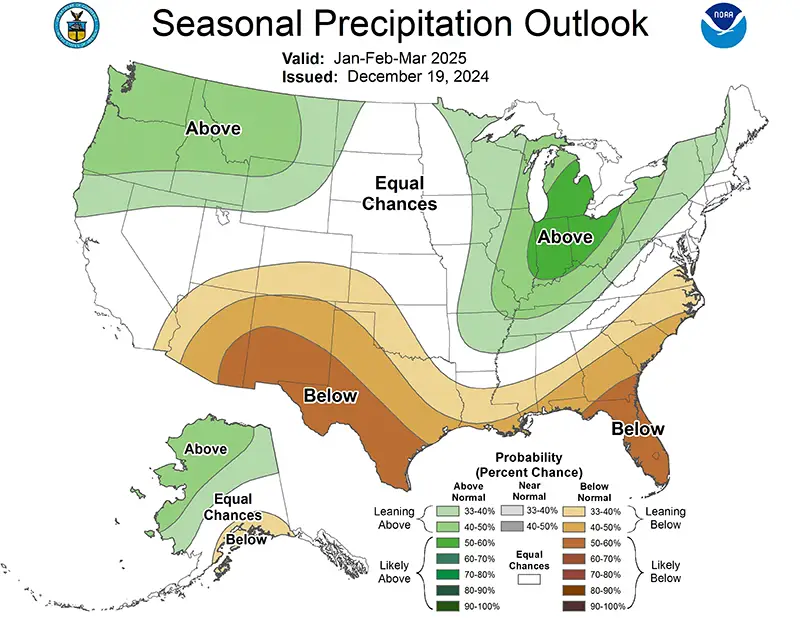
As we transition into February, the forecast reveals a modest tendency toward above-normal temperature and precipitation, according to the Climate Prediction Center’s outlooks (Figure 12). Between February and April, the temperature projection shows uncertainty, with equal chances for above, near, or below-normal temperatures.
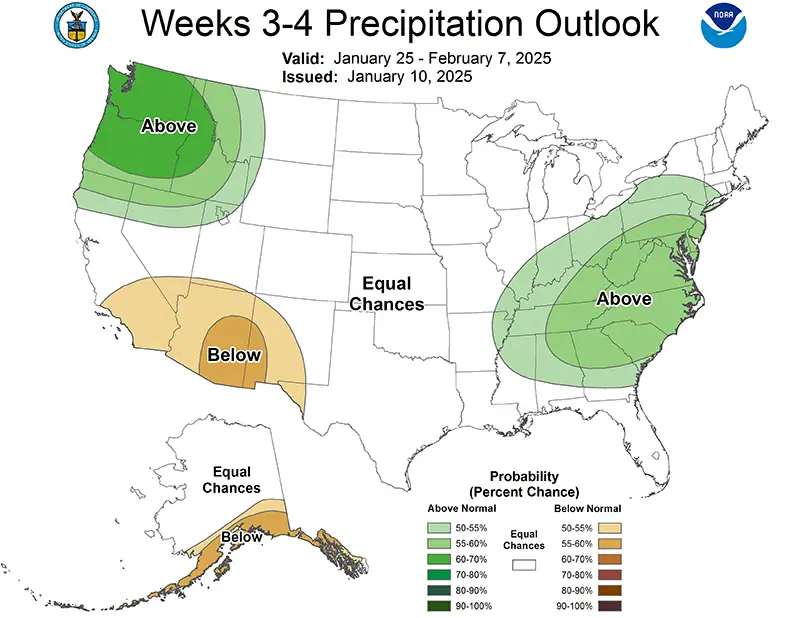
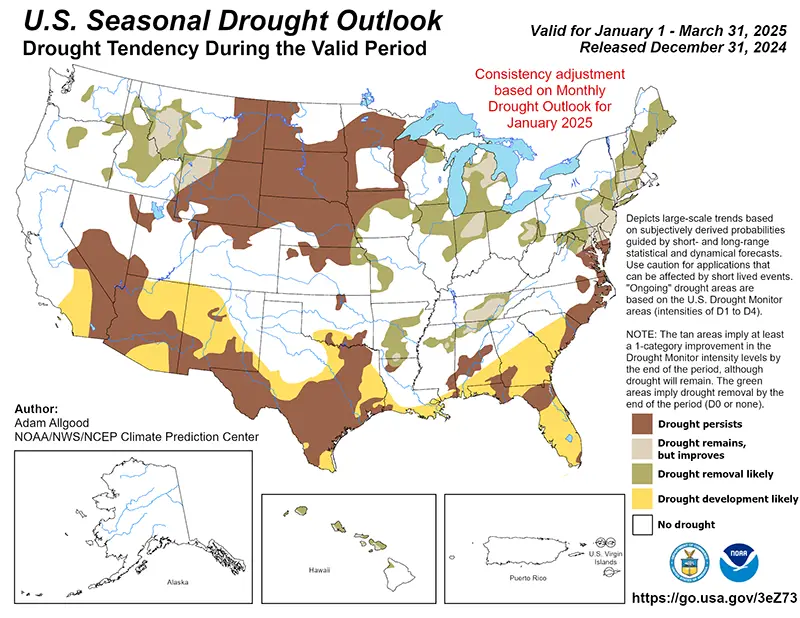
However, there is a slight lean toward above-normal precipitation (Figure 13). These trends resemble what is common during a La Niña winter, which officially took hold in December. While winter’s typically dry conditions make drought relief challenging, there is hope that if Wisconsin experiences above-normal precipitation, some drought recovery could be within reach (Figure 14).
Climate Corner
Q: Do the Packers have an extra home-field advantage in cold weather?
A: An important piece of Packers’ lore is the legendary 1967 “Ice Bowl” game played at Green Bay in brutal cold (air temperature of minus 13 degrees and a wind chill of minus 36 degrees). The Packers’ victory that day propelled them to their second consecutive Super Bowl and helped to burnish their reputation for thriving in the cold.
In addition, Green Bay has the coldest climate during the football season of any NFL team without a domed stadium, so its players are accustomed to chilly conditions. But do the Packers really flourish in cold weather?
To find out, the State Climatology Office computed the Packers’ winning percentage in all home games starting in 1957 (the team’s first year at Lambeau Field) until 2023 as a function of gametime temperature. Our findings paint a nuanced picture to the question. Figure 15 shows that the Green and Gold have been very successful in home games no matter the temperature, winning 66 percent of all contests.
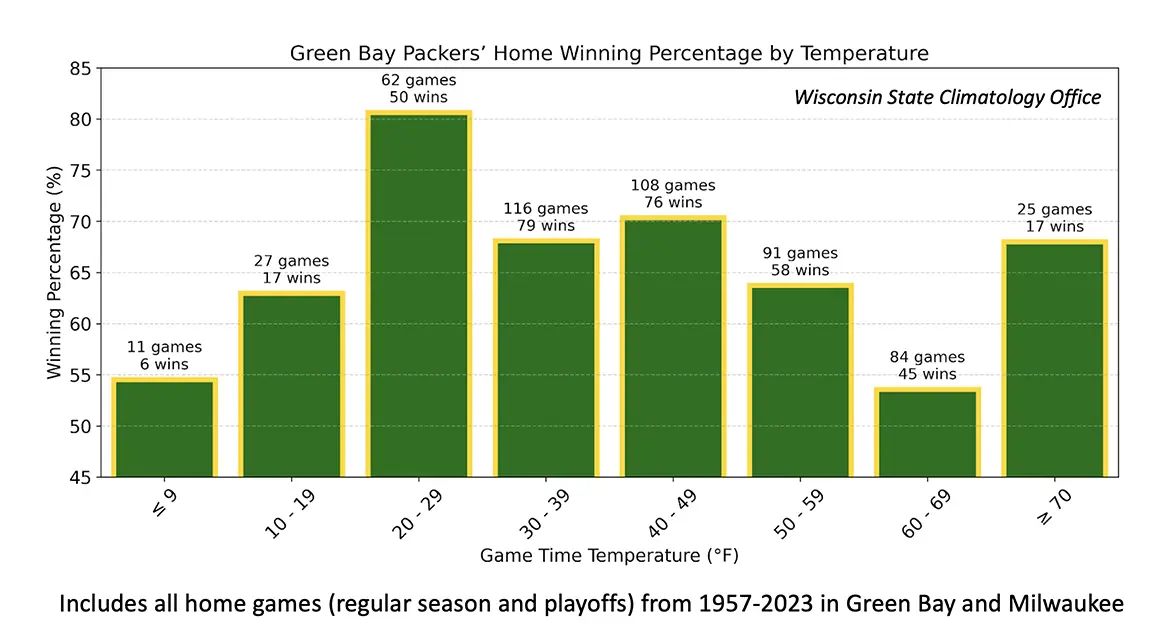
But the Packers have especially thrived in the cold, winning at a remarkable 81 percent clip in home games played when temperatures are in the 20s. On the other hand, their winning percentage has actually dropped amidst even colder conditions (below 20 degrees), like those of the Ice Bowl, So, it appears that the optimal weather for our Packers is “cold but not too cold.”
Steve Vavrus is the Wisconsin state climatologist. Bridgette Mason and Ed Hopkins are the assistant state climatologists.