Key Takeaways
- Research indicates an increase in the days favorable for hail in the Midwest by 2-4 days per year since the late 1970s.
- Future climate projections suggests an earlier start to the hail season, with a slight increase in large hail
(>1 inch) frequency. - Most states have their largest fraction of annual severe hail reports in May, June, or July. The monthly fraction of annual hail reports has not changed much since the 1960s.
- Around 10 percent of crop acres in the Great Plains experience hail damage, with the percentage decreasing eastward.
- Hail-damaged corn and soybeans can recover from less-severe hail damage, but in the case of total loss, replanting or cover crops can become viable options. Make sure to first discuss your plans and options with your crop insurance agent.
- Hail-damaged fruits and vegetables may still be viable but become less marketable due to the damage.
- Protection structures like wire caging, hail netting, or hoop houses are options for fruit and vegetable producers to shield their crops from hail damage.
Research Synthesis
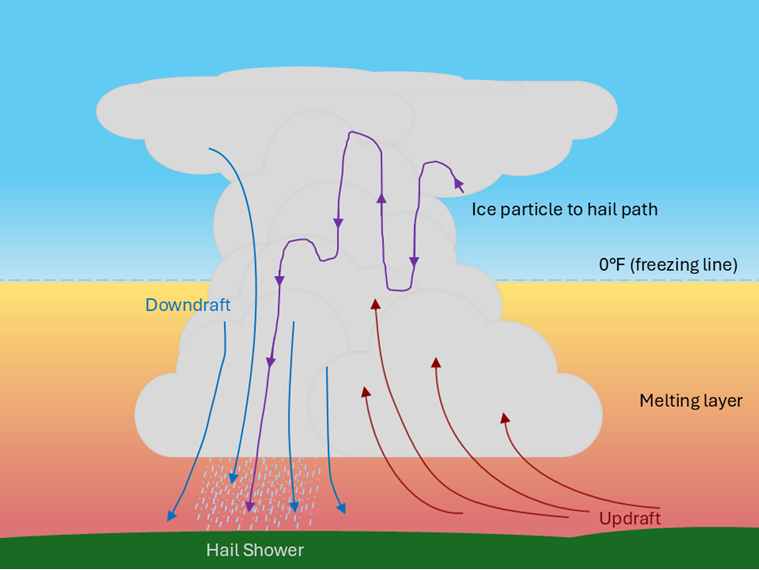
Hail is common in the Midwest and Great Plains regions during the growing season, where crop losses amount to approximately 5 percent of crop value annually1. Hail ranges from 1/4 inch (pea-sized) to 2 inch (golf-ball—sized), though larger hail can occur. The figure below shows hail formation in a cumulonimbus thunderstorm cloud. Hail stones form in convective clouds with strong updrafts and high moisture content. An ice particle can remain suspended by the updraft, allowing it to collide multiple times with liquid water droplets (growing in size) before falling to the surface when the stone either moves out of the updraft or is no longer supported by the updraft.
Assessing the climatology of hail is difficult largely because the reporting of hail has been inconsistent. To remedy this, researchers analyze atmospheric conditions that favor hail formation. From 1979 to 2017, there was an increase in favorable large hail environments by 2-4 days in the Midwest2. Hail research commonly focuses on hail environments in the high-emission future climate scenario (SSP5-8.5). These studies find that by the end of the century, the hail season may begin earlier in the year, with a possible decrease in smaller hail (due an increase in melting aloft) and a slight increase in the frequency of large hail (>1 inch)3,4.
Hail Seasonality
In the Midwest and Great Plains, the occurrence of hail varies from season to season, as well as regionally. Using hail report data from the National Center for Environmental Information (NCEI) Storm Events Database, we can determine the average “monthly hail fraction”, or the percentage of annual hail reports that occur in a given month.
The results of this analysis (shown in the figure on the right) indicate that states in the lower Midwest, such as Missouri and Illinois, see their highest monthly hail fractions during April and May. However, once we get into June, July, and August, northern states such as Wisconsin, Minnesota, and the Northern Plains have higher monthly hail fractions than their neighbors to the south. The majority of the states have their highest monthly hail fraction in either May, June, or July.
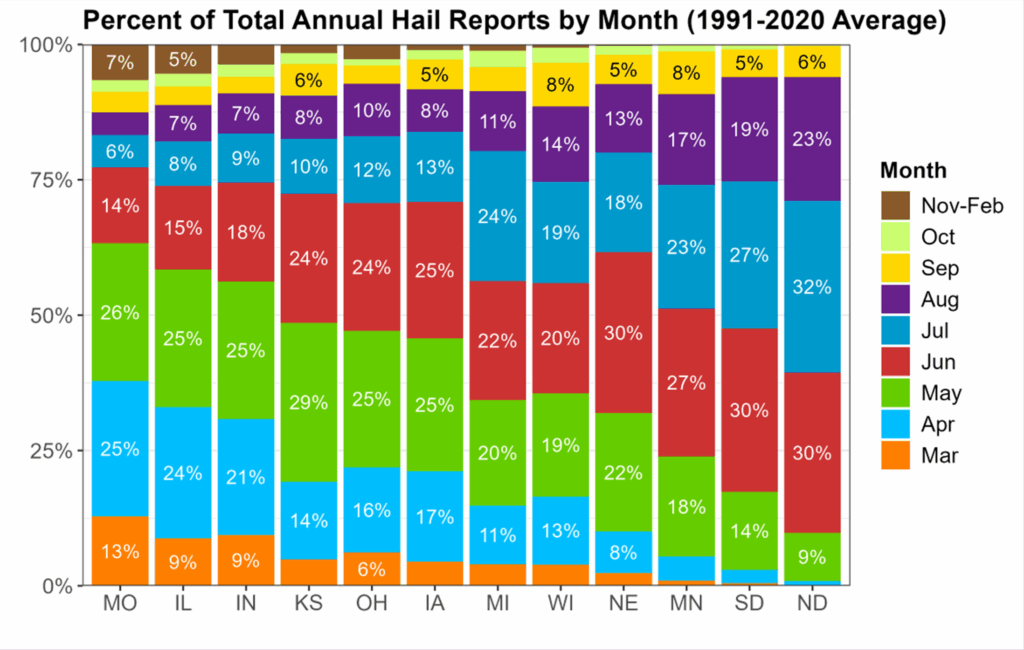
The monthly average hail fraction from the 1991-2020 period (our most recent 30-year climatological period) was compared to the average hail fraction from 1961-1990 (an earlier climatological period). When averaged across all states, monthly hail fraction (not shown) has slightly increased during April and May, decreased in June and July, and increased from August through November. However, these changes are minimal (~2 percent or less) and are not statistically significant for most states.
Location of Hail Damage
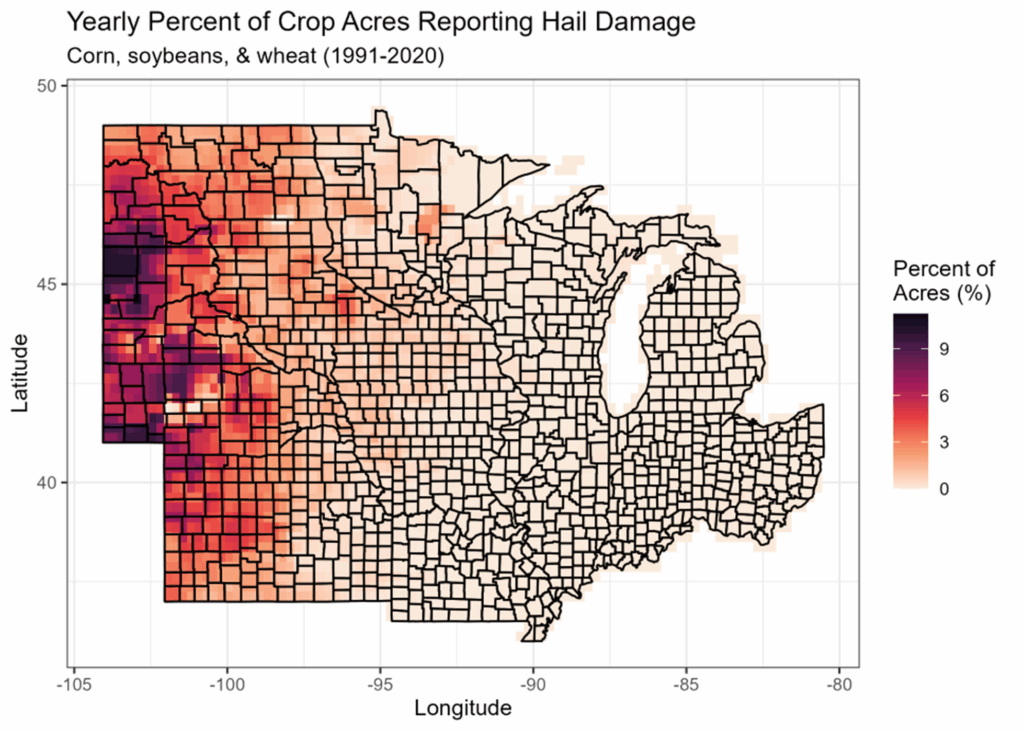
To achieve a spatial distribution of hail occurrence, county-level crop insurance data was gathered from the USDA Risk Management Agency (RMA) and county-level crop acreage data from USDA NASS for corn, soybean, and wheat. For each county, the 30-year average (1991-2020) of hail claim acreage and total crop acreage was calculated to determine the average percentage of corn, soybean, and wheat cropland that reports a hail damage claim each year (see map below).
The spatial pattern in the percentage of cropland which reports hail damage claims has a strong west to east gradient. The maximum annual hail damage is in the southern Nebraska Panhandle (heavy wheat area) and western South Dakota at around 10 percent with declining values moving eastward.
Due to uncertainties in how crop insurance has changed across the region over the years (payment rates and amount of acres enrolled), it is not feasible to use the RMA data to assess changes in hail damage to crops over time. Crop insurance data may also not fully capture crop hail damage if a claim was not filed or the field/crop was not covered by insurance.
How to Assess, Manage, & Mitigate Hail Damage
CORN, SOYBEANS, & WHEAT
When making decisions on how to move forward after a hail event, make sure to first discuss your plans and options with your crop insurance agent. Plants can recover from hail damage up to a point. Whether fields can recover from damages or are a total loss, there are several options to consider:
- Replanting is an option when fields are a total loss early in the season, but be sure to contact your seed suppliers as soon as possible to confirm seed availability.
- Chopping damaged crops as livestock feed could be a viable option, but account for reduced feed nutrient values and forage utilization intervals for applied pesticides.
- Cover crops seeded in areas of severe damage can be hayed/chopped, grazed, or simply left in the field to provide soil health gains.
- In hail-damaged fields, stay on top of weed and insect issues as hail damage can increase susceptibility to certain weeds and insects. Plants that survive but have damage are also more susceptible to bacterial infection, which fungicides will NOT help with.
- Wheat streak mosaic virus is a major concern in the subsequent year if the hail occurs in the 2-3 weeks prior to harvest.
FRUITS & VEGETABLES
For fruit trees and small-scale vegetable plots, there are options for hail protection structures:
- Wire caging or hail netting are viable options to keep smaller vegetable plots protected.
- Permanent structures, like hoop houses with metal framing.
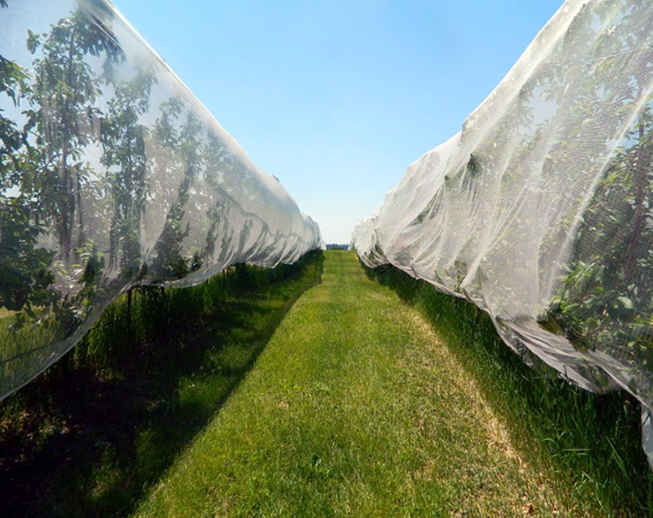
- Hail netting draped over fruit trees or suspended overhead of the trees (see image below).
- All such structures must be able to withstand the high winds that often come with hailstorms and should NOT restrict pollination.
Wounded fruit and vegetable crops are very susceptible to bacterial infection. For vegetables like tomatoes and peppers, it is better to remove the damaged fruits to allow non-damaged fruit to more-readily access nutrients. In fruit crops, sprays can be used to reduce the spread of disease or measures can be taken to protect highly-susceptible varieties from the disease spread from infected crops (e.g., fire blight in apples). More intense hailstorms can cause damage to the fruit tree itself, which is very important to treat promptly.
DAMAGE ASSESSMENT
There are several Midwestern extension resources that guide producers on how to assess and cope with hail damage to crops. See below for links, sorted by crop:
Corn & Soybeans: Nebraska, Minnesota (corn), Minnesota (soybean), Purdue, Iowa State, South Dakota State
Wheat: Nebraska
Alfalfa: Wisconsin
Fruit: Michigan State, Minnesota
Vegetables: South Dakota State, Iowa State
Authors
Josh Bendorf
Climate Outreach Specialist, Wisconsin State Climatology Office (jbendorf@wisc.edu)
Tayler Schillerberg
Former Ag-Climatologist, USDA Midwest Climate Hub
This publication is co-located on the University of Nebraska–Lincoln’s Hail Know website, maintained by the UNL CropWatch team.
Special thanks to experts from the USDA Midwest Climate Hub and the University of Nebraska-Lincoln for reviewing this publication.
References
1 McMurdie, W. L., & Houze, R. A. (2006). 8 – Weather Systems. In J. M. Wallace & P. V Hobbs (Eds.), Atmospheric Science (Second Edition) (pp. 313–373). Academic Press. https://doi.org/10.1016/B978-0-12-732951-2.50013-2
2 Tang, B. H., Gensini, V. A., & Homeyer, C. R. (2019). Trends in United States large hail environments and observations. Npj Climate and Atmospheric Science, 2(1), 45. https://doi.org/10.1038/s41612-019-0103-7
3 Trapp, R. J., Hoogewind, K. A., & Lasher-Trapp, S. (2019). Future Changes in Hail Occurrence in the United States Determined through Convection-Permitting Dynamical Downscaling. Journal of Climate, 32(17), 5493–5509. https://doi.org/10.1175/JCLI-D-18-0740.1
4 Brimelow, J. C., Burrows, W. R., & Hanesiak, J. M. (2017). The changing hail threat over North America in response to anthropogenic climate change. Nature Climate Change, 7(7), 516–522. https://doi.org/10.1038/nclimate3321