The beginning of 2025 was filled with stark temperature contrasts, exceptional dryness, and below-normal snowfall.
Deep Freeze to Spring Tease
January’s temperatures might have averaged near normal, but the month had its share of variability. The statewide average of 14.2 degrees was just 1.1 degrees below the 1991 to 2020 normal, with about half of the state hugging the average and the other half running slightly below normal (one to three degrees below), such as in north-central and southeastern Wisconsin (Figure 1).

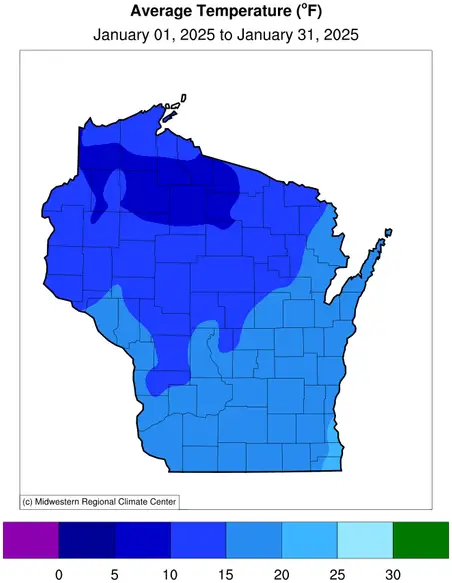
But beneath that statewide January average lay a month of temperature swings. Mid-January delivered a bitter cold blast, bottoming out at minus 32 degrees in Butternut (Ashland County) on January 20 — the state’s lowest temperature this winter to date. The deep freeze between January 19 and 22 prompted Wisconsin’s first Extreme Cold Warning under the National Weather Service’s revised advisory system, with wind chills plunging to minus 47 degrees in Rhinelander and minus 26 degrees in Racine. This cold wave stretched far beyond Wisconsin, triggering winter storm warnings extending to the Gulf and Atlantic coasts.
Then, in true Midwestern fashion, late January brought record-breaking warmth. Several locations set new daily high records, with Boscobel (Grant County) being the warmest spot in the state on January 30 at 61 degrees (Figure 2). La Crosse broke its all-time January record, reaching 58 degrees – surpassing the previous record of 57 degrees from 1944. Madison fell just one degree shy of its all-time January record of 58 degrees set in 1880.

Precipitation Starved
Wisconsin experienced one of its driest starts to any year. The state averaged just 0.23 inches of precipitation (rain plus melted snowfall), making it the third driest January since records began in 1895: only 1981 (0.13 inches) and 1961 (0.18 inches) were drier. Several locations, including Madison, Milwaukee, and La Crosse, marked new records for their driest January on record (Table 1).
| Location |
January 1-31 precipitation (inches) |
Dryness ranking |
|---|---|---|
| Madison |
0.10 |
1 (tied with 1903) |
| Milwaukee |
0.14 |
1 |
| La Crosse |
0.03 |
1 |
| Green Bay |
0.15 |
2 |
| Wausau |
0.34 |
9 |
| Eau Claire |
0.28 |
12 |
Southwestern Wisconsin bore the brunt of the dryness, receiving less than a tenth of an inch of precipitation — just 5 percent of its normal monthly total (Figure 3). Meanwhile, northern Wisconsin fared slightly better, though still well below normal. The lucky few included Birnamwood (Shawano County) with 1.05 inches, Bayfield (Bayfield County) with 1.03 inches, and Hurley (Iron County) with 0.97 inches – modest amounts, but enough to stand out in a month starved for moisture.


Snow No-Show
Snowfall in January was just as disappointing as precipitation, with much of Wisconsin seeing only a fraction of its normal totals. Snow deficits ranged from 5 to 15 inches statewide, with northern Wisconsin receiving 25 to 75 percent of normal snowfall, while the rest of the state struggled with less than 25 percent of normal (Figure 4).


In La Crosse, the lack of snow was record-breaking — just 0.6 inches fell all month, the lowest January total on record — and several other locations came very close to setting new lows (Table 2).
| Location |
Jan 1-31 snowfall (inches) |
Dryness ranking |
|---|---|---|
| La Crosse |
0.6 |
1 |
| Madison |
1.9 |
7 |
| Green Bay |
2.9 |
7 |
| Milwaukee |
3.1 |
13 |
| Wausau |
6.2 |
19 |
| Eau Claire |
5.4 |
36 |
Remarkably, some Gulf Coast locations recorded higher single-day snowfall totals than Wisconsin has so far this year. Pensacola, Florida, saw 10 inches on January 21, while Chalmette, Louisiana, reported 11.5 inches on January 22. Meanwhile, Wisconsin’s highest single-day snowfall so far in 2025 was a mere seven inches in Superior (Douglas County) on January 9.
To rub salt in the wound, those Gulf Coast snowfall totals rival what some Wisconsin cities have accumulated all season — Madison only saw 8.6 inches from December 1 to January 31, La Crosse and Milwaukee 8.8 inches, Green Bay 10.3 inches, Eau Claire 11.3 inches, and Wausau 11.8 inches.
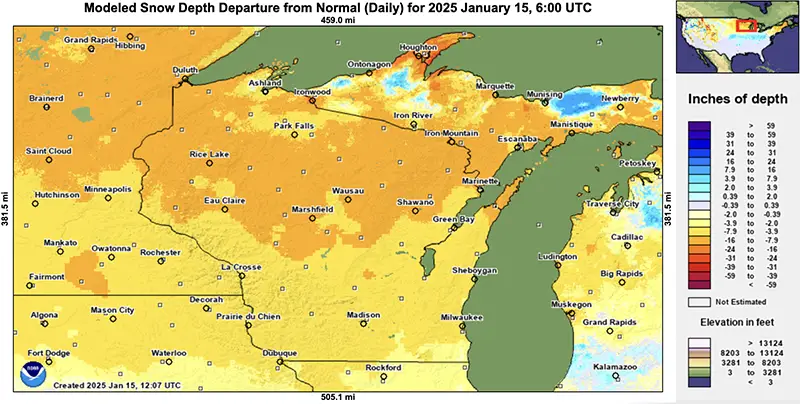
January’s snow depth mirrored December’s lackluster performance (Figure 5). Aside from a few fleeting dustings, the southern half of the state remained mostly bare all month. Northern Wisconsin held onto its snowpack longer, but deficits across the state were still staggering — 8 to 16 inches below normal in the north and four to eight inches below normal in the south.


Finally Frozen
Lakes Monona and Mendota in Madison struggled to freeze this winter, but a stretch of chilly temperatures at the beginning of the year finally led to ice formation on January 5 for Monona and January 7 for Mendota. Historically, these dates fall among the latest 10 percent of recorded ice-on dates. However, our State Climatology Office’s very own “Ice Man,” Ed Hopkins, describes how a majority of Madison-area ice-on dates this century have occurred in January. Since freezing over, all three Madison-area lakes (Mendota, Monona, and Wingra) have remained covered.
Ice thickness on Mendota – measured about 100 yards from the Edgewater pier – reached 12 to 14 inches by late January, reported by Clean Lakes Alliance. Interestingly, early in the week of January 20, ice quakes were felt and heard around Madison’s isthmus as rapid drops in temperatures and minimal snow cover on the lakes caused the lake ice to contract and crack, leading to tremors and loud booms.
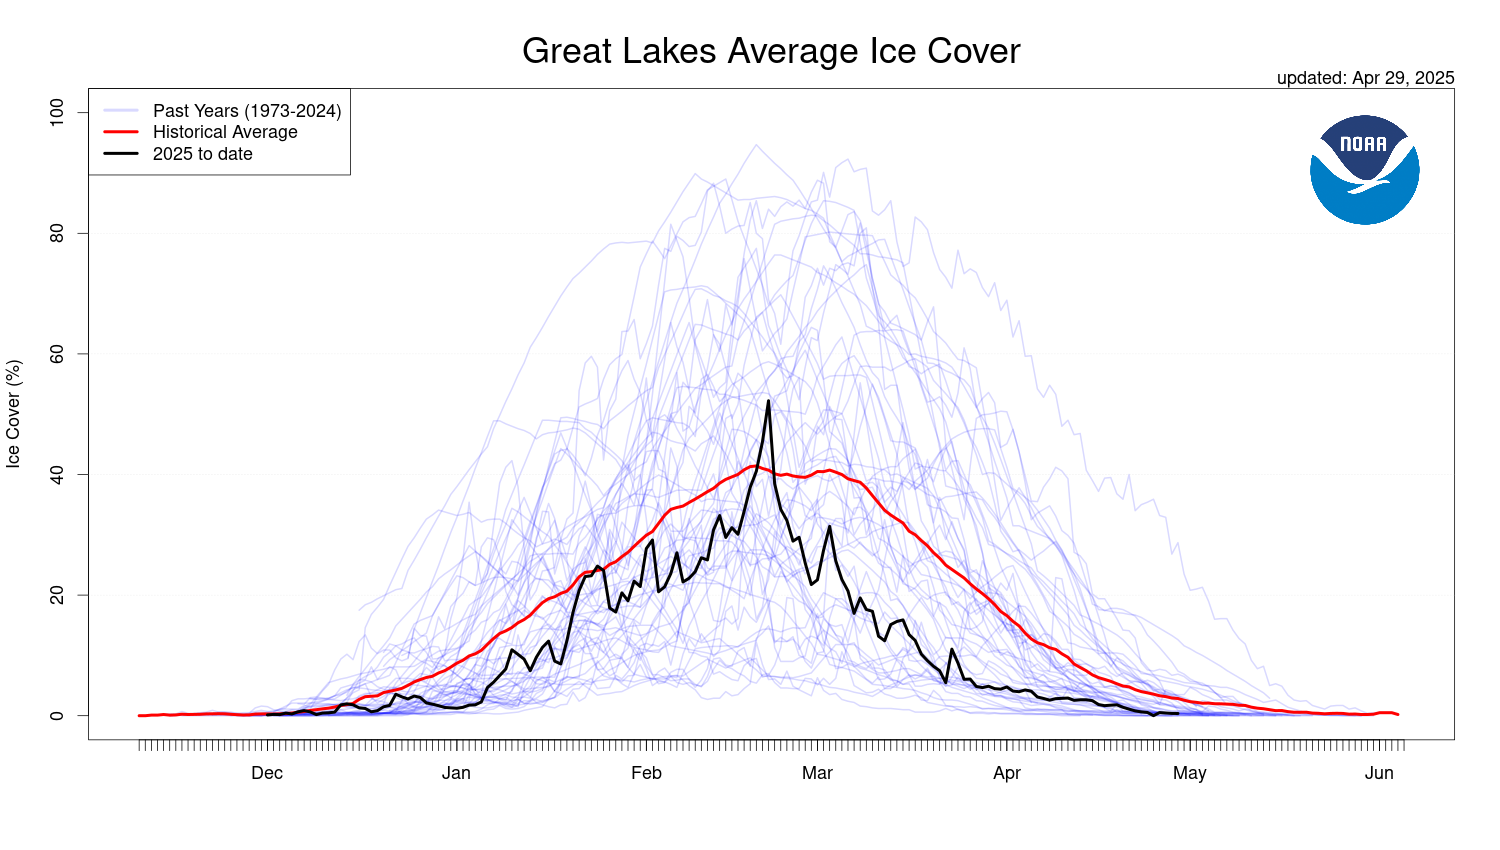
Great Lakes ice cover saw a sharp increase during the early and mid-January cold waves, particularly on Lake Erie, which can be seen from this animation provided by NOAA’s CoastWatch and the Great Lakes Environmental Research Laboratory. However, aside from these surges, overall ice cover on the Great Lakes remained below normal for most of the month.
Frost Digs Deep
With little to no insulating snowpack and seasonably cold temperatures, frost has been driven deep into the ground this winter — far deeper than last year (Table 3). Frost depths increased steadily throughout January, and by early February, frost had reached significant levels. In Durand (Pepin County), frost plunged to 31 inches, a stark contrast to last winter when the ground remained frost-free through most of the winter. Land O’ Lakes (Vilas County) also saw a substantial increase, with frost reaching 20 inches deep compared to just eight inches in early February 2024.
| Location (County) |
Frost depth on February 5, 2024 (inches) |
Frost depth on February 5, 2025 (inches) |
|---|---|---|
| Durand (Pepin) |
0 |
31 |
| La Crosse (La Crosse) |
0 |
16 |
| Watertown (Jefferson) |
0 |
18 |
| Mukwonago (Waukesha) |
0 |
27 |
| Marshfield (Wood) |
4 |
17 |
| Bloomer (Chippewa) |
8 |
28 |
| Land O’ Lakes (Vilas) |
8 |
20 |
| Merrill (Lincoln) |
9 |
31 |
| Plover (Portage) |
15 |
36 |
| Roberts (St. Croix) |
16 |
24 |
| Florence (Florence) |
21 |
33 |
Lingering Drought and Wildfire Activity
Conditions ranging from abnormally dry to moderate drought persisted across southeastern and northern Wisconsin throughout January due to both recent and long-term precipitation deficits (Figure 6). Because winter is typically the driest season in Wisconsin, drought relief is especially challenging during these months.


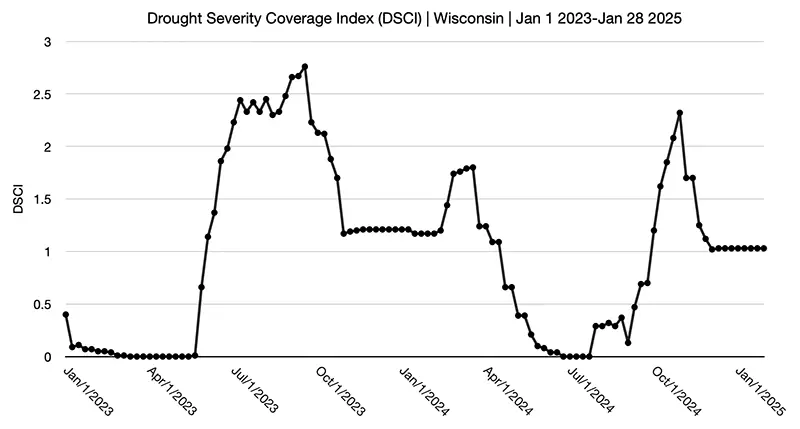
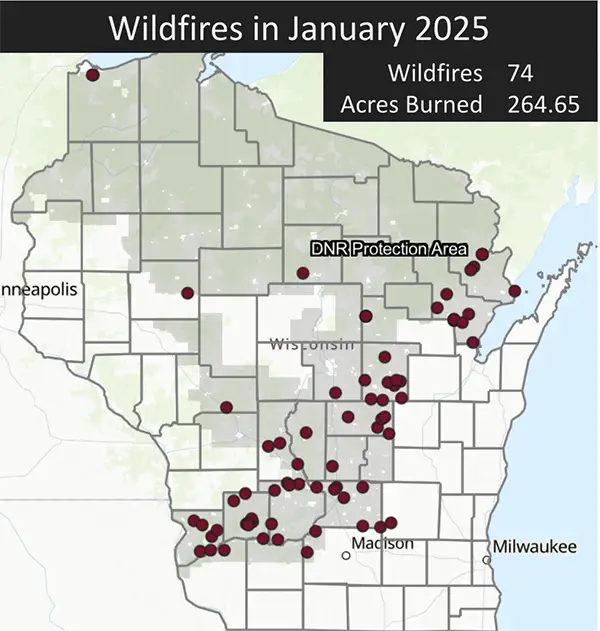
As a result, no changes in drought status were observed over the entire month, as reflected by the consistent Drought Severity Coverage Index (Figure 7). The combination of dry, windy conditions and minimal snow cover not only sustained drought but also created the perfect storm for wildfires. In January, 74 wildfires ignited, scorching 264 acres — an unusually high number for mid-winter (Figure 8).
Outlook
As we enter March, there are equal chances for above-, near-, or below-normal temperatures and precipitation (Figure 9). Looking further into March, April, and May, the pattern suggests a slight tendency toward above-normal precipitation, while temperature trends remain uncertain (Figure 10). With the possibility of wetter-than-normal conditions ahead, drought improvement could be on the horizon (Figure 11). However, near-term relief may be elusive, as February and March are historically among Wisconsin’s driest months.


Climate Corner
What is wind chill? Why don’t we see that term as much anymore?
Wind chill reflects the perceived temperature due to wind-driven heat loss from exposed skin, calculated by the National Weather Service (NWS) using a standardized equation introduced in 2001. It is based on sustained winds averaged over two minutes rather than gusts.
The coldest winter wind chills typically occur in January, particularly in western Wisconsin, where temperatures drop lower, and winds are stronger due to the region’s open terrain and reduced vegetation. Wisconsin’s lowest recorded wind chill of minus 60 degrees occurred at Menomonie’s airport on January 30, 2019, surpassing the previous record of minus 59 degrees in Eau Claire on January 10, 1982.
Historical data reveals occasional episodes of long-duration, extreme wind chills. In January 1963, persistently low temperatures and frequent strong winds caused wind chills of minus 20 degrees or lower in Eau Claire for 40 percent of the month.
By contrast, one of Wisconsin’s coldest days on record occurred January 30, 1951, with record-breaking low temperatures, including in Eau Claire (minus 45 degrees), Wausau (minus 40 degrees), and Madison (minus 37 degrees), yet light winds kept wind chills only slightly below ambient air temperatures.
As part of Hazard Simplification efforts, the NWS updated its alert system: Wind Chill Watches and Warnings are now termed Extreme Cold Watches and Warnings, and Wind Chill Advisories have been renamed to Cold Weather Advisories.
A Cold Weather Advisory is issued when seasonably cold air, but not extremely cold air, is expected. An Extreme Cold Watch or Warning is issued when dangerously cold air, regardless of wind, is possible or expected, potentially leading to frostbite or hypothermia.
For example, an Extreme Cold Warning would be issued for anticipated wind chills reaching minus 30 degrees or below in southern and eastern Wisconsin or minus 35 degrees or lower for the northern and western regions. These updates emphasize that extreme cold is hazardous even without wind and help distinguish cold-based impacts from snow-related hazards.
Steve Vavrus is the Wisconsin state climatologist. Bridgette Mason and Ed Hopkins are the assistant state climatologists.