July in Wisconsin packed it all in — heat waves, record humidity, drenching rains, a near-constant rumble of storms, and a drought-free finish.
Bookended by Heat and Humidity
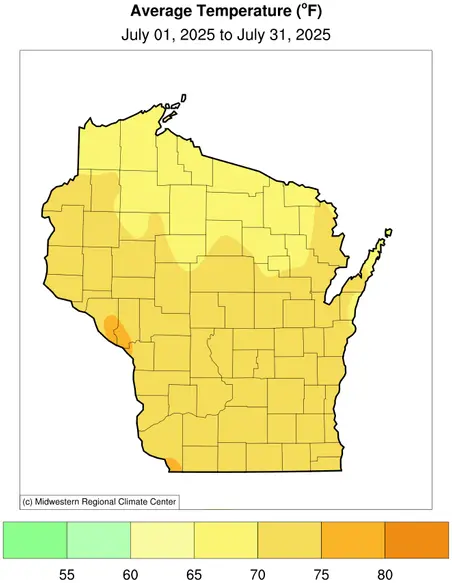
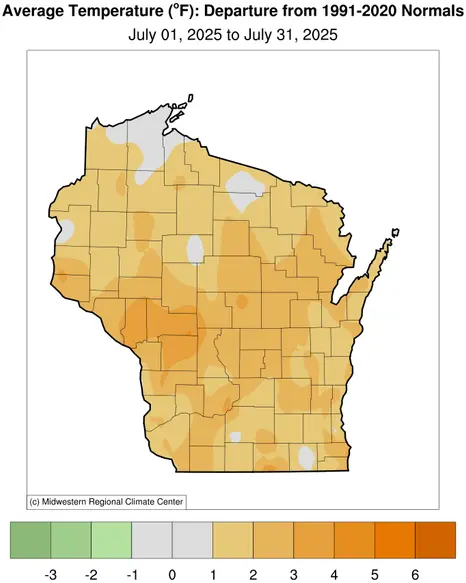
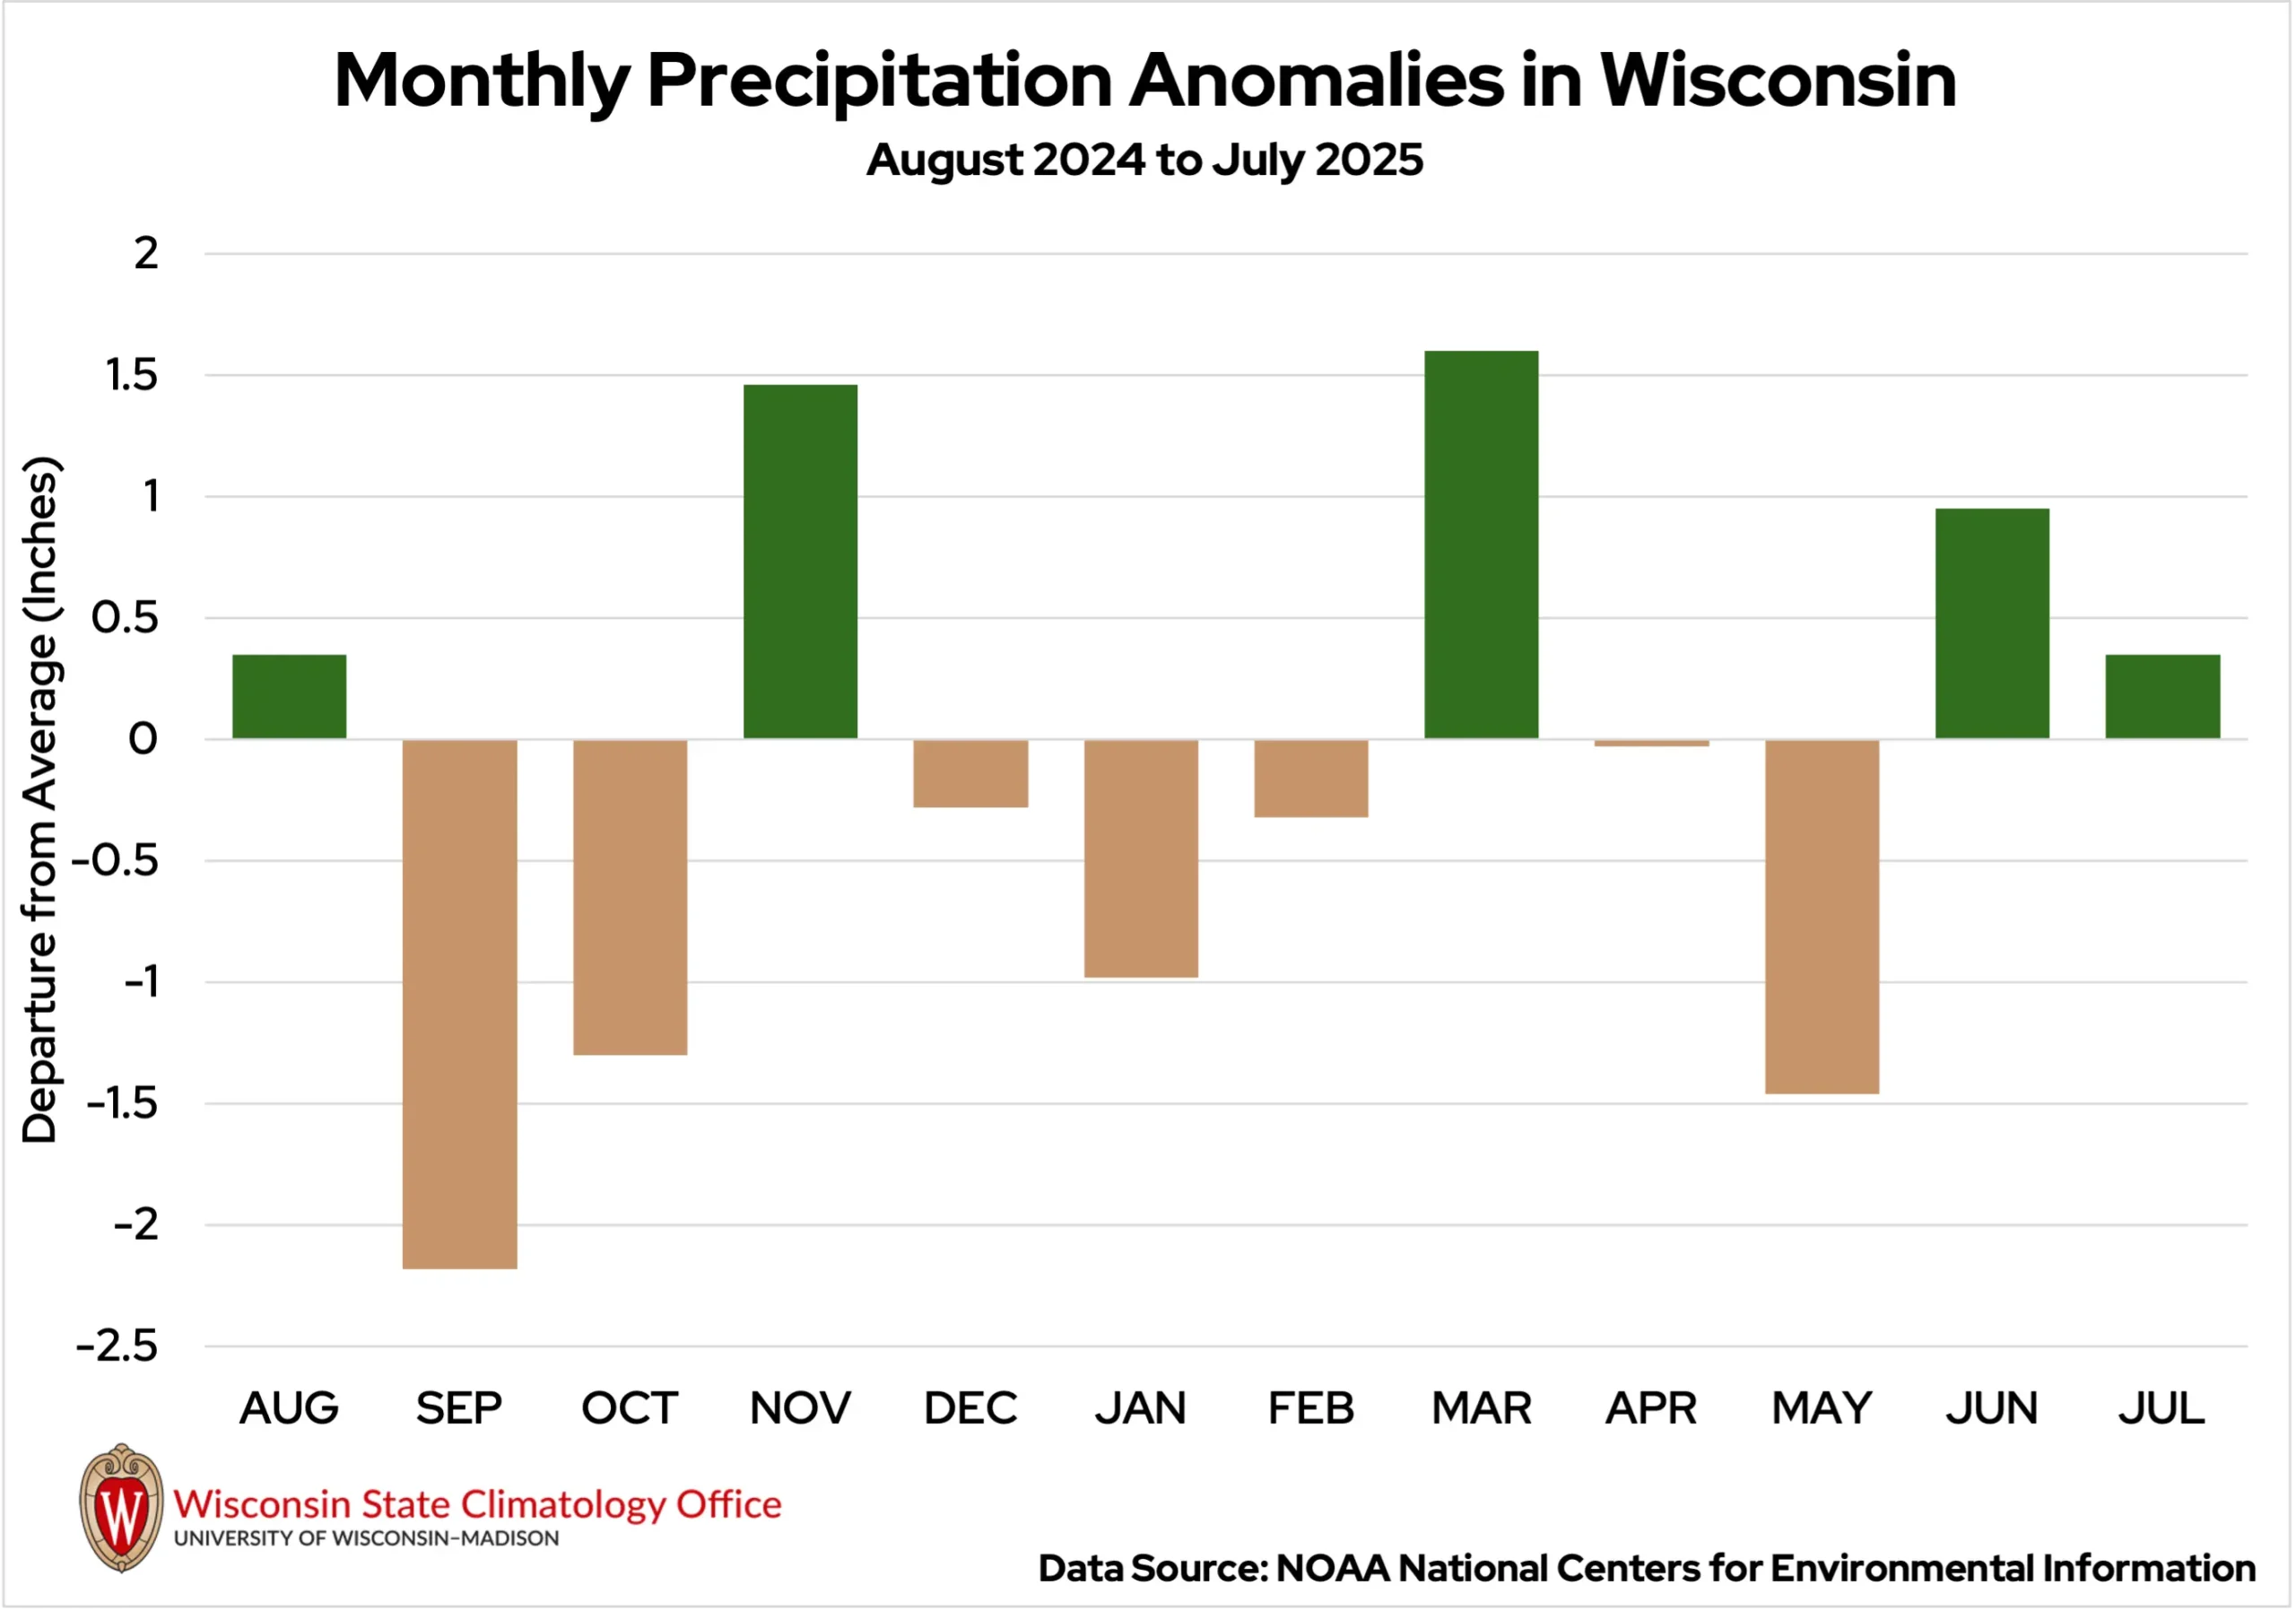
July is normally Wisconsin’s hottest month, and this July was no exception, with a statewide average temperature of 71.0 degrees (Fahrenheit) (Figure 1). Though about a third of the days in the month averaged below normal, the state’s average came out warmer than normal for the entire month by 1.8 degrees (Figure 2).
With high temperatures in the mid-80s and low-90s over the Fourth of July weekend (July 3 to 6), the average number of heat-related emergency department visits in Wisconsin increased by approximately 25 percent compared to the first two days of the month. A possible explanation for this increase could be that more people were outside during the holiday weekend. It’s important to note that heat-related illness data is likely an undercount due to many factors, including how emergency department visits are coded, under-reporting in workplaces, and the difficulty in attributing whether heat was a direct cause of the visit.
A well-earned cooldown was seen during the middle of the month, so much so that Hayward (Sawyer County) and Rice Lake (Barron County) dipped to 41 degrees on July 9 and 17, respectively. Forty-one degrees was also recorded on July 31 in Eagle River (Vilas County). These were the coldest temperatures in the state during the month.
However, the heat returned for the final days of the month. High temperatures soared into the 80s statewide, with some areas even reaching the 90s in southeastern Wisconsin. The hottest temperature recorded across the state for the entire month was 97 degrees on July 29 in Wausaukee (Marinette County).
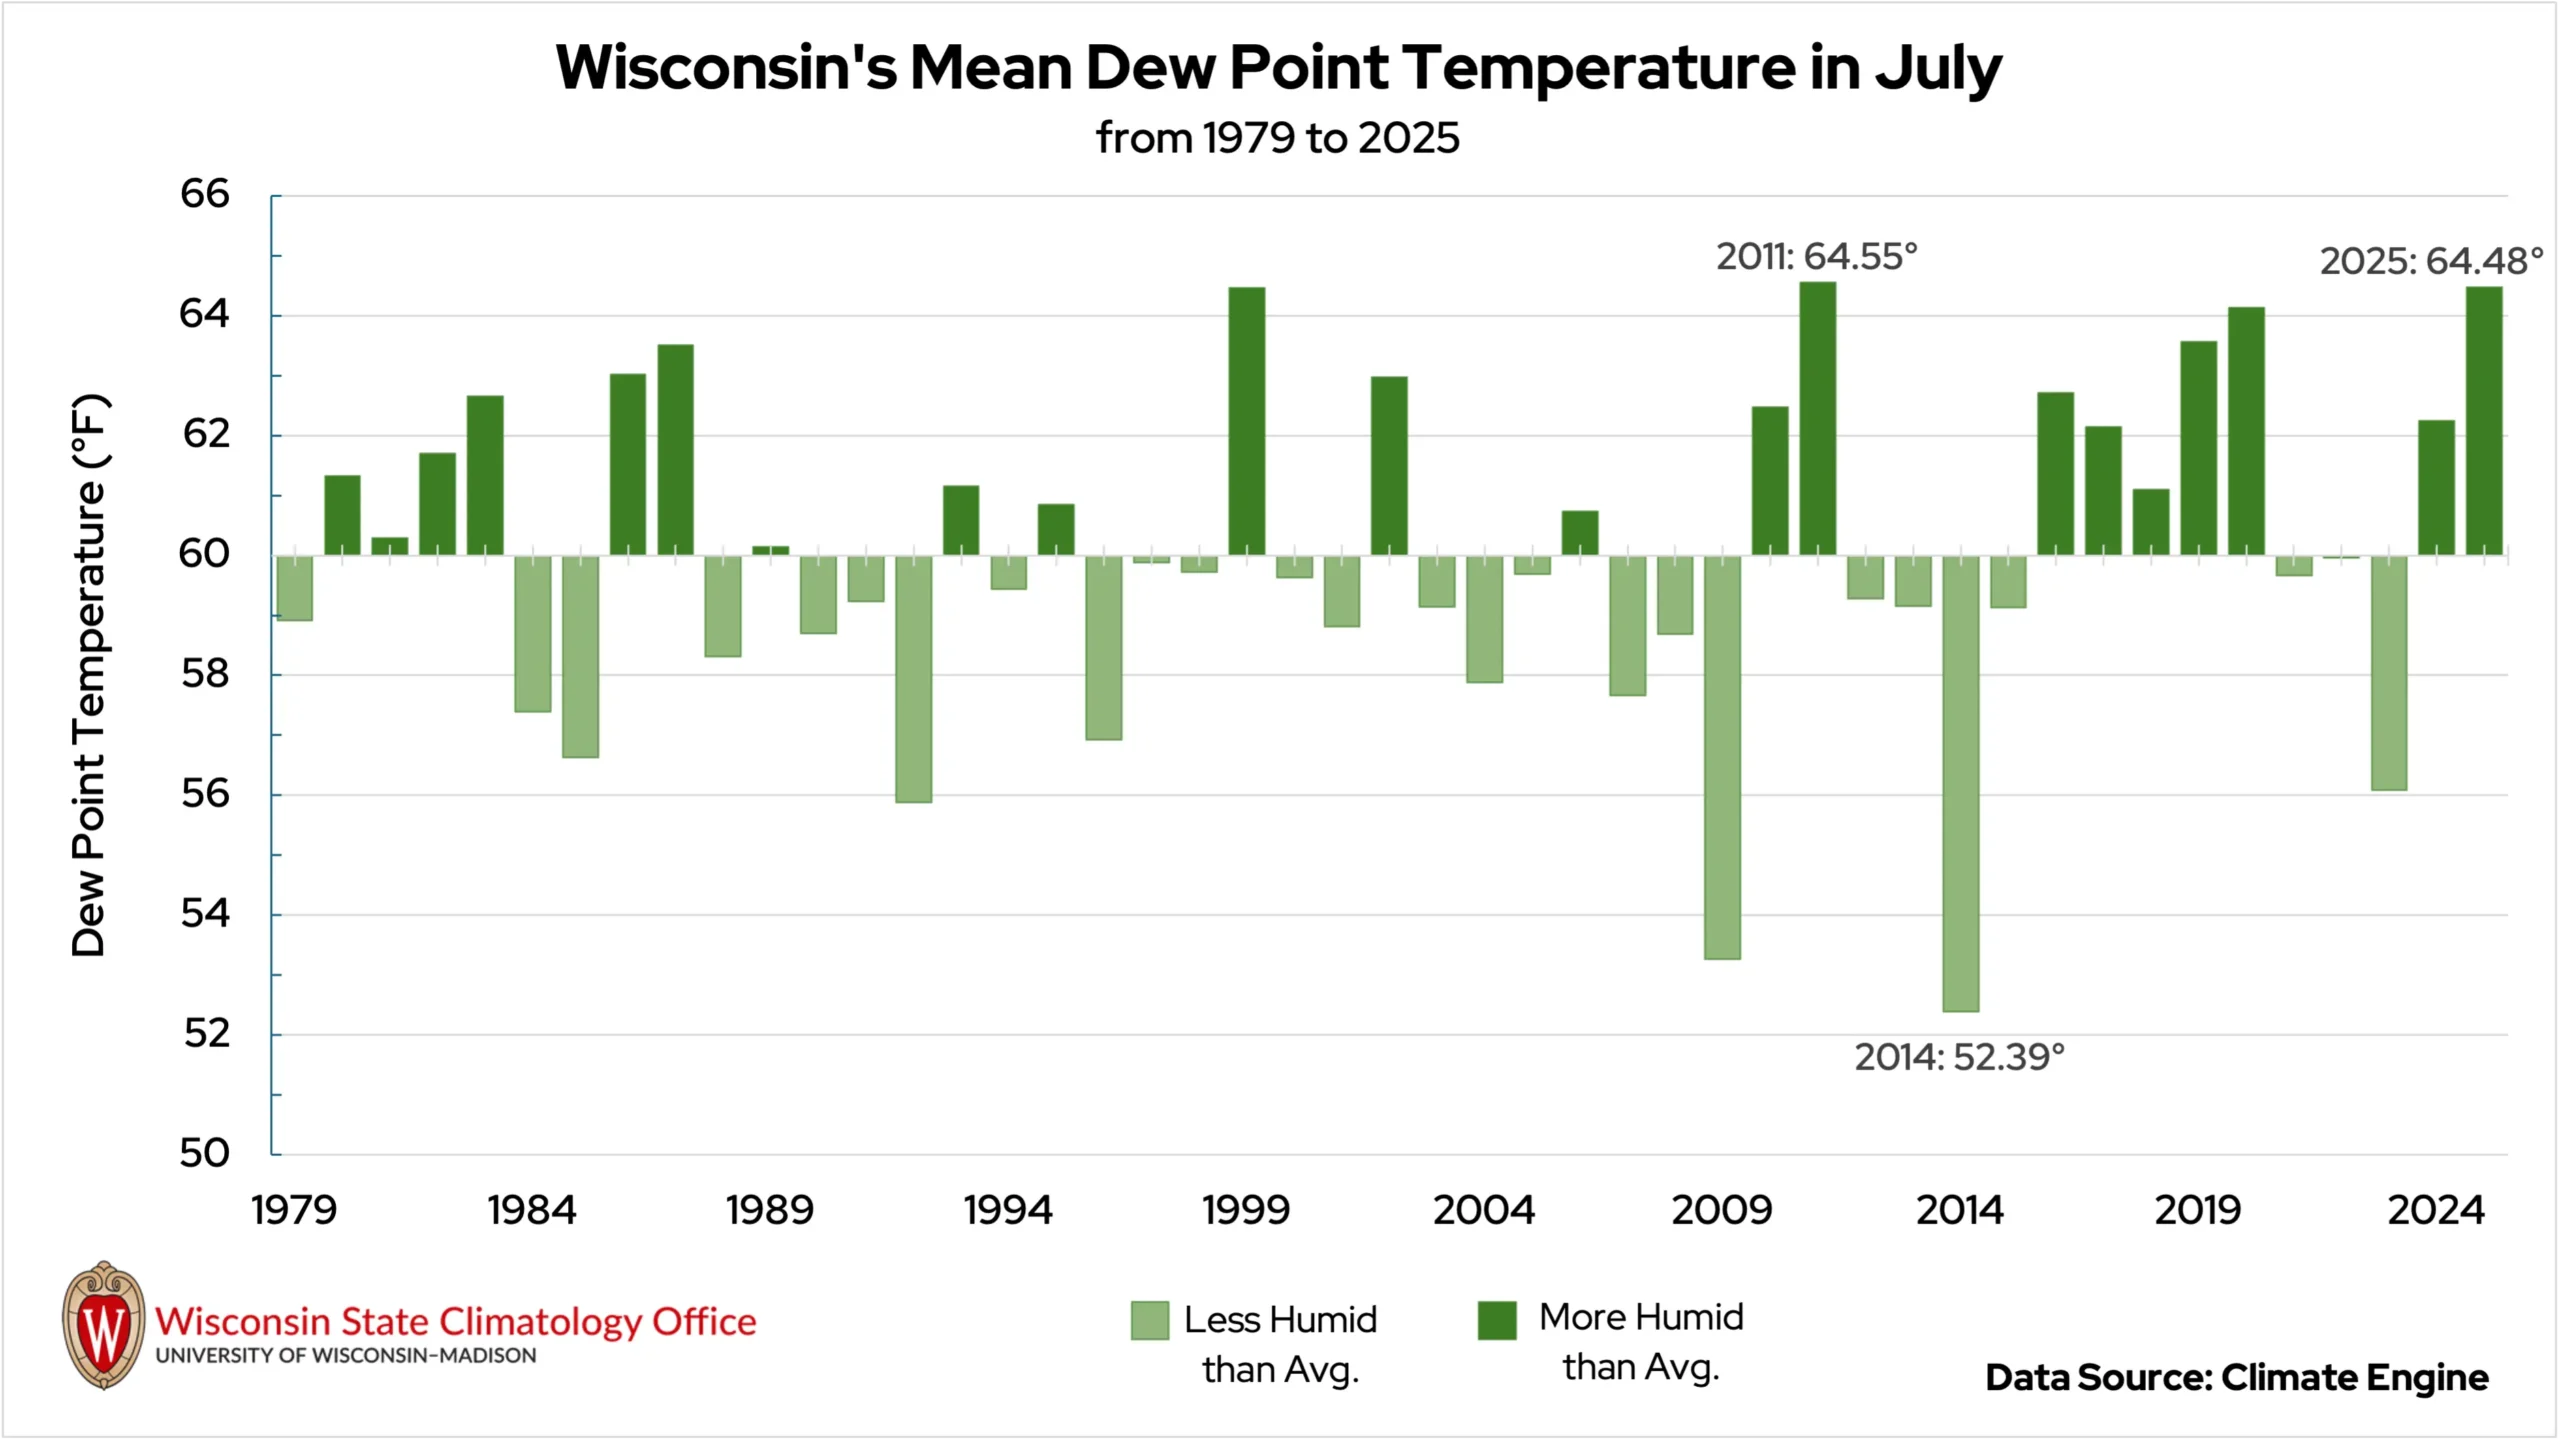
To make matters worse, dew point temperatures rose to the lower 70s and even mid-70s in some locations, making for incredibly muggy and uncomfortable conditions to end the month. In fact, July 2025’s average dew point temperature (64.48 degrees) was the second-highest July monthly average on record in Wisconsin going back to 1979 (Figure 3).
The combination of high air and dew point temperatures contributed to dangerously high heat indices (Table 1). Between July 27 and 29, Wisconsin saw an increase in heat-related emergency department visits (approximately 144 visits), nearly two times more visits than the previous three days.
Overnight temperatures also remained rather high in July, a trend that’s been increasing in recent decades. Lows in the upper 60s and 70s were common across the state, with the warmest nighttime temperature being 79 degrees in Kenosha (Kenosha County) on July 24.
| Location |
Max Heat Index (°F) in July 2025 |
Hours with Heat Index ≥ 100°F in July 2025 |
|---|---|---|
| Wausau | 96 | 0 |
| Green Bay | 97 | 0 |
| Eau Claire | 98 | 0 |
| Madison | 100 | 1 |
| Milwaukee | 105 | 4 |
| La Crosse | 106 | 5 |
When It Rains, It Pours
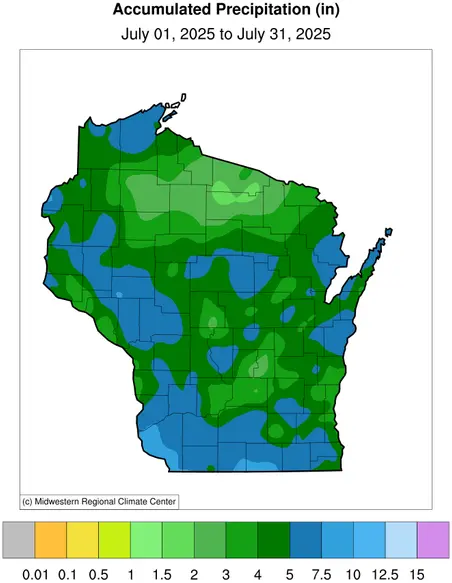
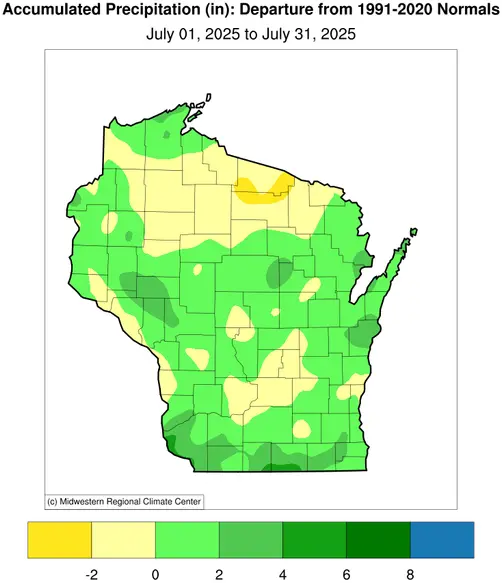
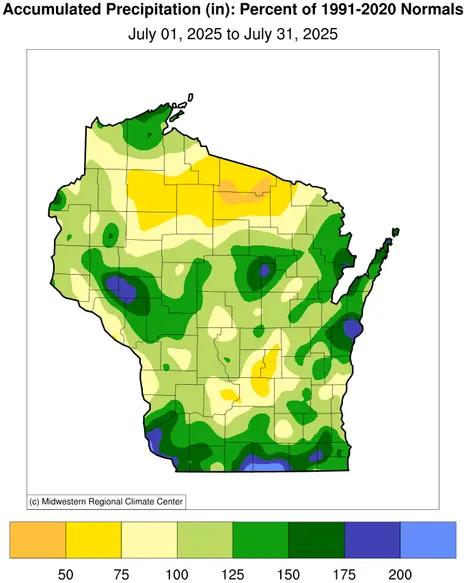
For what’s typically Wisconsin’s second wettest month of the year, July didn’t disappoint! Overall, the state averaged 4.39 inches of rainfall in July, 0.35 inches above the 30-year average (Figure 4).
The rain came down in buckets in many locations throughout the month. Back-to-back heavy rain events led to flash flooding across the state. The National Weather Service issued 19 flash flood warnings during the month, the third-highest July total since 1986.
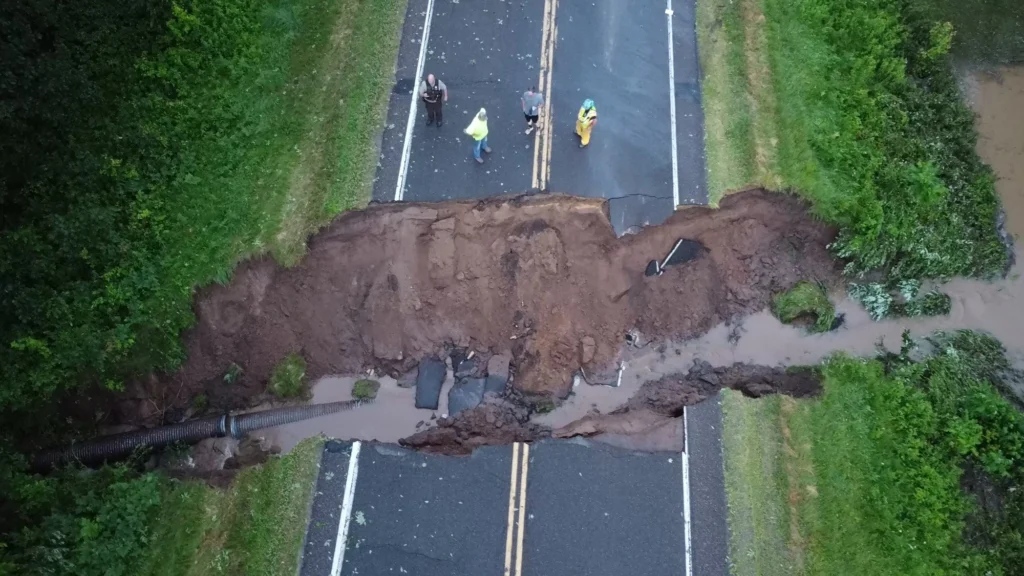
Three to four inches of rain fell in western Wisconsin on July 3 and 4, flooding basements and washing out roadways in Washburn County (Image 1). The heavy rain shifted into eastern Wisconsin a few days later, causing street flooding in Marinette (Marinette County), Howard (Brown County), and Appleton (Outagamie County).
On July 10, isolated downpours in southern Wisconsin dropped impressive rain totals in a short amount of time. The Dane County Regional Airport measured 1.95 inches of rain in just one hour! In Lafayette County, Darlington reported 4.41 inches of rain from the event.
The southern region was in for another round the following day, as a line of training thunderstorms moved in from the west. The heaviest rain fell in the southwest corner of the state, with totals reported between 1.5 to 2.5 inches. Water ran into homes in Lancaster (Grant County), where the Wisconet weather station measured 1.58 inches of rain in just 30 minutes! Flooding closed roadways in part of Lafayette County and sections of Highway 191 in Iowa County. Milwaukee reported a daily record 1.5 inches of rain, replacing the previous July 11 record of 1.04 inches from 2011.
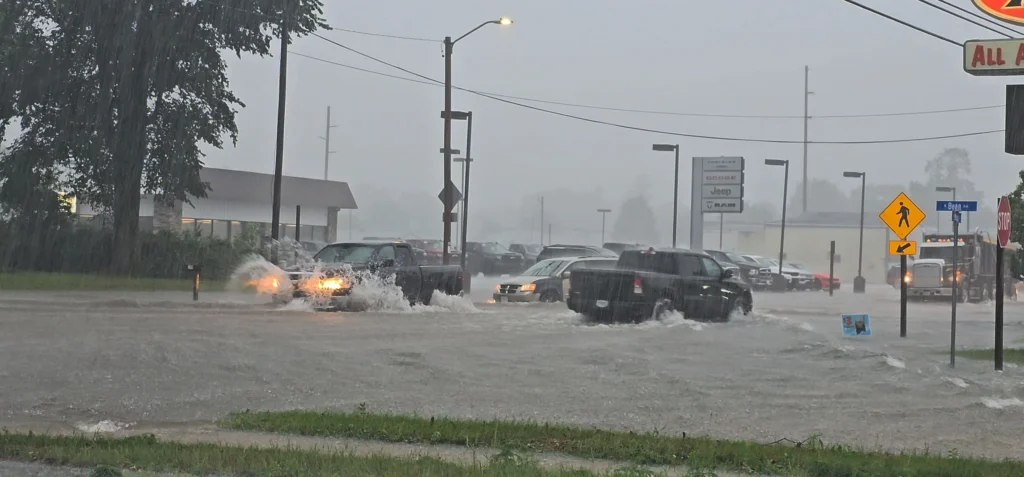
On July 16, a complex of storms poured two to four inches of rain from Waushara County to Manitowoc County. After nearly five inches of rain fell in Wautoma (Waushara County), emergency managers reported water over the hoods of cars on Main Street, requiring passengers to be rescued by boat. Street flooding was also reported in Neenah (Winnebago County), Manitowoc (Manitowoc County), Plymouth (Sheboygan County), and Fond du Lac (Fond du Lac County) (Image 2). The highest rain total reported from the event was 5.57 inches in Two Rivers (Manitowoc County), which all fell within four hours.
Central Wisconsin got in on the heavy rain on July 23, with widespread totals from 1.5 to 3 inches spanning from Pierce County to Marathon County. Eau Claire received 1.61 inches, breaking the city’s previous record of 1.40 inches for the date set in 2011.
A day of slow-moving rain showers in southern Wisconsin on July 29 amounted to totals from a half-inch to nearly two inches. Low-lying roads in Beloit briefly became flooded in the morning, following a steady downpour. Milwaukee reported a new daily rainfall record of 1.04 inches, beating the previous 1976 record by a tenth of an inch.
The Storms Kept Coming
July featured numerous rounds of severe storms, especially in the southern and northeastern parts of the state. The National Weather Service issued 78 severe thunderstorm warnings across the state in the month, bringing Wisconsin’s total severe storm warning count for the year to 313. This is the highest warning count by this point in the year in nearly a decade.
An impressive cluster of thunderstorms moved across southern Wisconsin on July 11, producing destructive winds and dropping buckets of rain. Wind gusts of 79 miles per hour were measured in Scales Mound (Lafayette County) and Monroe (Green County). Areas near Elk Grove reported some damage to corn fields, and widespread tree damage was seen throughout the rest of Lafayette County.
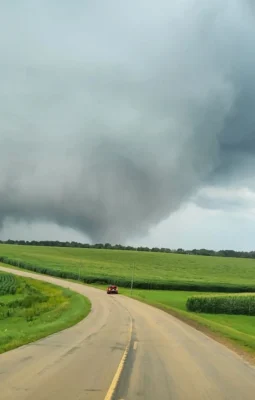
The same region was under fire again on July 16, though with an escalated concern for tornadoes. Storms began to rotate over Iowa County, spawning a tornado just north of Dodgeville (Image 3). With estimated winds of 95 miles per hour, the EF1 tornado caused widespread tree damage but no significant damage to homes in the area. Four additional tornadoes touched down in Dane, Juneau, and Dodge counties as the storms continued northeastward. Additional crop and tree damage was seen along the storm paths, including large tree branches destroying the porch of a home in Roxbury (Dane County).
While southern Wisconsin received steady showers on July 19, a few isolated thunderstorms moved across the northeast part of the state. Thanks to social media video and a few reports of minor damage, the National Weather Service was able to confirm a brief tornado near Branch (Manitowoc County).
On July 23, a batch of storms raced across northern Wisconsin, producing heavy rain and bursts of strong winds. A tornado touched down in Keshena (Menominee County), producing winds of 90 miles per hour that caused campers to turn over at a nearby campground and damaged buildings on the Menominee Reservation. This tornado was only the second to have formed over the county since 1959.
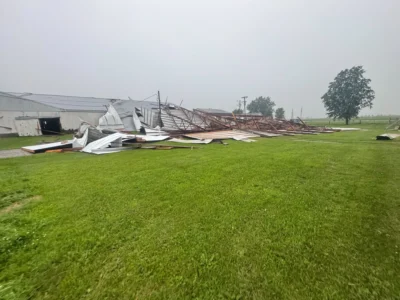
Two additional tornadoes moved through Oconto County, near Gillett and the city of Oconto. A tornado was also seen near Northland in Waupaca County. Wind gusts of 50 to 60 miles per hour from Marathon to Door County created a path of damage, downing dozens of trees and powerlines, and collapsing one pole barn (Image 4). The National Weather Service later confirmed evidence of a brief tornado touched down over a corn field near Clintonville (Waupaca County). Due to a lack of damage, the precise strength of the tornado could not be determined, and it was designated an EF-Unknown.
A line of thunderstorms moved from Minnesota into western Wisconsin late on July 28. Despite some weakening in the storms as they crossed state lines, wind gusts from 60 to 70 miles per hour were still reported, with a 72-mile-per-hour gust in Waumandee (Buffalo County). Many trees and power poles were knocked down, though no reports of structural damage were seen in Wisconsin.
July 2025 Tornadoes in Wisconsin
| Location | Enhanced Fujita (EF) Rating | Estimated Maximum Winds | Damage Reported |
|---|---|---|---|
| Lemonweir (Juneau Co.) | EF0 | 65 mph | Some damage to crops and small trees |
| Hustisford (Dodge Co.) | EF0 | 70 mph | Some crop damage |
| Beaver Dam (Dodge Co.) | EF0 | 65 mph | Portion of corn field flattened, some branches knocked off trees |
| Sauk City (Dane Co.) | EF0 | 80 mph | 20-40 trees uprooted, one of which fell on a house |
| Dodgeville (Iowa Co.) | EF1 | 95 mph | Damage to outbuildings and large, strong trees |
| Branch (Manitowoc Co.) | EF0 | 65 mph | Some tree damage, damage to siding and roof of building |
| Keshena (Menominee Co.) | EF1 | 90 mph | Overturned camper trailers, minor damage to buildings, and uprooted trees |
| Gillett (Oconto Co.) | EF1 | 95 mph | Several uprooted trees, roofs lifted off of two buildings |
| Oconto (Oconto Co.) | EF0 | 77 mph | Numerous snapped and uprooted trees |
| Northland (Waupaca Co.) | EF0 | 75 mph | Few trees snapped and uprooted, minor damage to a home |
| Clintonville (Waupaca Co.) | EFU | Unknown | Some minor crop damage visible from satellite. |
Finally Drought-Free!
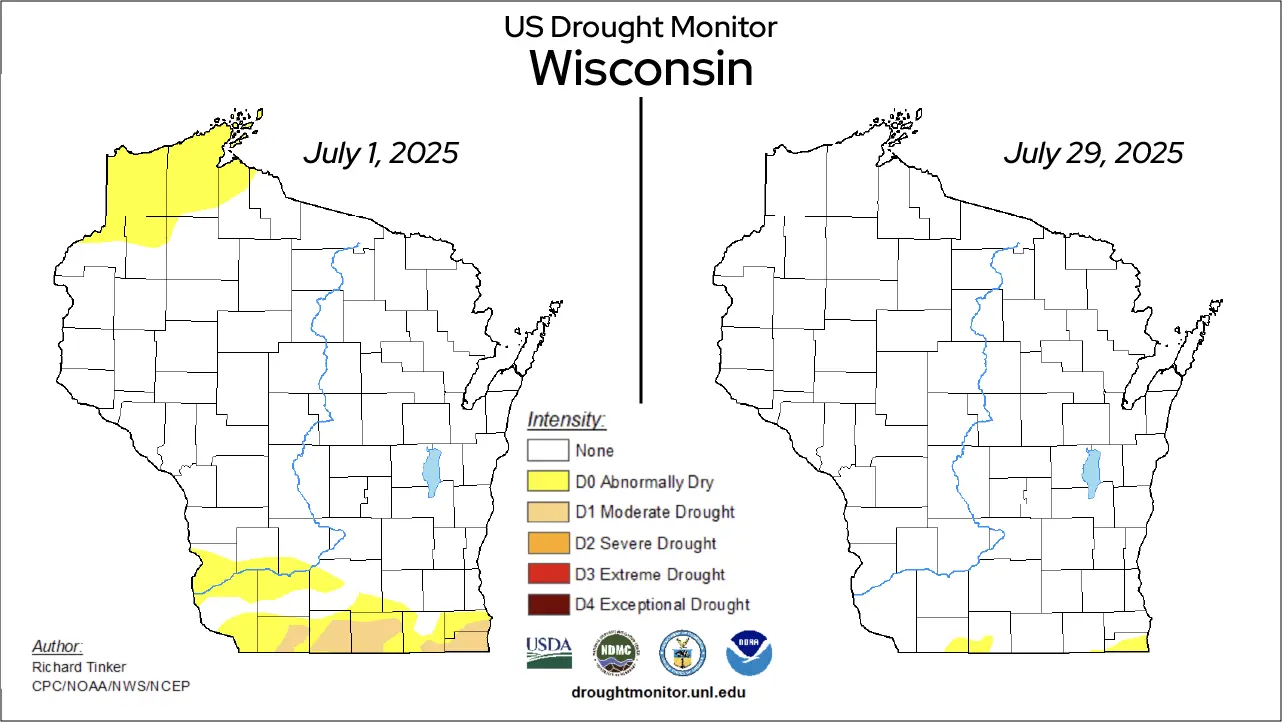
Wisconsin started the month in decent shape, in terms of drought, with some areas of abnormal dryness in the northwestern and southern parts of the state. Portions of counties along the southern state line were in moderate drought (D1) on July 1, according to the U.S. Drought Monitor (Figure 6).
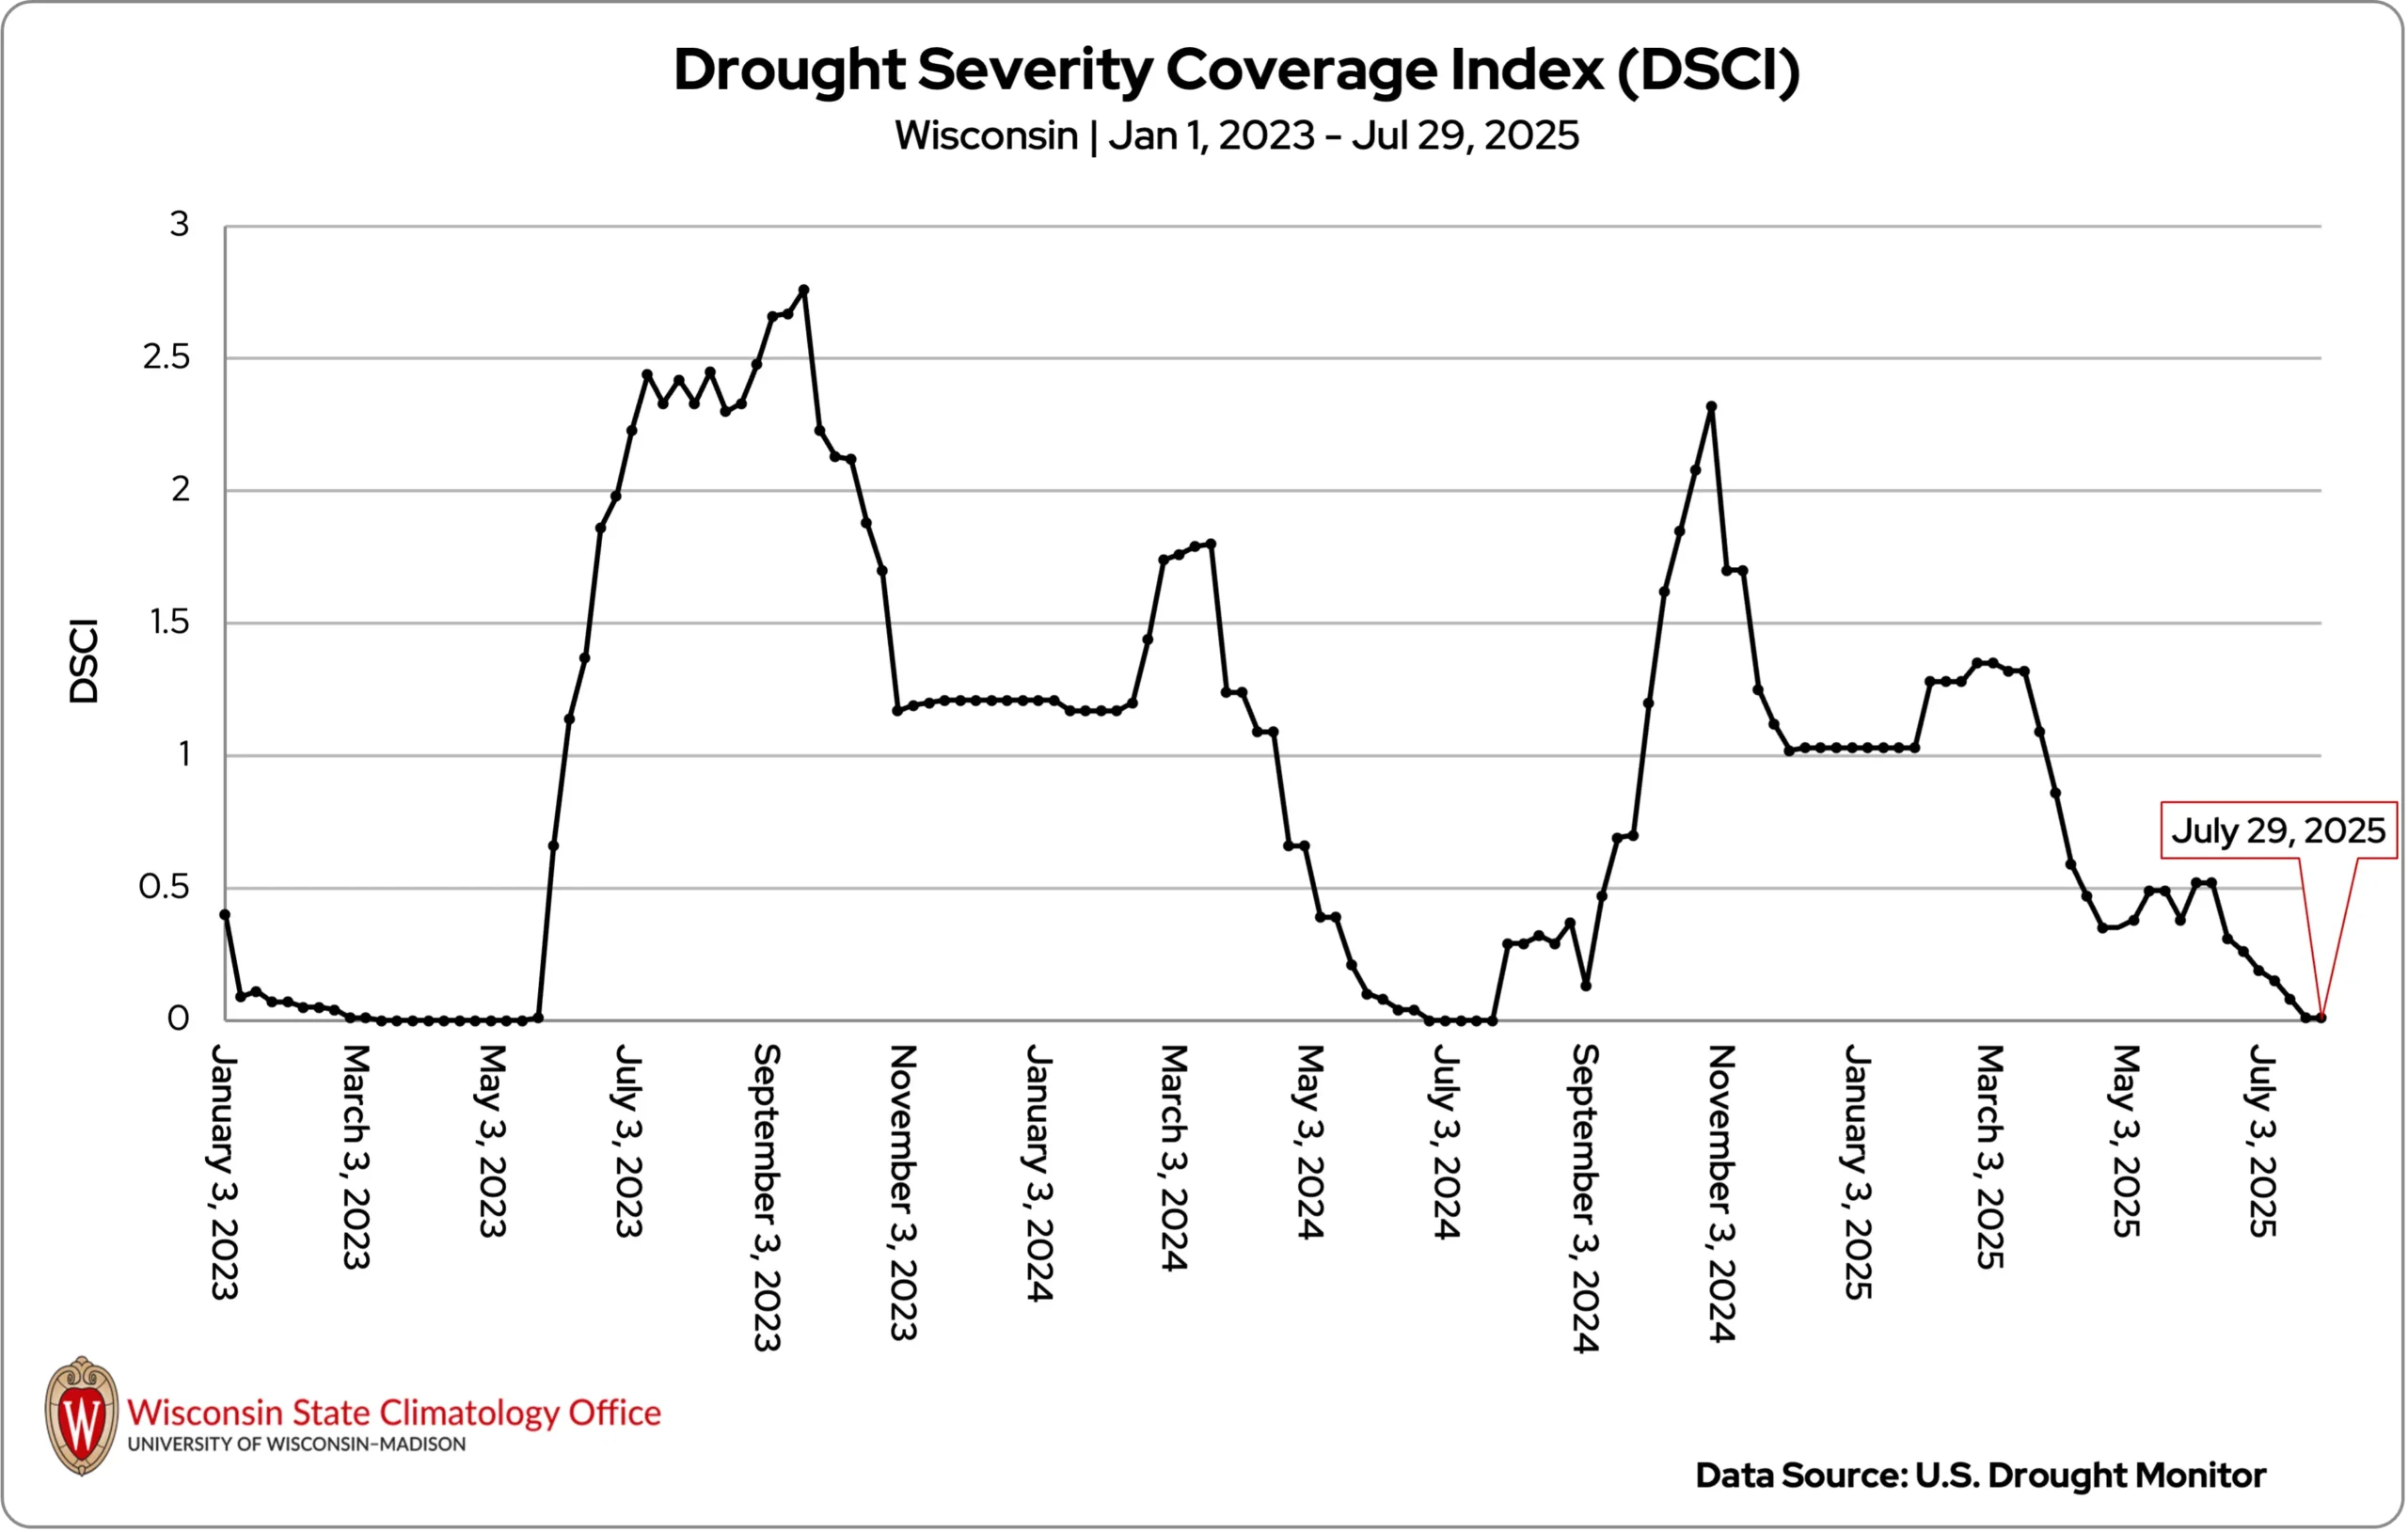
Rounds of thunderstorms through the early and middle part of the month satiated the dry conditions in the northwest and eliminated drought conditions in the southern counties. On July 22, Wisconsin was officially drought-free! This brought the state’s Drought Severity Coverage Index to 0.01, the lowest it has been since July 24, 2024 (Figure 7). Stubborn areas of abnormal dryness (D0) remained in parts of Lafayette, Green, and Racine counties at the end of the month.
Relentless Wildfire Smoke

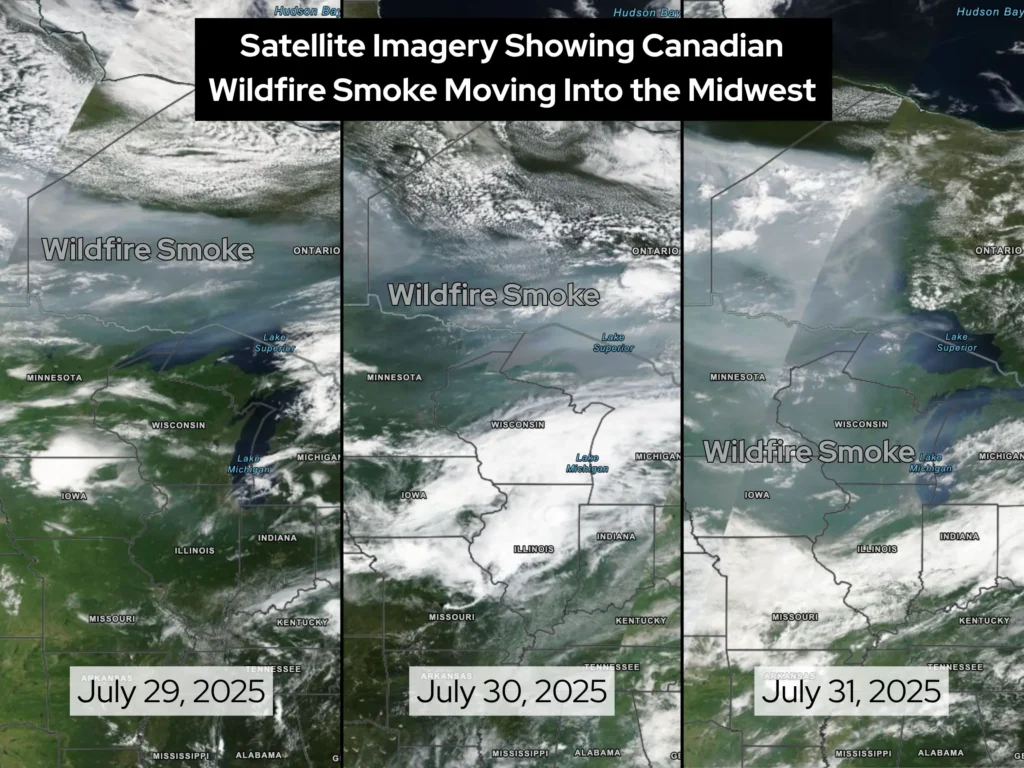
Plumes of wildfire smoke from Canada settled over the Midwest many times during July, diminishing air quality and creating hazy skies. Smoke from fires in Saskatchewan, Manitoba, and Ontario was carried into Wisconsin by the flow of northwesterly winds (Image 5).
The Wisconsin Department of Natural Resources issued three Air Quality Advisories in the state in July, many of them lasting for more than two days. A particularly potent swath of smoke swept into Wisconsin on July 29 and lasted through the end of the month (Figure 8).
On July 31, Green Bay and Milwaukee registered as the most polluted cities in the country, with other Wisconsin cities not far down the ranks. Air Quality Index (AQI) values reflected very unhealthy levels of wildfire smoke pollution across much of the northeast region. Eau Claire reported an AQI of 174, the highest value the city has seen since records began in 2009.
By the end of the month, Wisconsin had experienced air quality impacts from wildfire smoke on 17 days of the year. It has become more common for Wisconsin to be impacted by Canada’s wildfire smoke, as the country’s wildfire seasons worsen.
Agriculture
July’s warmth and mugginess brought a mix of favorable and challenging conditions for Wisconsin agriculture. Farmers also navigated smoky skies from Canadian wildfires. While the smoke likely was not dense enough to cause major crop issues, even light smoke can influence crop growth in competing ways, such as reducing direct sunlight, which can slow photosynthesis, and also increasing diffuse solar radiation that penetrates deeper into plant canopies.
Another one of the month’s “hot” topics was crop sweat — the moisture plants release into the air through transpiration. When paired with evaporation from plants, soil, and water, this process (called evapotranspiration) can nudge dew points upward, making days feel even more humid. Besides adding to that sticky summer feel, the extra moisture can sometimes help fuel rain and thunderstorms. While corn is often the biggest contributor to July’s crop sweat, soybeans and other crops also play a role.
Overall, July provided four to five suitable fieldwork days per week, and crop progress stayed close to the five-year average throughout the month. Where rain fell, some ponding occurred, and hay and forage cutting slowed. The combination of warmth and humidity also created ideal conditions for summer diseases and insects in certain crops, such as apples, grapes, and corn. Nonetheless, the rain was welcomed, especially as the late-month heat wave prompted a need for moisture.
Apple growers did have another concern, though. By early July, some reported unusual orchard symptoms suggesting cold injury — likely stemming from the early part of winter, after a warm fall left trees and vines more vulnerable to subsequent cold snaps.
Climate Corner
Wisconsin is no stranger to hot summer weather, as many of us experienced during July 2025. Over the last 130 years, several summer months in Wisconsin have been beastly hot, with July 1936 standing out as one of the worst. The deadly heat, in conjunction with the beginnings of the Dust Bowl, devastated not just Wisconsin but the nation. Read the full history on our Climate Ed-ucation blog!
Climate Stats by Division
July 2025 Temperature (degrees Fahrenheit)
Color Key
-
Dark blue: Record coolest
-
Royal blue: Bottom ⅒
-
Light blue: Bottom ⅓
-
White: Normal
-
Light orange: Top ⅓
-
Orange: Top ⅒
-
Red: Record warmest
| Division | Avg | Dept |
|---|---|---|
| Northwest | 69.1: top ⅓ | 1.0: top ⅓ |
| North Central | 68.4: top ⅓ | 1.4: top ⅓ |
| Northeast | 69.4: top ⅓ | 2.0: top ⅓ |
| West Central | 72.7: top ⅓ | 2.0: top ⅓ |
| Central | 72.9: top ⅓ | 2.8: top ⅓ |
| East Central | 71.6: top ⅓ | 1.9: top ⅓ |
| Southwest | 73.5: top ⅓ | 2.0: top ⅓ |
| South Central | 73.7: top ⅓ | 2.1: top ⅓ |
| Southeast | 72.9: top ⅓ | 1.6: top ⅓ |
| State | 71.0: top ⅓ | 1.8: top ⅓ |
Heating Degree Days
Color Key
-
Dark blue: Record most
-
Royal blue: Top ⅒
-
Light blue: Top ⅓
-
White: Normal
-
Light orange: Bottom ⅓
-
Orange: Bottom ⅒
-
Red: Record fewest
| July 2025 | Since July 1, 2025 | |||
|---|---|---|---|---|
| Division | Avg | Dept | Avg | Dept |
| Northwest | 27: bottom ⅓ | -16: bottom ⅓ | 27: bottom ⅓ | -16: bottom ⅓ |
| North Central | 32: bottom ⅓ | -22: bottom ⅓ | 32: bottom ⅓ | -22: bottom ⅓ |
| Northeast | 21: bottom ⅓ | -25: bottom ⅓ | 21: bottom ⅓ | -25: bottom ⅓ |
| West Central | 10: bottom ⅓ | -14: bottom ⅓ | 10: bottom ⅓ | -14: bottom ⅓ |
| Central | 17: bottom ⅒ | -18: bottom ⅒ | 17: bottom ⅒ | -18: bottom ⅒ |
| East Central | 9: bottom ⅓ | -14: bottom ⅓ | 9: bottom ⅓ | -14: bottom ⅓ |
| Southwest | 7: bottom ⅓ | -12: bottom ⅓ | 7: bottom ⅓ | -12: bottom ⅓ |
| South Central | 0: record few | -14: record few | 0: record few | -14: record few |
| Southeast | 6: bottom ⅓ | -9: bottom ⅓ | 6: bottom ⅓ | -9: bottom ⅓ |
| State | 9: bottom ⅓ | -13: bottom ⅓ | 9: bottom ⅓ | -13: bottom ⅓ |
Liquid-Equivalent Precipitation (Inches)
Color Key
-
Dark brown: Record driest
-
Light brown: Bottom ⅒
-
Beige: Bottom ⅓
-
White: Normal
-
Light green: Top ⅓
-
Green: Top ⅒
-
Dark green: Record wettest
| July 2025 | Since Nov. 1, 2024 | |||
|---|---|---|---|---|
| Division | Avg | Dept | Avg | Dept |
| Northwest | 4.04: normal | -0.14: normal | 22.33: normal | 0.49: normal |
| North Central | 3.51: normal | -0.47: normal | 24.96: top ⅓ | 2.33: top ⅓ |
| Northeast | 4.03: top ⅓ | 0.24: top ⅓ | 26.28: top ⅒ | 4.35: top ⅒ |
| West Central | 4.57: top ⅓ | 0.45: top ⅓ | 25.67: top ⅓ | 1.70: top ⅓ |
| Central | 3.81: normal | -0.08: normal | 26.31: top ⅓ | 2.64: top ⅓ |
| East Central | 4.71: top ⅓ | 1.00: top ⅓ | 24.67: top ⅓ | 1.56: top ⅓ |
| Southwest | 5.96: top ⅓ | 1.37: top ⅓ | 28.08: top ⅓ | 1.30: top ⅓ |
| South Central | 5.35: top ⅓ | 1.20: top ⅓ | 24.48: top ⅓ | -1.66: top ⅓ |
| Southeast | 4.98: top ⅓ | 1.31: top ⅓ | 23.71: normal | -1.58: normal |
| State | 4.39: top ⅓ | 0.35: top ⅓ | 25.04: top ⅓ | 1.49: top ⅓ |
Monthly, seasonal, and annual temperature and precipitation values and rankings published in this report are from NOAA’s National Centers for Environmental Information at the time of posting this climate summary. Values and rankings can change after publishing our climate summaries. To check the most recent values and rankings, visit NOAA’s National Centers for Environmental Information Climate at a Glance Tool.
This report is a product of the Wisconsin State Climatology Office. For questions and comments, please contact us by email (stclim@aos.wisc.edu) or phone (608-263-2374).