A very wet June in Wisconsin completely extinguished the last remnants of drought across the entire state. The month was also slightly warmer than normal, continuing our long streak of above-normal monthly temperatures.
It’s Raining, It’s Pouring …
June precipitation picked right up from a waterlogged May. Virtually the entire state experienced wetter-than-normal conditions, in some places by large amounts. In fact, the month goes in the books as Wisconsin’s sixth wettest June on record (since 1895). Most locations got at least half a foot of rainfall, leading to a statewide average of 6.97 inches, which is a hearty 48 percent (2.27 inches) more than normal (Figure 1). Even though June is usually Wisconsin’s wettest month, the excess rainfall this year led to considerable flooding and storm damage. The largest surpluses occurred in northwest and south-central regions, where four- to six-inch departures from normal were common. In many counties across Wisconsin, these anomalies represented double the normal June rainfall totals. Bayfield County experienced its wettest June on record.


Rain fell frequently and intensely during June. Across most of the state, measurable rainfall (at least 0.01 inch) occurred on more than half the days. La Crosse saw a record of 24 days with at least a trace of rain (Figure 2). The month also featured some impressive daily deluges around Wisconsin of more than three inches (Figure 3). A very localized band of extremely heavy rainfall struck central Madison on the afternoon of June 19, producing 4.81 inches at the University of Wisconsin Arboretum.


The soaking month was a stark contrast to June 2023, when the state rapidly transitioned into major drought during the fifth driest June on record. As a result, Wisconsin just experienced its largest one-year reversal (to sixth wettest) for this month. Following this year’s 10th-wettest May on record, the combined May-to-June rainfall set a new record for statewide sogginess at 12.51 inches. Compared with last year’s third driest May-to-June period on record, Wisconsin’s recent “precipitation ping pong” pattern shows no signs of abating.
Another Warmer-than-Normal Month
With the abundance of rain stealing the thunder last month, temperatures got less attention. However, Wisconsin relished a pleasantly warm June, with an average temperature of 65.6°F. Most of the state experienced highs in the 70s, with the far southern counties seeing highs in the 80s (Figure 4).

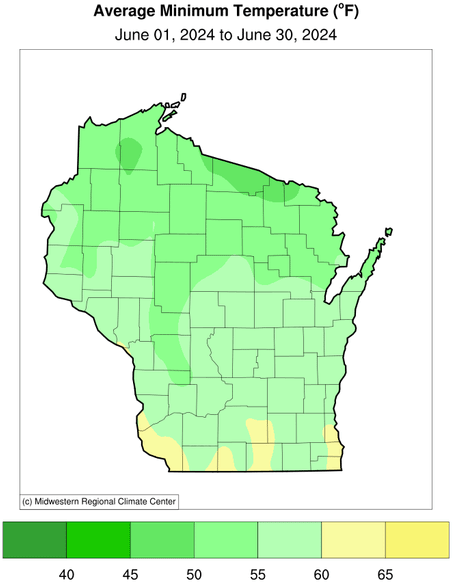
Lows averaged in the 50s for most, with 60s along the Wisconsin-Illinois border. The southern and eastern parts of the state had the biggest departures in daily averages: one to three degrees warmer than normal, compared to near-normal in northern and western Wisconsin. There was even a patch of one to two degrees below normal over Vilas, Oneida, and Forest counties (Figure 5). Overall, June was a classic Wisconsin summer month, just 0.5 degrees above the historical norm of 65.1 degrees Fahrenheit.

June marked 13 consecutive months of record-warm global temperatures and continued Wisconsin’s 18-month stretch of above-average temperatures, except July 2023, which was slightly cooler (Figure 6). January 2023 to June 2024 was the warmest January-through-June stretch in state history with an average of 45.1 degrees Fahrenheit. This broke the previous record of 44.9 degrees Fahrenheit from January 1998 to June 1999, and far exceeded the 1991–2020 average of 41.9 degrees Fahrenheit.
| Date | Average Temperature | Rank (out of 18) | Anomaly | 1895-2024 Monthly Mean |
|---|---|---|---|---|
| June 2024 | 65.6°F | 15 | 1.2°F | 64.4°F |
| May 2024 | 57.6°F | 13 | 2.7°F | 54.9°F |
| April 2024 | 45.3°F | 10 | 2.4°F | 42.9°F |
| March 2024 | 35.2°F | 8 | 6.6°F | 28.6°F |
| February 2024 | 31.4°F | 5 | 14.8°F | 16.6°F |
| January 2024 | 21.0°F | 1 | 7.8°F | 13.2°F |
| December 2023 | 32.2°F | 6 | 13.4°F | 18.8°F |
| November 2023 | 34.5°F | 7 | 2.5°F | 32.0°F |
| October 2023 | 49.4°F | 11 | 2.6°F | 46.8°F |
| September 2023 | 63.2°F | 14 | 4.7°F | 58.5°F |
| August 2023 | 67.7°F | 17 | 1.1°F | 66.6°F |
| July 2023 | 68.6°F | 18 | -0.5°F | 69.1°F |
| June 2023 | 66.6°F | 16 | 2.2°F | 64.4°F |
| May 2023 | 56.8°F | 12 | 1.9°F | 54.9°F |
| April 2023 | 43.4°F | 9 | 0.5°F | 42.9°F |
| March 2023 | 28.7°F | 4 | 0.1°F | 28.6°F |
| February 2023 | 21.7°F | 2 | 5.1°F | 16.6°F |
| January 2023 | 23.0°F | 3 | 9.8°F | 13.2°F |
Figure 6. January 2023 through June 2024 average monthly temperature, each month’s rank out of the 18 months, each month’s anomaly or departure from the 1895–2024 monthly mean temperature, and the 1895–2024 monthly mean temperature (National Centers for Environmental Information Climate at a Glance).
Despite the mostly enjoyable temperatures last month, Wisconsin endured heat and humidity the third week of June. Daily temperatures reached the 80s and 90s (Figure 7), with dew points in the upper 60s and lower 70s making for muggy conditions. The highest recorded temperature in Wisconsin last month was 97 degrees Fahrenheit at the Kenosha Regional Airport on June 17.

However, this hot spell was nothing exceptional compared to Wisconsin’s historic heat waves, such as in 1995, 1980, and 1936. In fact, most of Wisconsin has yet to record a 90 degrees Fahrenheit day this year (Figure 8).

Severe Weather Wreaks Havoc
In addition to intense localized rainfall, last month’s series of severe weather events also included tornadoes, large hail, and strong winds. Flooding overtook much of the state, most notably the weekend of June 21. Several rounds of rain hit much of Wisconsin from 3 a.m. on Friday, June 21, to 9 p.m. on Saturday, June 22. Rainfall rates of one to two inches per hour led to two-day totals of three to six inches across many counties from Sauk to Sheboygan (Figure 9).
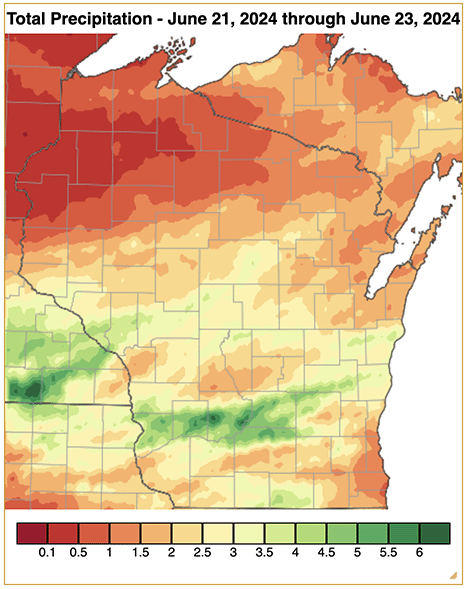
This caused widespread flooding in fields, yards, and basements, mud and rock slides, and damaged roads and culverts (Figure 10). River levels rose, too: the Mississippi River at La Crosse set a new June stage record (Figure 11) of 14.18 feet on Friday, June 28, surpassing the previous record of 14.10 feet set in June 1993.


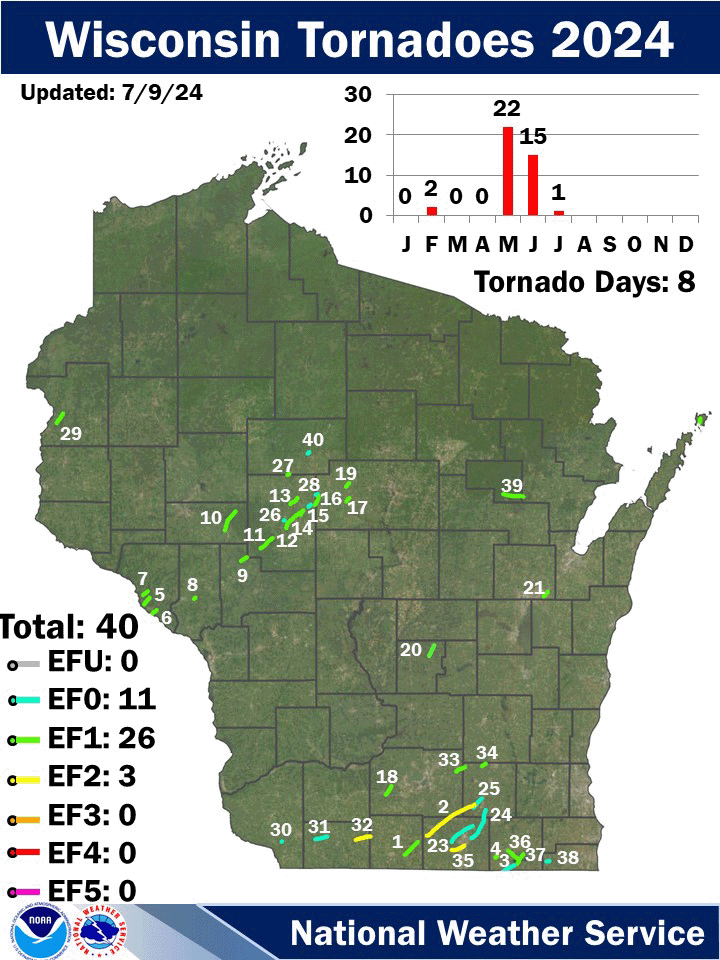
June is historically Wisconsin’s most active month for tornado activity (see the Climate Corner in the May and Spring 2024 Climate Summary). While May had more tornadoes, June had its fair share with an estimated 14 tornadoes striking the state. June 22 was particularly intense with nine tornadoes forming amid heavy rain. A majority of the tornadoes took root over Clark County and Wisconsin’s southernmost counties (Figure 12).
| Date | County | Location | EF rating | Length | Width | Deaths/injuries |
|---|---|---|---|---|---|---|
| Feb. 8 | Green | Albany | 1 | 8.35mi | 50yd | 0/0 |
| Feb. 8 | Rock, Dane, Jefferson | Evansville | 2 | 26.2mi | 750yd | 0/1 |
| May 7 | Walworth | Fontana-On-Geneva | 0 | 5.23mi | 50yd | 0/0 |
| May 7 | Walworth | Darien | 1 | 0.98mi | 50yd | 0/0 |
| May 21 | Buffalo | Cochrane | 1 | 3.93mi | 75yd | 0/0 |
| May 21 | Buffalo | Fountain City | 1 | 2.95mi | 50yd | 0/0 |
| May 21 | Buffalo | Buffalo City | 1 | 2.78mi | 45yd | 0/0 |
| May 21 | Trempealeau | Arcadia | 1 | 0.86mi | 75yd | 0/0 |
| May 21 | Jackson | Alma Center | 1 | 3.14mi | 75yd | 0/0 |
| May 21 | Eau Claire | Augusta | 1 | 9.7mi | 90yd | 0/0 |
| May 21 | Clark | Humbird | 1 | 9.45mi | 300yd | 0/0 |
| May 21 | Clark | Loyal | 0 | 12.3mi | 100yd | 0/0 |
| May 21 | Clark | Greenwood | 1 | 4.24mi | 150yd | 0/0 |
| May 21 | Clark | Loyal2 | 0 | 6.22mi | 75yd | 0/0 |
| May 21 | Clark, Marathon | Unity | 1 | 3.53mi | 65yd | 0/0 |
| May 21 | Marathon | Fenwood | 1 | 2.11mi | 60yd | 0/0 |
| May 21 | Dane | Springdale | 1 | 4.74mi | 75yd | 0/0 |
| May 21 | Marathon | Edgar | 1 | 2.13mi | 80yd | 0/0 |
| May 21 | Marquette | Neshkoro | 1 | 5.27mi | 60yd | 0/0 |
| May 21 | Outagamie | Kaukauna | 1 | 2.68mi | 80yd | 0/0 |
| May 21 | Door | Washington Island | 1 | 2.28mi | 90yd | 0/0 |
| May 26 | Rock | Milton | 0 | 12.2mi | 50yd | 0/0 |
| May 26 | Rock, Jefferson | Lima Center | 0 | 15mi | 50yd | 0/0 |
| May 26 | Jefferson | Lake Koshkonong | 0 | 5.57mi | 30yd | 0/0 |
| June 17 | Clark | Greenwood | 0 | 0.42mi | 25yd | 0/0 |
| June 17 | Clark, Taylor | Withee | 1 | 0.91mi | 45yd | 0/0 |
| June 17 | Clark, Marathon | Colby | 0 | 0.83mi | 46yd | 0/0 |
| June 18 | Polk | Dresser | 1 | 4.99mi | 100yd | 0/0 |
| June 22 | Grant | Tennyson | 0 | 0.16mi | 40yd | 0/0 |
| June 22 | Lafayette | Belmont | 0 | 5.6mi | 75yd | 0/0 |
| June 22 | Lafayette, Green | Argyle | 2 | 6.94mi | 500yd | 0/0 |
| June 22 | Dane, Jefferson | Marshall | 1 | 4.58mi | 300yd | 0/0 |
| June 22 | Jefferson | Watertown | 1 | 2.07mi | 150yd | 0/0 |
| June 22 | Rock | Janesville | 2 | 6.21mi | 700yd | 0/0 |
| June 22 | Walworth | Williams Bay | 1 | 6.07mi | 150yd | 0/0 |
| June 22 | Walworth | Fontana | 1 | 5.31mi | 100yd | 0/0 |
| June 22 | Kenosha | Powers Lake | 0 | 1.42mi | 40yd | 0/0 |
| June 24 | Menominee, Oconto | Keshena | 1 | 8.96mi | 83yd | 0/0 |
| July 5 | Taylor | Medford | 0 | 1mi | 40yd | 0/0 |
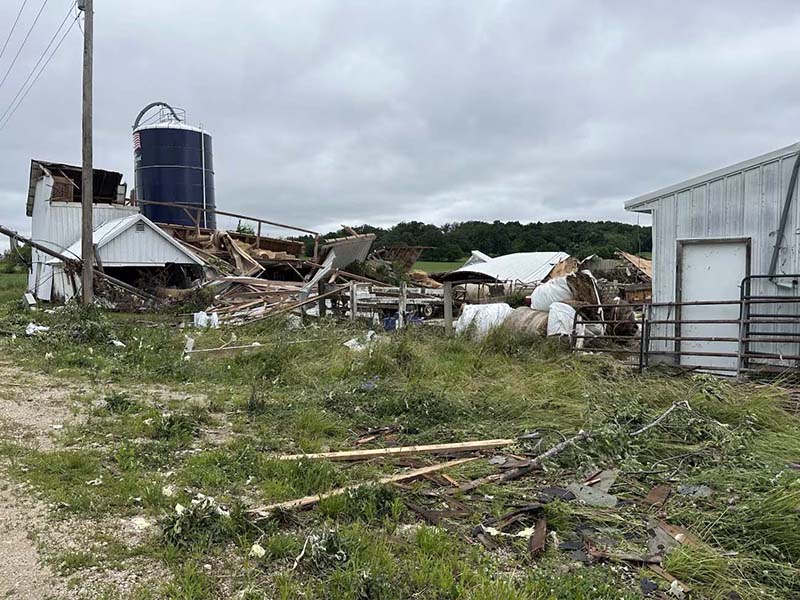
Fortunately there were no deaths or injuries. However, there was damage to trees, homes, structures, and farms, including the Klecker’s 120-year-old family farm in Marshall (Figure 13) and the Apple Grove Lutheran Church in Argyle (Figure 14). In total, there were five EF0s, seven EF1s, and two EF2s this June, bringing the year’s total to 38 tornadoes, compared to the annual average of 23.

There were also reports of hailstones of an inch to an inch and a half in diameter and winds greater than 70 miles per hour, with particularly intense storms the evening of June 24 into the early morning hours of June 25. These storms raced across much of northeast Wisconsin, uprooting trees and knocking down power lines, with the most damage from Lincoln City to Manitowoc County. Minor flooding was also reported, with the worst in southern Door County where a road was partially washed out and power was out all day.
Too Much of a Good Thing
The surplus precipitation kept Wisconsin out of drought throughout June, even eliminating the few small patches of abnormally dry conditions that have persisted in the Central Sands and Driftless areas since June 2023 (Figure 15).


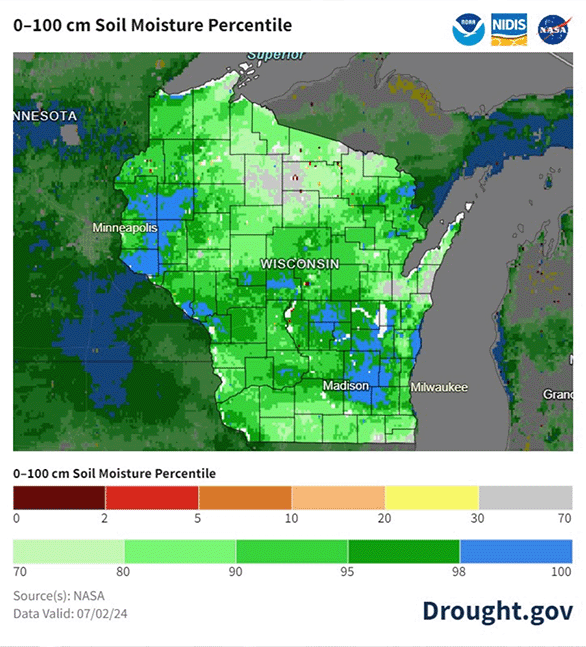
Soil moisture was replenished as most of the state ranked in the 70th percentile or higher throughout the month (Figure 16). Though wet conditions are typically good for crops at this point in the growing season, the abundance of rainfall and soil moisture made fieldwork challenging.


Standing water in fields can erode soils, drown crops, enlarge hay (making it tougher to harvest), and limit the opportunity to spray for weeds and pests. Despite the trying growing conditions, Wisconsin’s crops continued to progress, with a majority remaining in good to excellent condition and hovering right around the five-year average pace throughout the month (USDA Crop Progress and Condition Reports).
Outlook
June was another unusually warm month nationwide, and the National Weather Service’s seasonal outlook for the rest of the summer (July to September) suggests that more heat is in store (Figure 17). The West is most likely to see abnormally hot weather, and Wisconsin has a 40 to 50 percent probability of warmer than average conditions. By contrast, the rainfall outlook shows no indication whether Wisconsin (or most of the Midwest) will be unusually wet or dry (Figure 18), but our extremely wet May and June have provided a buffer against a return of drought anytime soon.


Climate Corner
Was the recent June flooding unprecedented? Well, this summer’s recent flooding wasn’t just the result of local rainfall, but also the runoff from torrential and persistent rain in southern Minnesota and western Wisconsin which were fueled by a stationary heat dome over the southwest United States. While summer floods do occur in Wisconsin, spring floods are more common due to melting snow and spring rains on frozen ground. According to the National Weather Service, 24 of the 35 floods that have occurred since April 1937 along the Mississippi River at La Crosse have been in the spring; only eight floods and three have been reported in the summer and fall, respectively.
Historic floods include the April 1965 peak, when the Mississippi River at La Crosse reached an all-time record of 17.89 feet, remaining above flood stage for weeks due to unusual frost depth, significant snowfall, and heavy spring rains. The “Great Flood of 1993” ran from spring into summer, with the Black River in western Wisconsin experiencing heavy flooding. This event was exacerbated by the previous autumn’s above normal rainfall, heavy winter snowfall, and persistent humid air flows.