July in Wisconsin was surprisingly normal, with temperature and precipitation close to their long-term averages for a change. However, intense rainfall in southern Wisconsin caused damage and flooding while northern Wisconsin and the Lake Michigan coast returned to dry conditions.
First Cooler-than-Normal Month in One Year
Thanks to a persistent heat dome over the western U.S. that brought northwesterly flow over our region, July was comfortable for the most part (Figure 1). In fact, July marked Wisconsin’s first cooler-than-normal month (relative to the 1991 to 2020 average) since last July (Figure 2).
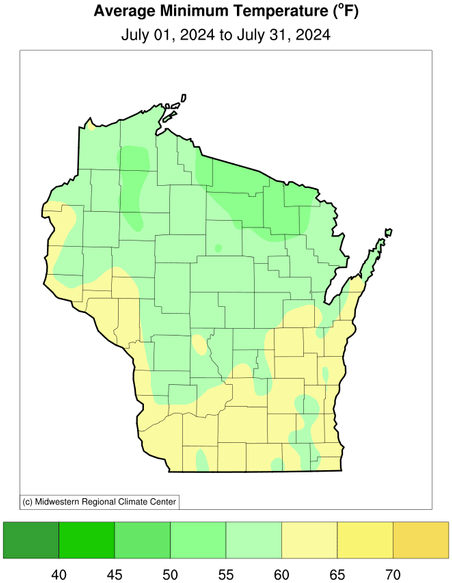
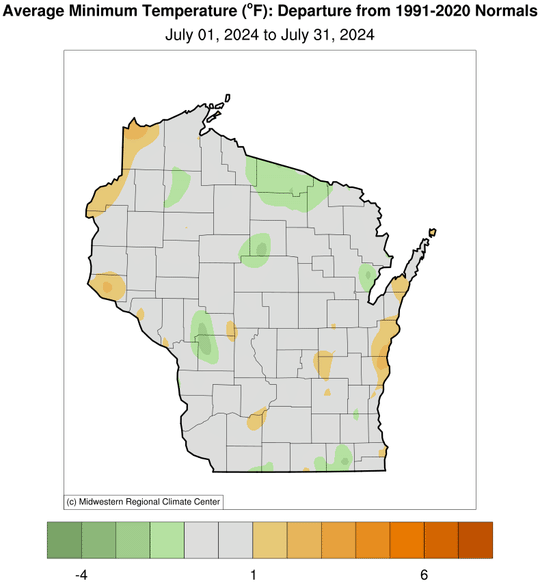
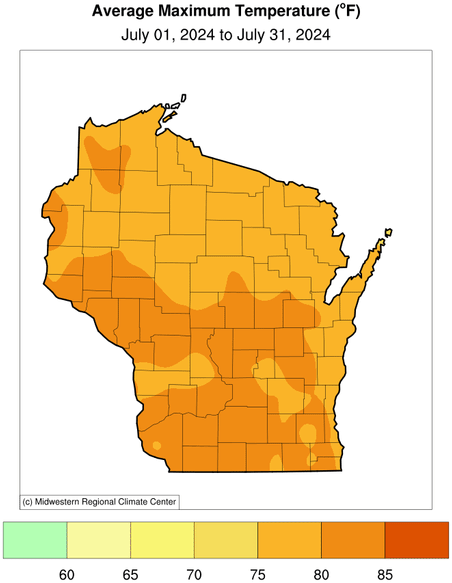
Minimum temperatures averaged 55 to 60 degrees for the northern half of Wisconsin and 60 to 65 for the southern half (Figure 3). The coolest temperature was 38 degrees in Glidden (Iron County) on July 1. However, not all of July was so refreshing as maximum temperatures averaged 75 to 80 degrees to the north and 80 to 85 to the south (Figure 4). The state’s hottest temperature reached 94 degrees in La Crosse, Richfield, and Boscobel on July 16 and 31.
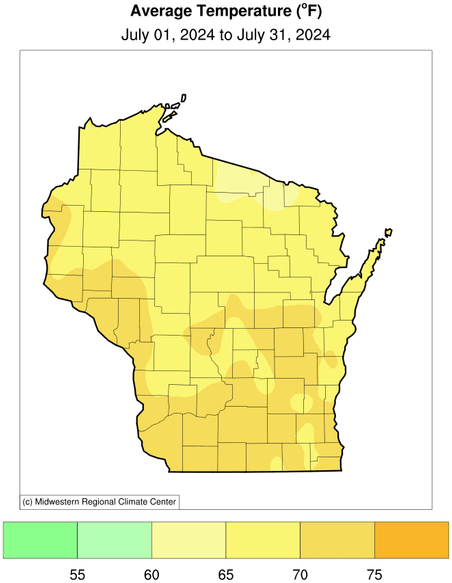

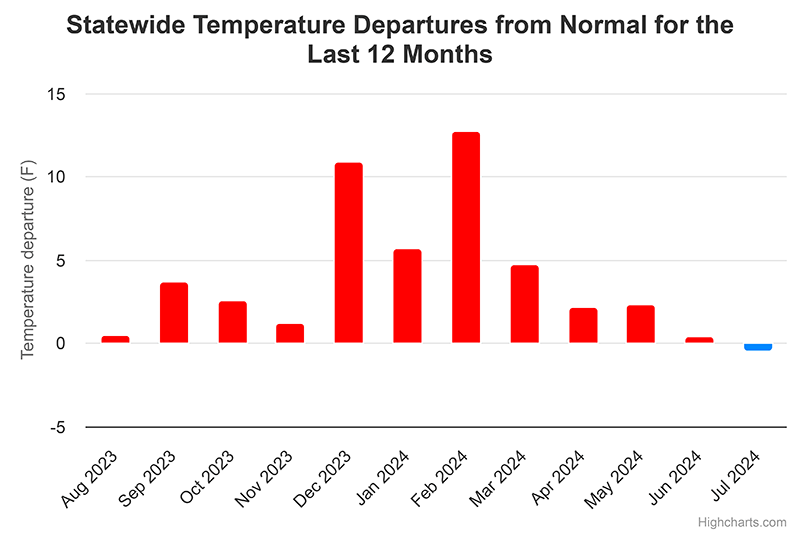
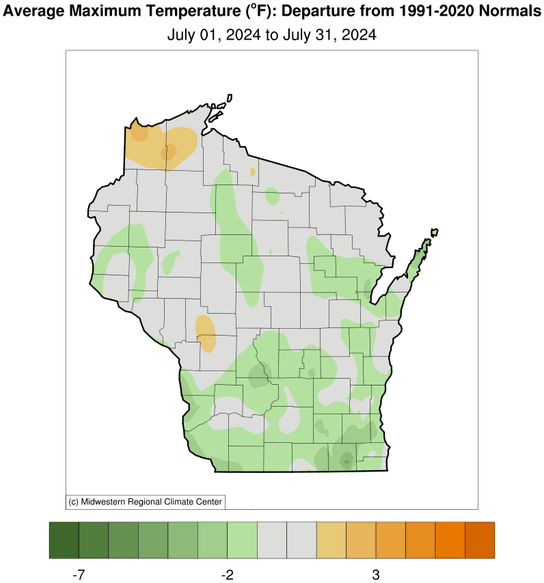
With the variety of temperatures, Wisconsin ended up averaging 68.7 degrees, which was half a degree below normal. This marked Wisconsin’s second month in a row of near normal temperatures, as June averaged only half a degree above normal. Given the pronounced and persistent warmth of recent months, the near-normal conditions the past two months are a welcome change!
Where It Rained, It Poured
Wisconsin saw a statewide average of 4.27 inches of precipitation this July, which was 0.23 inches above normal. This placed July as Wisconsin’s closest-to-normal month, in terms of precipitation, since January (Figure 5).
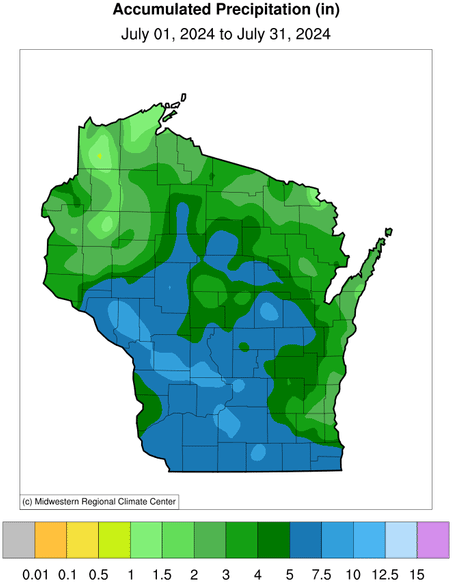
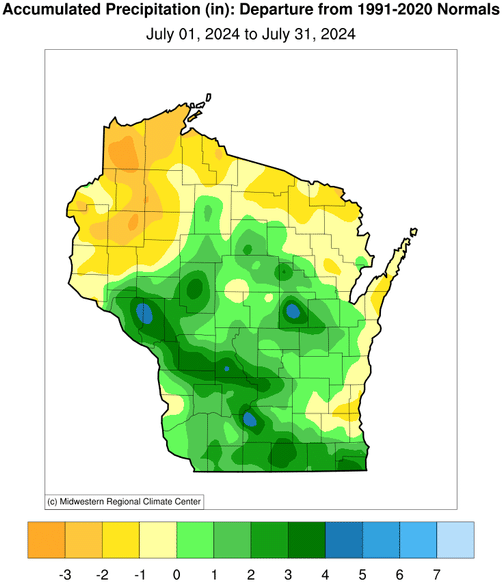
Despite the ordinary statewide precipitation accumulation, where it rained it often poured. The southern two-thirds of Wisconsin saw widespread 5 to 7.5 inches of accumulated precipitation and even a few patches of 7.5 to 10 inches, which ended up being 100 to 200 percent of normal July rainfall (Figure 6). Remarkably, some areas in south-central Wisconsin have received so much precipitation that they are nearing their normal annual precipitation totals.


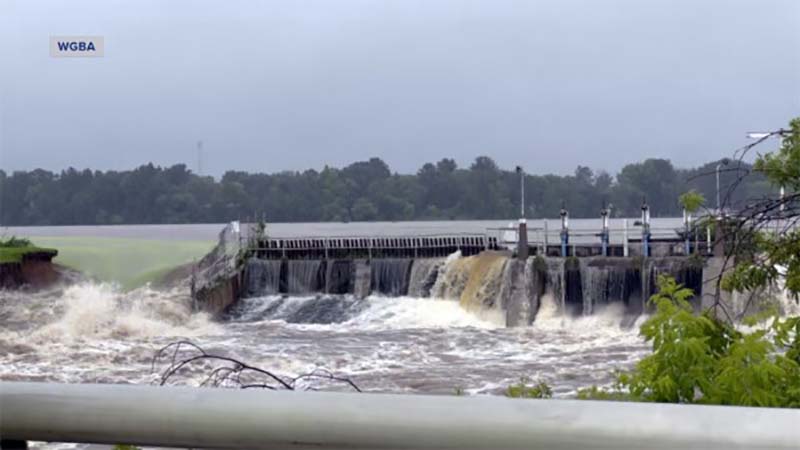
Several rounds of intense rainfall and thunderstorms struck the state. Within the first five days of the month, repeated thunderstorms brought over three inches of rainfall and flash flooding to parts of Wisconsin as well as an EF0 tornado to Medford in Taylor County. The Manawa dam breached along the Little Wolf River in Waupaca County after around 5.7 inches of rain fell over the city of Manawa between 8:30 a.m. and 11:30 a.m. on Friday July 5 (Figure 7).
Following the significant rainfall and associated flooding, damage, and evacuation, Governor Evers declared a State of Emergency in Waupaca, Outagamie, Calumet, and Winnebago Counties on July 12.
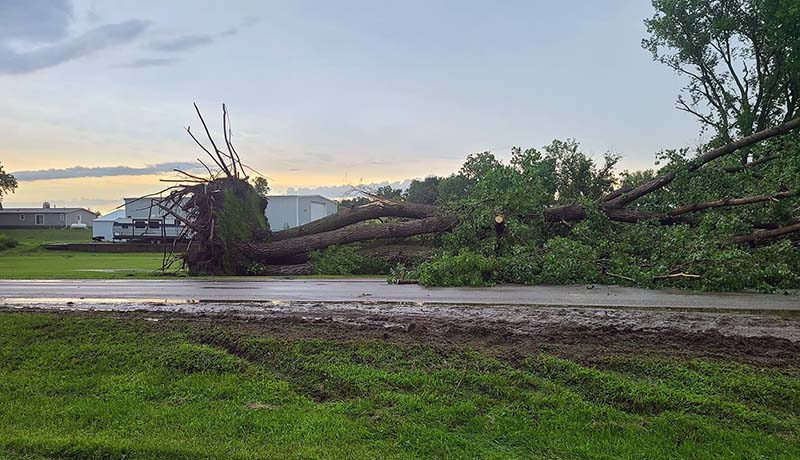
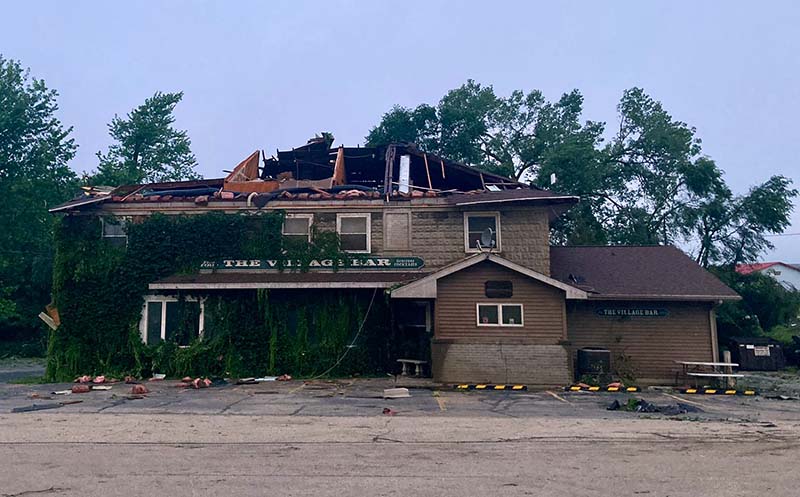
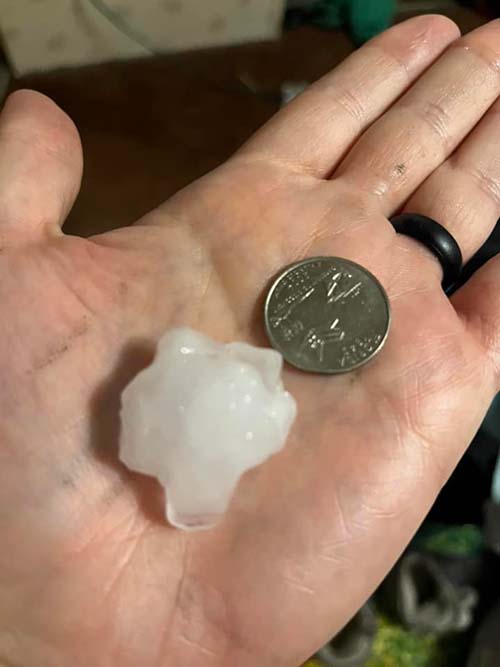
Not long after the State of Emergency was declared, multiple rounds of severe thunderstorms impacted southern Wisconsin from the afternoon of July 13 through the evening of July 15. Seventy-five mile per hour winds uprooted large trees and ripped off a roof on a supper club in Kieler (Figure 8), and large hail of one inch and greater struck Argyle, Belleville, and surrounding areas (Figure 9).
A new record daily rainfall amount of 3.3 inches was set at the Dane County Regional Airport in Madison on July 14, most of which (2.23 inches) fell in a single hour between 6 and 7 p.m. This was Madison’s heaviest one-hour accumulation on record (since 1948). The Madison Fire Department assisted several stranded drivers following the torrential rainfall, and high lake levels overwhelmed Madison’s city infrastructure, leading to flooded streets and homes.
To round out Wisconsin’s share of severe weather, an EF0 and an EF1 tornado hit Evansville and Kieler, respectively, on July 15, bringing Wisconsin’s tornado count to 42 this year through the end of July (Figure 10).

| Date | County | Location | EF rating | Length | Width | Deaths/injuries |
|---|---|---|---|---|---|---|
| Feb. 8 | Green | Albany | 1 | 8.35mi | 50yd | 0/0 |
| Feb. 8 | Rock, Dane, Jefferson | Evansville | 2 | 26.2mi | 750yd | 0/1 |
| May 7 | Walworth | Fontana-On-Geneva | 0 | 5.23mi | 50yd | 0/0 |
| May 7 | Walworth | Darien | 1 | 0.98mi | 50yd | 0/0 |
| May 21 | Buffalo | Cochrane | 1 | 3.93mi | 75yd | 0/0 |
| May 21 | Buffalo | Fountain City | 1 | 2.95mi | 50yd | 0/0 |
| May 21 | Buffalo | Buffalo City | 1 | 2.78mi | 45yd | 0/0 |
| May 21 | Trempealeau | Arcadia | 1 | 0.86mi | 75yd | 0/0 |
| May 21 | Jackson | Alma Center | 1 | 3.14mi | 75yd | 0/0 |
| May 21 | Eau Claire | Augusta | 1 | 9.7mi | 90yd | 0/0 |
| May 21 | Clark | Humbird | 1 | 9.45mi | 300yd | 0/0 |
| May 21 | Clark | Loyal | 0 | 12.3mi | 100yd | 0/0 |
| May 21 | Clark | Greenwood | 1 | 4.24mi | 150yd | 0/0 |
| May 21 | Clark | Loyal2 | 0 | 6.22mi | 75yd | 0/0 |
| May 21 | Clark, Marathon | Unity | 1 | 3.53mi | 65yd | 0/0 |
| May 21 | Marathon | Fenwood | 1 | 2.11mi | 60yd | 0/0 |
| May 21 | Dane | Springdale | 1 | 4.74mi | 75yd | 0/0 |
| May 21 | Marathon | Edgar | 1 | 2.13mi | 80yd | 0/0 |
| May 21 | Marquette | Neshkoro | 1 | 5.27mi | 60yd | 0/0 |
| May 21 | Outagamie | Kaukauna | 1 | 2.68mi | 80yd | 0/0 |
| May 21 | Door | Washington Island | 1 | 2.28mi | 90yd | 0/0 |
| May 26 | Rock | Milton | 0 | 12.2mi | 50yd | 0/0 |
| May 26 | Rock, Jefferson | Lima Center | 0 | 15mi | 50yd | 0/0 |
| May 26 | Jefferson | Lake Koshkonong | 0 | 5.57mi | 30yd | 0/0 |
| June 17 | Clark | Greenwood | 0 | 0.42mi | 25yd | 0/0 |
| June 17 | Clark, Taylor | Withee | 1 | 0.91mi | 45yd | 0/0 |
| June 17 | Clark, Marathon | Colby | 0 | 0.83mi | 46yd | 0/0 |
| June 18 | Polk | Dresser | 1 | 4.99mi | 100yd | 0/0 |
| June 22 | Grant | Tennyson | 0 | 0.16mi | 40yd | 0/0 |
| June 22 | Lafayette | Belmont | 0 | 5.6mi | 75yd | 0/0 |
| June 22 | Lafayette, Green | Argyle | 2 | 6.94mi | 500yd | 0/0 |
| June 22 | Dane, Jefferson | Marshall | 1 | 4.58mi | 300yd | 0/0 |
| June 22 | Jefferson | Watertown | 1 | 2.07mi | 150yd | 0/0 |
| June 22 | Rock | Janesville | 2 | 6.21mi | 700yd | 0/0 |
| June 22 | Walworth | Williams Bay | 1 | 6.07mi | 150yd | 0/0 |
| June 22 | Walworth | Fontana | 1 | 5.31mi | 100yd | 0/0 |
| June 22 | Kenosha | Powers Lake | 0 | 1.42mi | 40yd | 0/0 |
| June 24 | Menominee, Oconto | Keshena | 1 | 8.96mi | 83yd | 0/0 |
| July 5 | Taylor | Medford | 0 | 1mi | 40yd | 0/0 |
| July 15 | Grant | Kieler | 1 | 0.29mi | 30yd | 0/0 |
| July 15 | Rock | Evansville | 0 | 1.23mi | 50yd | 0/0 |
On the flip side, the northern third of the state and the Lake Michigan coast did not see as much precipitation and ended the month with from one to five inches, or just 25 to 100 percent of normal. Unfortunately for northern Wisconsin, abnormally dry (D0) conditions returned as a result of its dry July (Figure 11).


Outlook
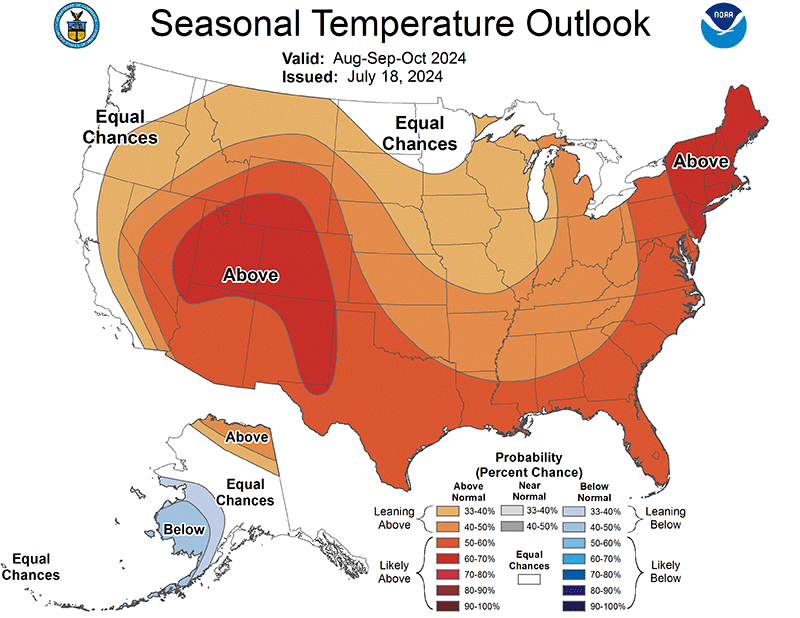
Rounding out the summer and entering fall, Wisconsin’s chances of seeing warmer than normal temperatures are slightly greater than near or below normal conditions. However, there is no strong indication of whether or how precipitation will differ from near-normal conditions (Figure 12).
On a global scale, it is expected that the neutral phase of the El Niño Southern Oscillation (ENSO) will continue for the rest of the summer, with the typically cooler phase, La Niña, favored to emerge between September and November (66 percent chance) and persist through the Northern Hemisphere winter (74 percent chance). At this time, it is uncertain just how strong the La Niña phase will be; however, Wisconsin and the rest of North America feel the strongest impacts of ENSO during winter.

Climate Corner
While many areas of the nation have been sweltering for most of this summer with record high temperatures and elevated humidity, Wisconsin has had a relatively pleasant summer compared to other states and to previous years. Over the last 132 years of daily maximum temperature record-keeping between observers and automated weather stations, Wisconsin’s highest temperature recorded was 114 degrees on July 13, 1936 in the Wisconsin Dells.
Nearly 74 percent of the state’s weather stations have recorded temperatures of at least 100 degrees at some point, but in recent years, fewer stations have reached this mark, particularly since 2000. As of early August, the highest temperature this year was 97 degrees at Kenosha Regional Airport on June 17.
High humidity levels, which contribute to the heat index, have also been significant. The heat index indicates how hot it feels when temperature and humidity are combined. High heat indices can lead to severe health issues like heat stroke or exhaustion. The highest recorded heat index in Wisconsin was 124 degrees at the Kenosha Regional Airport in July 1999.
This summer, Wisconsin has had relatively mild conditions, with the highest heat index recorded at 108 degrees in Kenosha on June 25. Despite the generally comfortable conditions this summer, Wisconsin’s summer still reflects the increasing concerns over high temperature and humidity levels.
Steve Vavrus is the Wisconsin state climatologist. Bridgette Mason and Ed Hopkins are the assistant state climatologists.