County Overview
Langlade County is located in the northeastern part of Wisconsin. The county’s land cover is primarily a blend of forests, grasslands, and wetlands. The southern part of the county also contains a large amount of agricultural land, especially around the city of Antigo. Langlade County has a humid continental climate, characterized by precipitation year-round and summers that are warm to hot.
Climate Averages
| Season | High Temperature | Low Temperature | Precipitation | Snowfall* |
|---|---|---|---|---|
| Winter | 25.4°F | 7.8°F | 3.7″ | 35.5″ |
| Spring | 52.1°F | 28.7°F | 8.4″ | 15.8″ |
| Summer | 76.5°F | 53.0°F | 12.1″ | — |
| Fall | 54.8°F | 34.9°F | 8.0″ | 4.8″ |
| Annual | 52.2°F | 31.1°F | 32.2″ | 56.1″ |
Averages for all variables in this table are computed for the most recent 30 years (1996-2025; Source: NCEI Climate at a Glance).
*Snowfall averages are computed by averaging station-level data, as NCEI does not provide county-level snowfall averages (Source: ACIS).
Seasons: Winter (Dec-Feb); Spring (Mar-May); Summer (Jun-Aug); Fall (Sep-Nov)
Climate Records
Hottest Recorded Temperature
101°F
(Antigo, July 11, 1936)
Coldest Recorded Temperature
-42°F
(Koepenick, January 7, 1912)
Record 1-Day Rainfall
5.16″
(Antigo, August 22, 1959)
Record 1-Day Snowfall
22.5″
(White Lake, March 16, 2026)
Records are computed using all available station data, some of which goes back to 1895 (Source: ACIS).
First & Last Freeze Dates
Average Last Hard Freeze
(28°F)
May 4
Average Last Freeze
(32°F)
May 15
Average First Freeze
(32°F)
September 28
Average First Hard Freeze
(28°F)
October 9
Averages for freeze dates are computed for the most recent 30 years (1995-2024; Source: ACIS).
Temperature
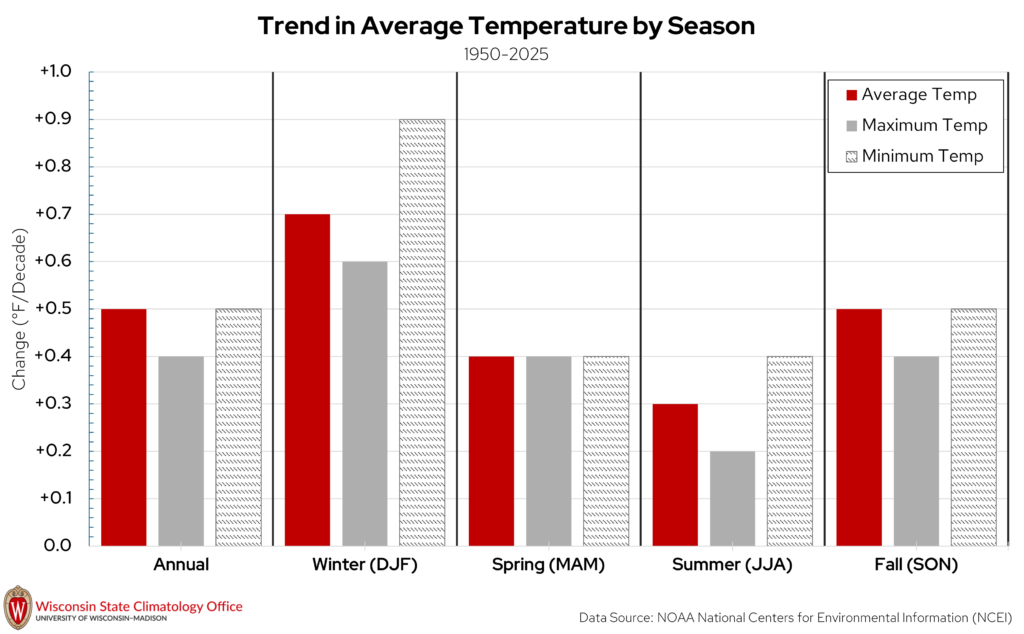
Temperatures have been increasing since 1950 in Langlade County on the annual and seasonal time scales, which is the case for most of Wisconsin. Since 1950, annual average temperatures in Langlade County have increased at a rate of 0.5°F/decade, which translates to an increase of 1°F every 20 years. This increase in temperature has been most pronounced in the winter months and less pronounced in the other seasons. When annual average temperatures are split into daily high and low temperatures, low temperatures have been warming at a faster rate compared to high temperatures. In particular, winter minimum temperatures have been increasing by 1°F every 11 years since 1950.
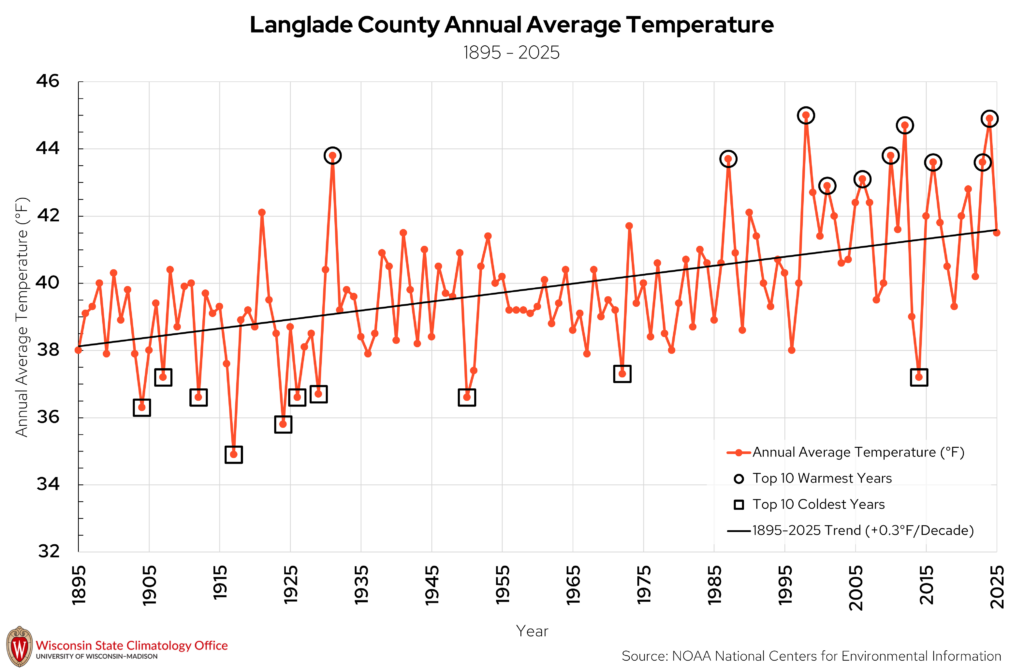
With temperatures warming, this does not mean that every year will be warmer than the last, or that more recent years will all have above-average (1895-2025) temperatures. However, Langlade County is experiencing more years that are above average than it did in the past. For example, since 2000, Langlade County has experienced only four years with below-average temperatures. Similarly, if we rank the top ten warmest years in Langlade County since 1895 (black circles on the above chart), seven have occurred since 2000, with 1998 also in the top ten. The top ten coldest years (black squares) are a bit more spread out over time, with just one of the top ten years occurring since 2000.
Precipitation
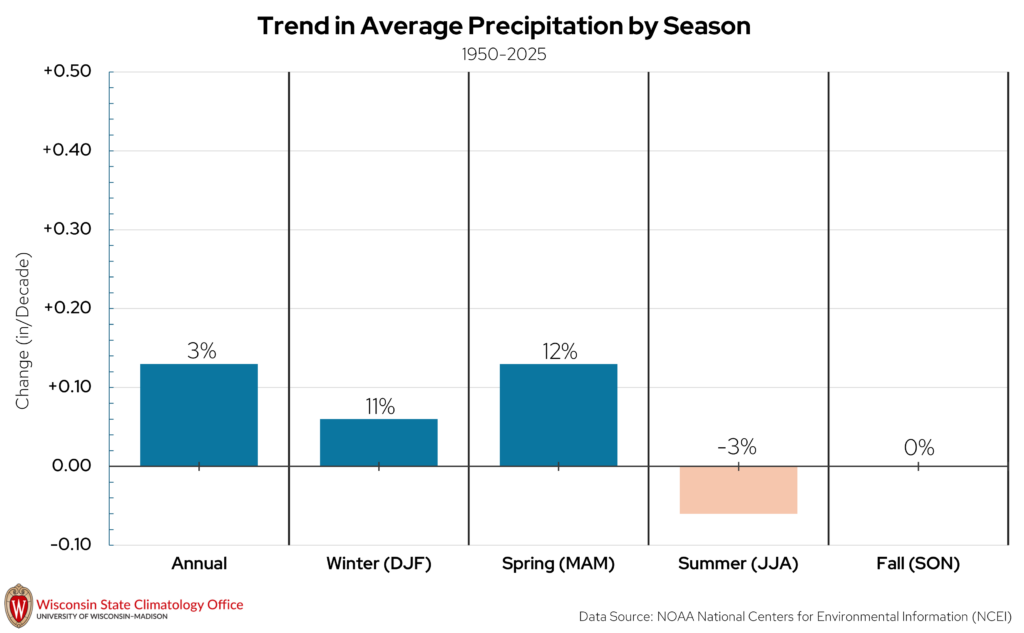
On the annual timescale, precipitation has shown minimal change in Langlade County since 1950. Precipitation has increased at a rate of 0.13″ per decade, which means an increase of one inch every 77 years. At the seasonal level, summer and fall have experienced little to no change in precipitation since 1950. Spring is the season of largest increase in precipitation in terms of inches (0.13″ per decade) and percentage (12 percent).
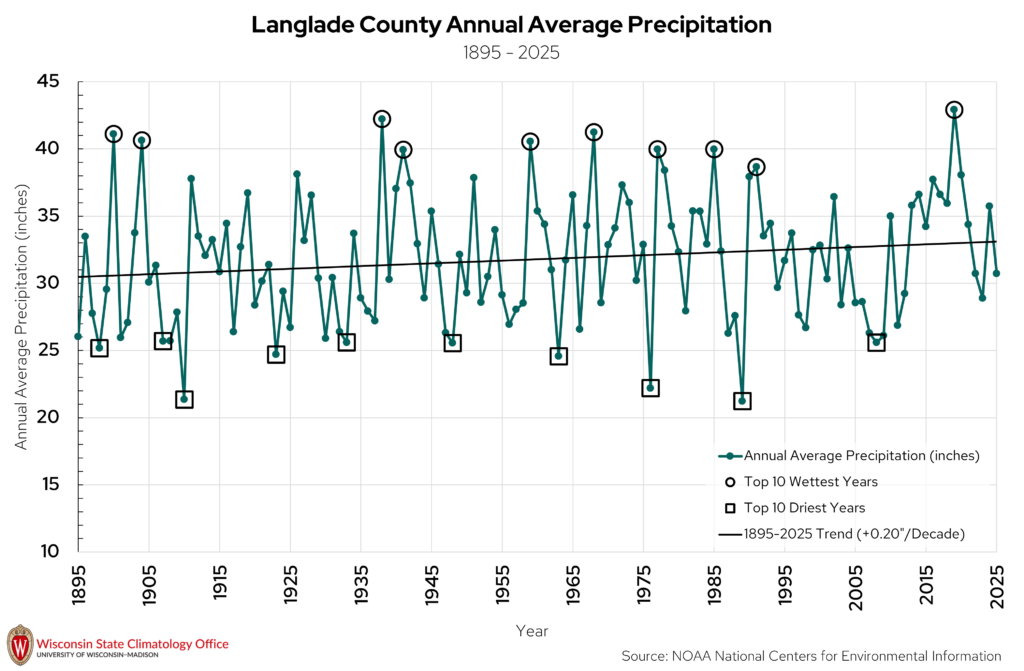
Looking at the full record from 1895 to 2025, annual precipitation has increased overall (one inch approximately every 50 years). However, unlike the top ten warmest years on record, the top ten wettest years on record are not clustered towards more-recent years. This mix of wet and dry years is normal within a long-term trend. Since 2000, for example, the county has had one of its wettest years on record (2019), but it has also seen ten years with below-average precipitation. This year-to-year variability in annual precipitation points to the usefulness of long-term data sets when looking at climate trends.
Extreme Heat
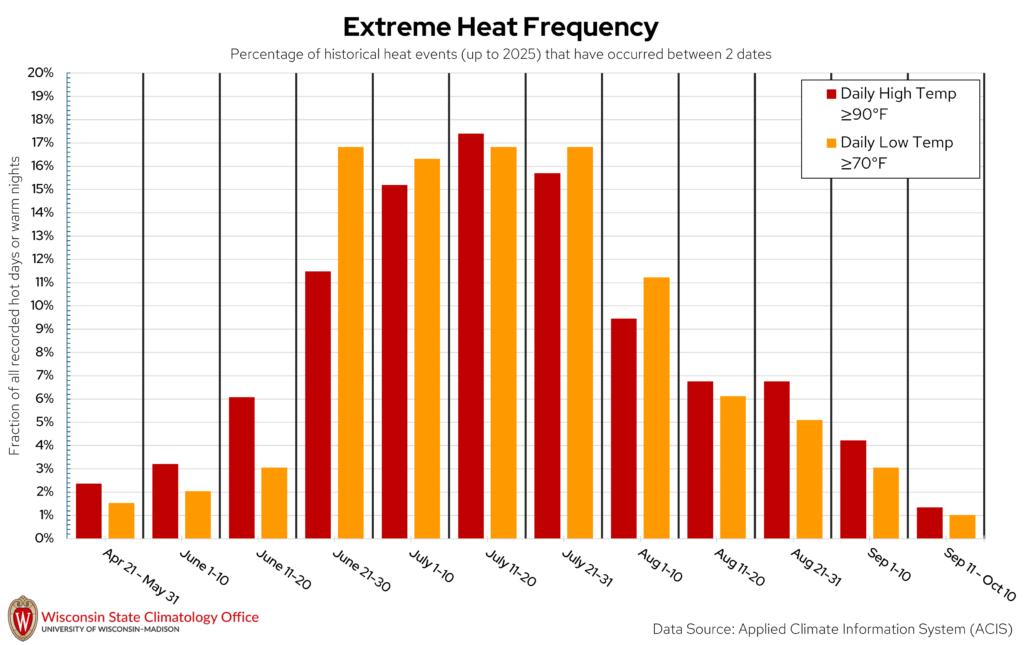
Despite being one of Wisconsin’s northern counties, Langlade County is no stranger to sweltering summer heat, where daytime temperatures can top 90°F or even 100°F. But when are these hot days most likely to occur in Langlade County? The State Climatology Office analyzed the likelihood of a “hot day” (daily high temperature ≥ 90°F) or “warm night” (daily low temperature ≥ 70°F) occurring between two calendar dates using historical measured temperature data from NOAA stations in Langlade County. Based on this analysis, hot days have occurred most frequently between July 11 to 20. Over the past 20 years (2006-2025), Langlade County experiences, on average, two hot days per year. Warm nights are less common in Langlade County, with an average of one warm night occurring every two years. Warm nights most frequently occur between June 21 and July 31.
Have Langlade County summers been getting hotter? Since 1950, summertime average temperatures have warmed by about 2°F, but have not warmed as much compared to other seasons in Langlade County. Summertime low temperatures have warmed by about 3°F since 1950. By comparison, summer high temperatures in Langlade County have not warmed as much (1.5°F). Also, the hottest temperature of the year in Langlade County has not shown a warming trend between 1950 and 2025. You can read more about trends in summertime temperatures in Wisconsin in this blog post.
Extreme Cold
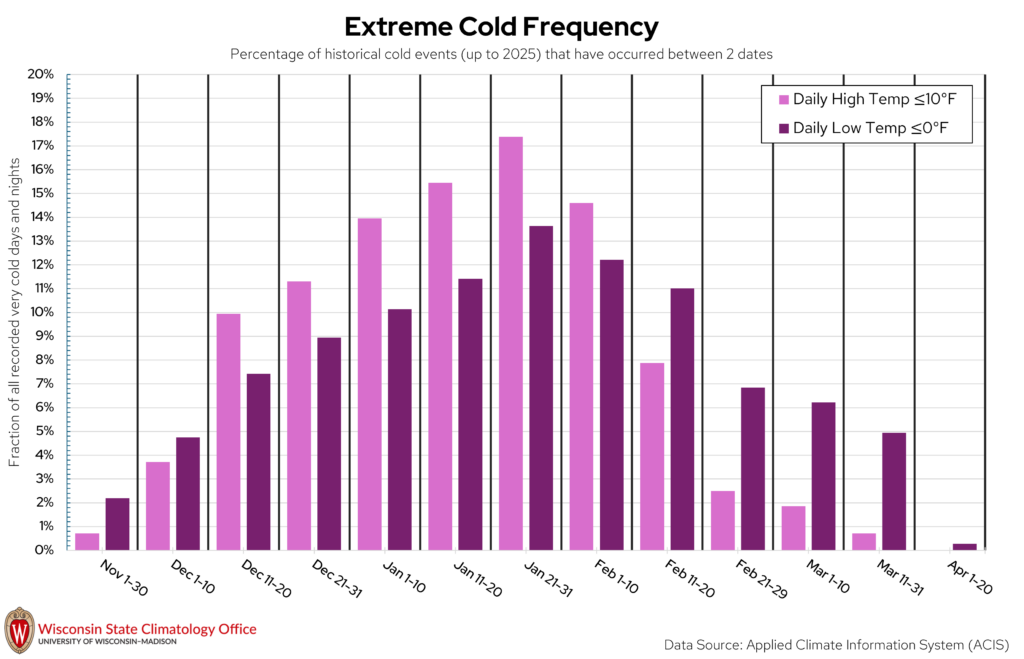
Langlade County can get quite chilly once winter rolls around! Some of our coldest days of the year in Wisconsin are when the overnight low temperatures dip below 0°F. The State Climatology Office performed an analysis on the likelihood of a “very cold day” (daily high temperature ≤ 10°F) or “very cold night” (daily low temperature ≤ 0°F) occurring between two calendar dates using historical measured temperature data from NOAA stations in Langlade County. Based on this analysis, very cold days and nights have occurred most frequently between January 21 to 31. Over the past 20 years (2006-2025), Langlade County experienced, on average, 12 very cold days per year and 33 very cold nights per year.
Across all four seasons, winter has warmed the most in Langlade County since 1950, a trend that holds true across most of Wisconsin. Since 1950, average winter temperatures in Langlade County have warmed by 5-6°F. Over this same time period, low temperatures in winter have warmed a bit more than the average temperatures (approximately 7°F). The coldest temperature of the year in Langlade County has shown a slight warming trend since 1950.
Precipitation Extremes
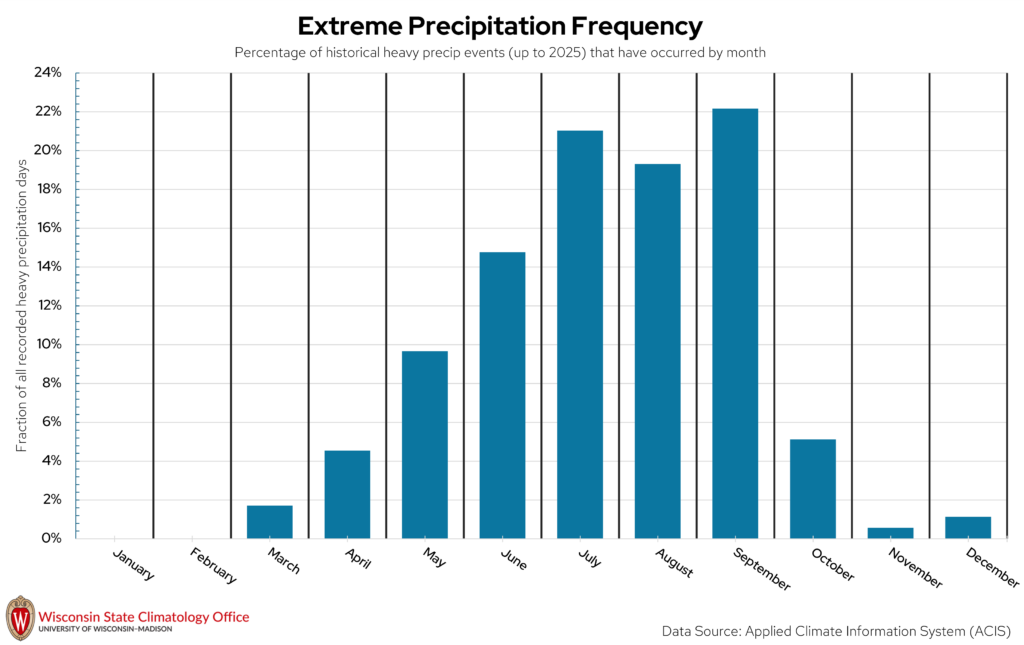
Heavy precipitation days, which for this publication refers to a one-day liquid precipitation total of two inches or more, can impact Langlade County at all times of the year. Extreme precipitation in the winter is measured by the amount of liquid that would be present if you melted down all of the snow that fell that day. The vast majority of these heavy precipitation days (77 percent) have occurred from June through September. September is the month that has historically had the most heavy precipitation days in Langlade County. In general, summer is the wettest season in Langlade County, with winter being the driest season. Over the past 20 years (2006-2025), the county experienced, on average, six heavy precipitation days per decade.
Hazards Summary
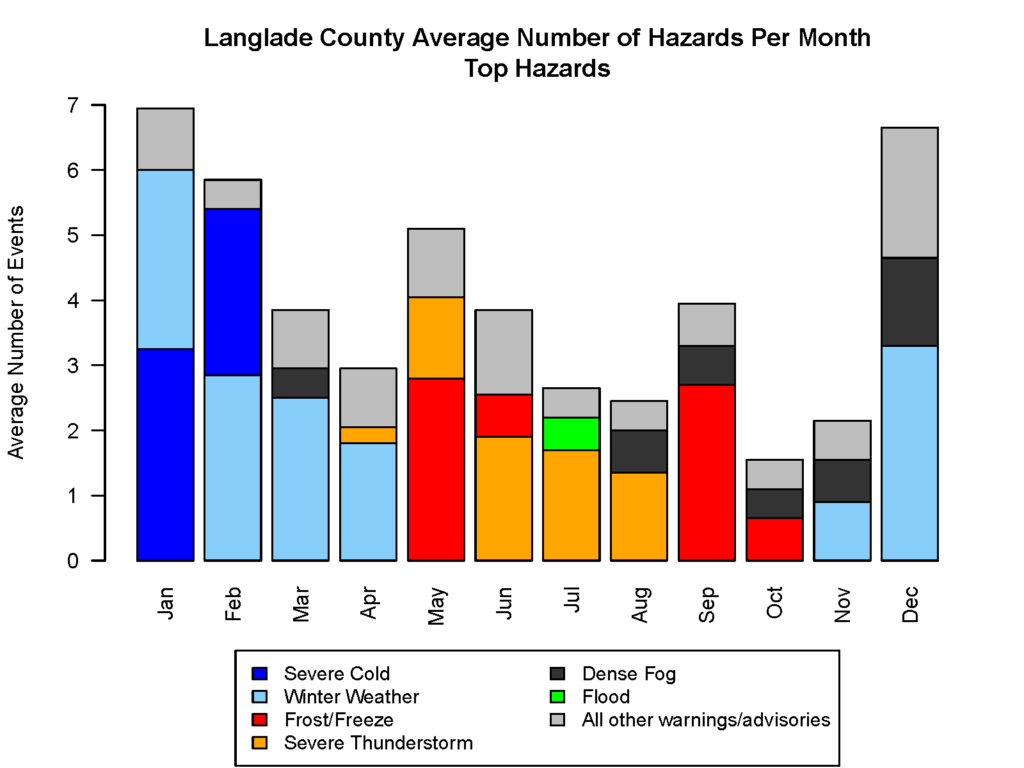
Langlade County deals with an array of hazardous weather throughout the year, and the type of hazards vary from season to season. The bar chart and table above are summaries of warnings and advisories issued by the National Weather Service for Langlade County over the past 21 years (2005-2025). Looking at hazards by month/season, the months of November through April are characterized by snow events, severe cold, and dense fog. Severe thunderstorms and flooding are more common in the spring through summer. Frost advisories and freeze warnings are most common in May, June, September, and October as these are the times of year when we are transitioning into or out of the growing season, and plants are susceptible to frost. Overall, the most common hazards in a year in Langlade County are winter weather, severe cold, and frost/freeze events. Tornadoes are less common, with one tornado warning issued per year for the county, on average.
Hazard Type |
On average, how many does Langlade County have each year? |
| Winter Weather | 14 |
| Severe Cold | 7 |
| Frost/Freeze | 7 |
| Severe Thunderstorm | 7 |
| Dense Fog | 5 |
| High Wind | 2 |
| Flood | 2 |
| Ice Accumulation | 1 |
| Tornado Warning | 1 |
| Fire Weather | 0.5 |
| High Heat | 0.4 |
Looking Ahead
Future climate projections from the Wisconsin Initiative on Climate Change Impacts (WICCI) indicate that by mid-century (2041-2060), under a moderate greenhouse gas emissions scenario, average annual temperatures in Langlade County will continue to increase by approximately 4°F compared to recent averages. Winter is projected to continue to be the season of the largest temperature increase (about 5°F). The number of nights where temperatures drop below 0°F is expected to decrease as winters warm (15-20 nights per year), and the number of nights in summer with temperatures staying above 70°F is expected to increase. The frequency of days that top 90°F is projected to increase with a warming climate to 15-20 days per year.
Annual precipitation is expected to increase by around five percent by mid-century, according to WICCI projections. Winter and spring are projected to be the seasons of greatest precipitation increase in Langlade County (about 10 percent), with summers projected to be 5 percent drier by mid-century. Despite projections for drier summers, the frequency of heavy precipitation days (two inches or more) is projected to increase by mid-century.
To explore more climate projections from WICCI and learn more about future climate modeling, please visit this website.
Want more information?
The data in this publication are a snapshot of the historical climate data for Langlade County. If you have questions about this publication or would like more data on a topic, please contact the Wisconsin State Climatology Office.
For more information about how climate affects your farm, community, health, and livelihood, please check out resources from the Division of Extension and the Wisconsin Initiative on Climate Change Impacts.