It was a warm, wet, and windy March across Wisconsin, with unseasonably high temperatures, frequent bouts of heavy precipitation, and powerful winds signaling an energetic start to spring.
Climate Statistics by Division
To view a summary of key climate statistics for each of Wisconsin’s nine climate divisions, check out the detailed table at the end of this report. This table includes average temperature, heating degree days, total precipitation, and snowfall. For each variable, you’ll find both the observed March values and how they compared to the long-term average from 1991 to 2020. These comparisons help highlight where the month was warmer, cooler, wetter, or drier than usual.
Off the Charts Warmth
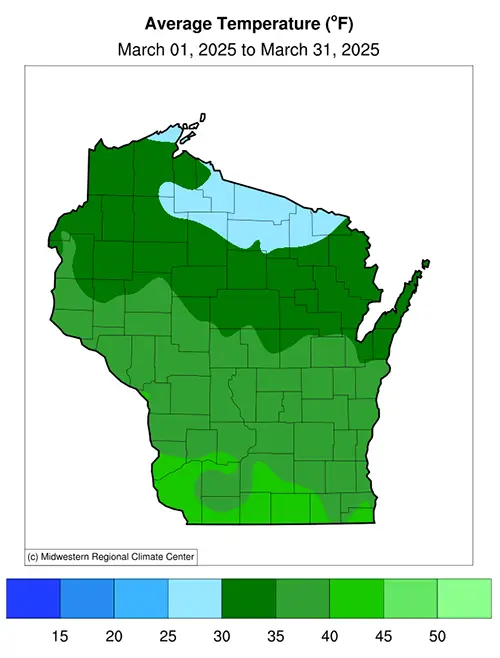
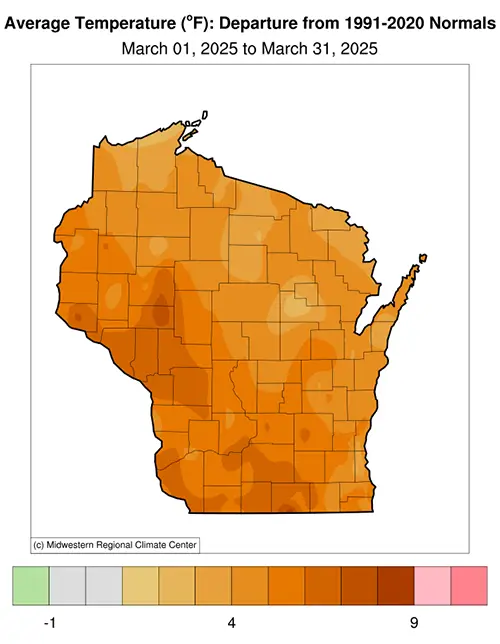
March was unseasonably warm across Wisconsin, with most days bringing above-normal temperatures and several record-breaking highs. By the end of the month, the statewide average temperature of 35.5 degrees was five degrees above normal, representing the 12th warmest March on record. The northern and eastern portions of the state averaged three to five degrees above normal, while the western and southern portions averaged five to seven degrees above normal (Figure 1).
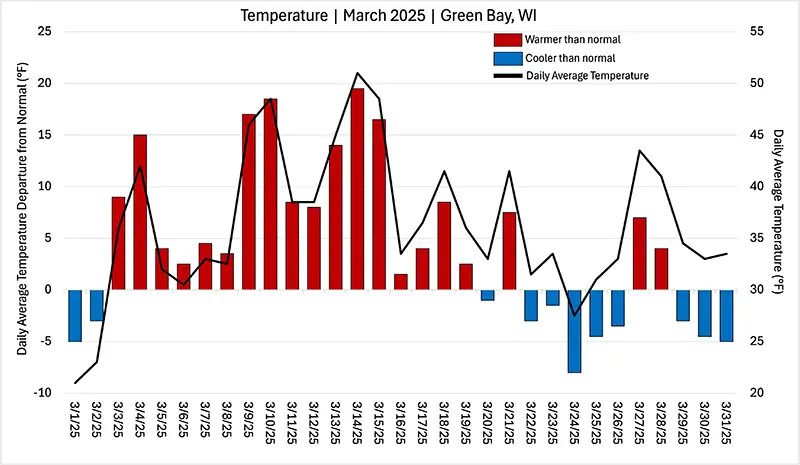
A look at the daily average temperatures from Green Bay highlights the frequent and sometimes dramatic departures above normal (Figure 2). Unlike a typical March, which often features cold-air outbreaks as winter transitions to spring, this month lacked a single true Arctic blast — a stark contrast to what we experienced in January and February.
Three days stood out for record-setting warm days. Notably, on March 10, five of Wisconsin’s six first-order weather stations ( Eau Claire, Green Bay, La Crosse, Madison, Milwaukee, and Wausau) set new daily high temperature records (Table 1). On March 14, Eau Claire reached 79 degrees, breaking the previous daily record of 76 degrees set in 2012. On March 28, Madison hit 78 degrees, surpassing the old record of 76 degrees set in 1986, 1946, and 1910. Milwaukee reached 77 degrees, breaking the 1905 record of 76 degrees. La Crosse soared to 86 degrees, setting a new daily and all-time March record. This also marked the warmest La Crosse has been that early in the season, previously set on April 10, 1930 (91 degrees).
| Location | New record in degrees Fahrenheit |
Previous record in degrees Fahrenheit (year) |
|---|---|---|
| Madison | 67 | 66 (1894) |
| La Crosse | 72 | 67 (1894) |
| Eau Claire | 69 | 64 (2012) |
| Green Bay | 65 | 62 (1894) |
| Wausau | 66 | 61 (2012) |
From Dry to Drenched
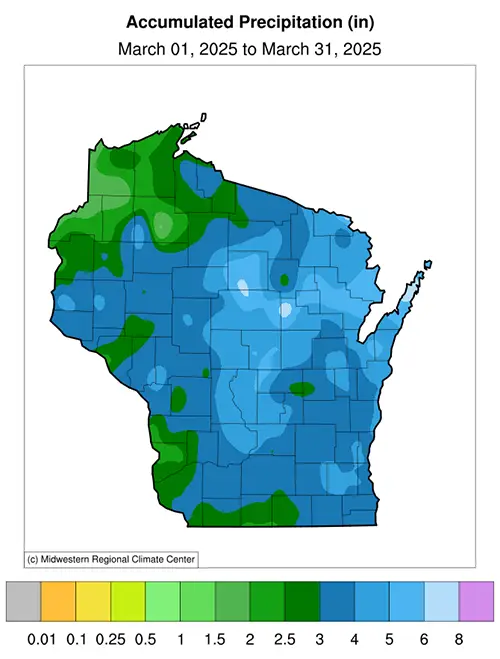
Last month was the fifth wettest March on record for Wisconsin, with statewide precipitation (rain plus melted snowfall) totaling 3.61 inches — nearly double the normal amount Wisconsin sees in March (1.79 inches above normal). The far northwestern and southwestern parts of the state saw between an inch and a half and three inches of precipitation, and parts of central and northeastern Wisconsin saw five to six inches (Figure 3).
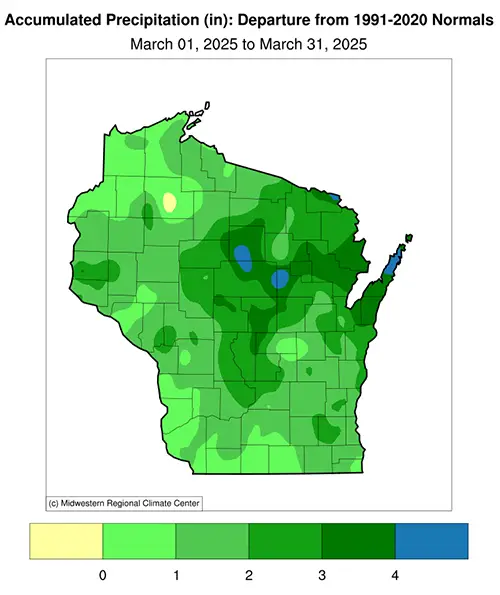
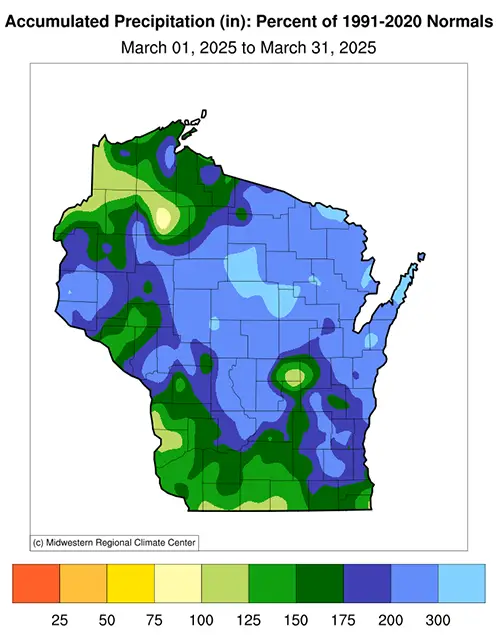
Almost the entire state saw above-normal precipitation in March — central Sawyer County was the lone exception. Much of Wisconsin received more than double the usual amount, and some counties in the north-northeastern part of the state, including Lincoln, Marathon, Shawano, and Door Counties, picked up over three times their normal totals.
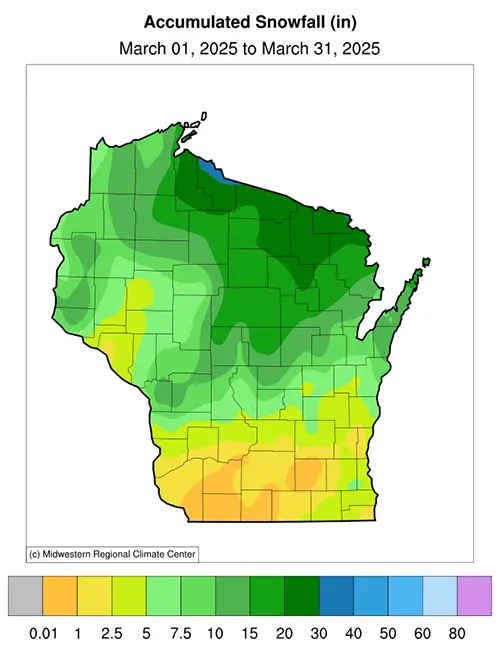
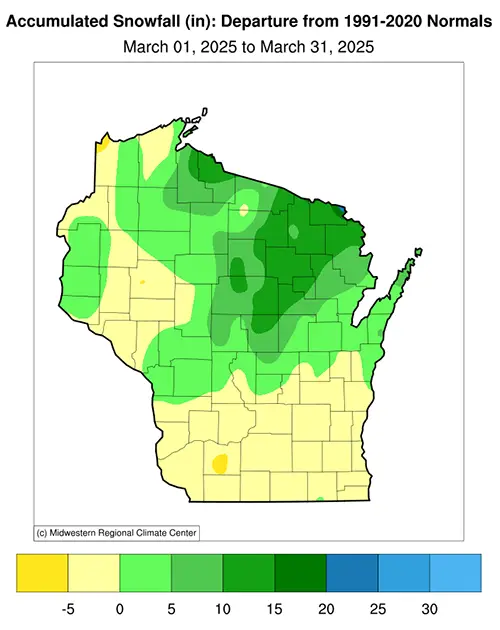
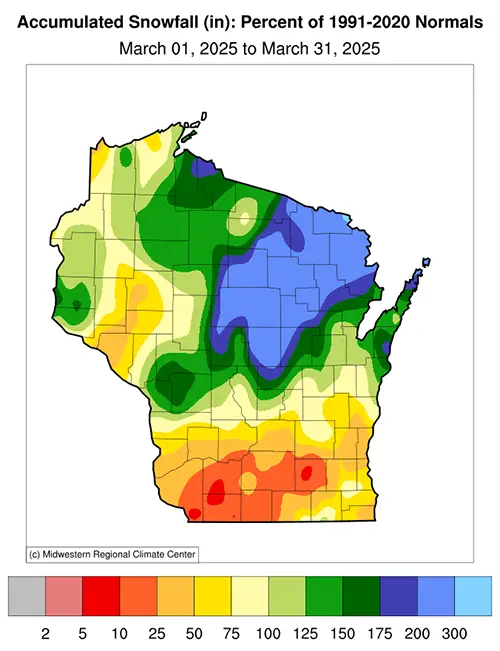
By the end of the month, snowfall had also made a notable impact in central and northern Wisconsin. While fewer than five inches of snow fell across the south (less than 75 percent of normal March snowfall), between five and thirty inches fell farther north, boosting monthly totals to as much as twice the March average (Figure 4). By contrast, those in far northwestern Wisconsin received less than 75 percent of the normal snowfall.
Incredibly, more precipitation fell in March alone than during the entire winter (December to February total was only 2.33 inches), underscoring the extreme month-to-month and season-to-season variability in Wisconsin’s precipitation pattern, a trend that has become increasingly common since the beginning of 2023.
Turning the Tide on Drought
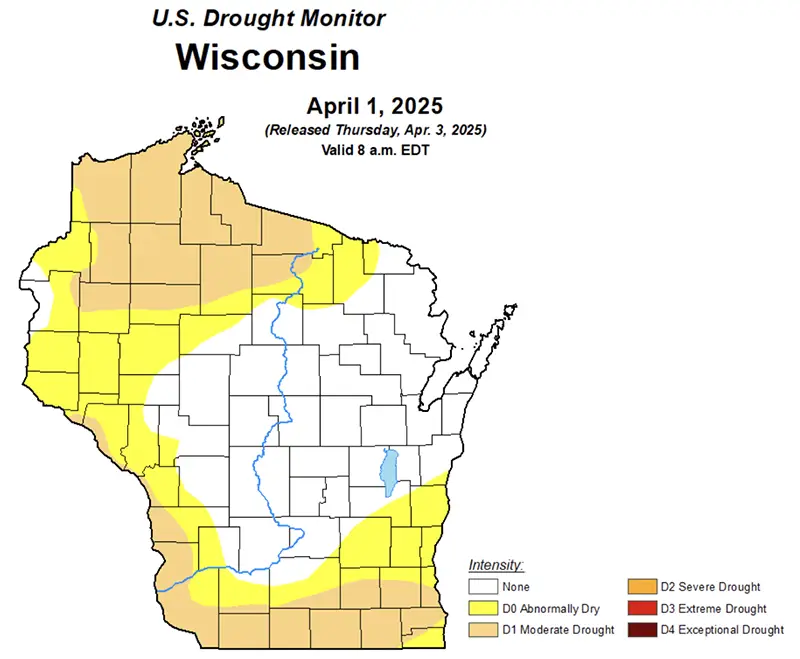
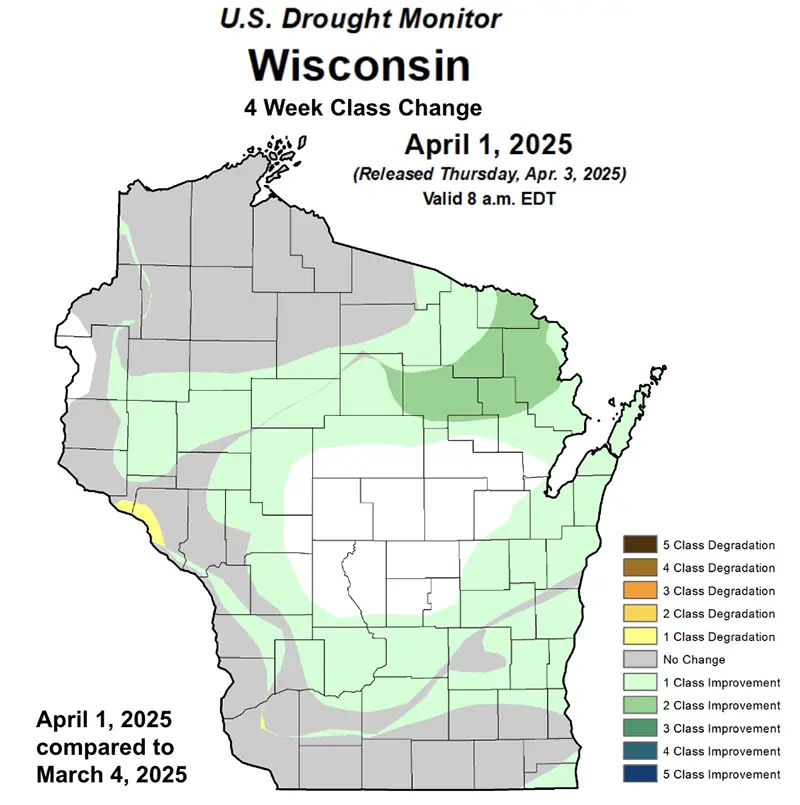
March brought a dynamic shift in Wisconsin’s drought conditions, with notable improvements across much of the state thanks to multiple rounds of heavy precipitation. Early to mid-month, abnormally dry conditions (D0) and moderate drought (D1) persisted across much of southern and northern Wisconsin. However, by late March, eastern Wisconsin saw drought levels decline, while additional rainfall and late-season snow helped ease drought conditions in western and northwestern Wisconsin (Figure 5).
Some of the most significant improvements occurred in southern Wisconsin, where heavy precipitation minimized long-term deficits and brought precipitation levels back to near normal for this point in the year. This improvement is also reflected in the Drought Severity Coverage Index (DSCI), which tracks the extent and intensity of drought conditions averaged statewide (Figure 6).
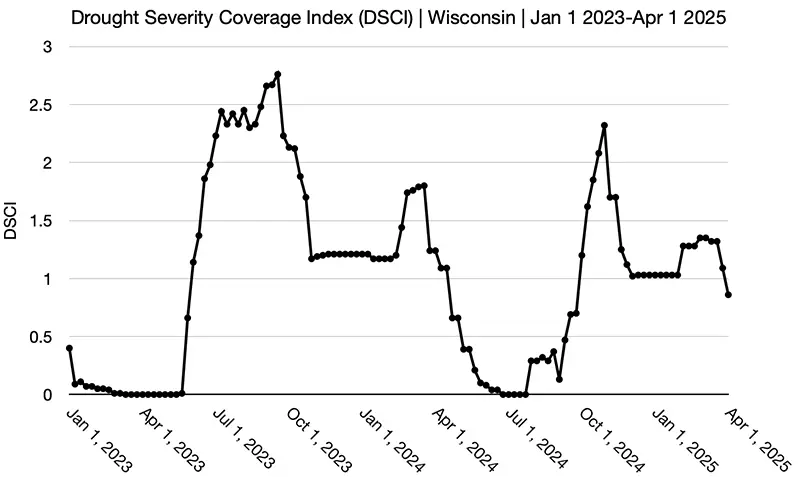
After peaking in early winter, the DSCI declined steadily through March, illustrating the widespread reduction in drought severity. Despite these improvements, the moderate drought in northern Wisconsin still reflects persistent precipitation shortfalls, particularly in snowfall, which remained below average throughout the winter season.
The lingering dry conditions earlier in the month contributed to elevated fire risk, highlighted by a 750-acre wildfire in Green Lake County on March 18. The fire, fueled by dry cattails and marsh grass, spread rapidly under warm, dry, and windy conditions. This was just one of 123 wildfires that burned a total of 1,146 acres across Wisconsin between March 1 and 18.
Fortunately, no structures were lost and there were no reported injuries, but it served as a stark reminder of the impacts of long-term dryness in parts of the state. Fire activity decreased significantly after mid-month, with 81 fires burning just 107 acres between March 19 and 31, reflecting the increased precipitation and improving moisture conditions.
Thunderstorms, Ice Storms, and Snow – Oh My!
As Wisconsin transitioned into spring, March delivered a relentless mix of severe thunderstorms, record-breaking precipitation, heavy snow, and damaging ice. A potent storm on March 4 and 5 brought nearly two inches of rain to the east and up to a foot of snow in the north, with 54 mile per hour wind gusts in Wausau (Marathon County). Another round of storms March 14 to 16 produced damaging winds, including a 75 mile per hour gust in Janesville (Rock County).
A complex system on March 19 brought six to ten inches of snow and blizzard-like conditions in central and northeastern areas and thunderstorms and a lightning-sparked fire to the south. Days later, on March 23, Wausau set a daily snowfall record with 7.1 inches.
The month ended with a stretch of intense weather, including hail up to 1.25 inches in Plover and South Range (Portage and Douglas Counties) and a crippling ice storm. Ice accumulations of 0.25 to 0.6 inches took down trees and left thousands without power for several days, prompting a state of emergency. The storm closed the month with multiple daily precipitation records, including 1.95 inches in Rhinelander on March 30 — more than double the previous record (Table 2).
| Location | Date | New record in inches |
Previous record in inches (year) |
|---|---|---|---|
| Marshfield | March 29, 2025 | 1.04 | 0.88 (1938) |
| Wisconsin Rapids | March 30, 2025 | 1.05 | 1.00 (1982) |
| Wausau | March 30, 2025 | 1.14 | 0.65 (2013) |
| Rhinelander | March 30, 2025 | 1.95 | 0.84 (1938) |
A Windy Month
March didn’t just feel blustery — it was one of the gustiest on record in Wisconsin. Here, we are talking about wind gusts that are sudden peaks in wind speed measured over a five-second span. This differs from the sustained two-minute average wind speed that is typically used in weather and climatology reports. Preliminary data show that Milwaukee experienced its gustiest March on record, with a 34.2 mile per hour average gust and 18 days where gusts reached at least 30 miles per hour — the highest in Brew City’s history (dating back to 1973).
Madison logged its second-gustiest March with a 29.5 mile per hour average gust and 14 days over 30 miles per hour, just one day shy of the all-time record. Across all six of Wisconsin’s first-order stations, March ranked either first or second for average wind gusts — a striking signal of how widespread and intense the wind was (Table 3).
While some caution is warranted in comparing records across decades due to changes in instrumentation and reporting, the consistency across multiple weather stations — and the sharp uptick in recent years — echoes a refrain heard more often: It feels windier than it used to.
March Monthly Average Wind Gusts (mph)
| Location | 1973-2025 | 2025 | Rank |
|---|---|---|---|
| Milwaukee | 25.0 | 34.2 | 1 |
| Green Bay | 20.4 | 30.7 | 1 |
| La Crosse | 18.8 | 30.0 | 1 |
| Wausau | 19.4 | 28.3 | 1 |
| Madison | 22.5 | 29.5 | 2 |
| Eau Claire | 19.1 | 28.5 | 2 |
Days with Wind Gusts at Least 30 mph
| Location | 1973-2025 | 2025 | Rank |
|---|---|---|---|
| Milwaukee | 9.3 | 18 | 1 |
| Green Bay | 6.1 | 17 | 1 |
| La Crosse | 4.6 | 15 | 1 |
| Wausau | 4.1 | 14 | 1 |
| Madison | 6.3 | 14 | 2 |
| Eau Claire | 3.8 | 11 | 2 |
Farm Conditions
Over the past month, farmers closely monitored changing conditions as spring approached. The shift from a dry winter to a wet spring eased concerns about moisture conservation, but made proper fieldwork timing essential, particularly for fertilization to prevent nutrient loss and avoid compaction and rutting in saturated areas. As they prepared for fieldwork, farmers kept an eye on 4-inch soil temperatures to track the thawing of the soil and determine when conditions would support equipment and early crop growth. Overwintered and newly planted crops remained vulnerable to freeze damage, with the last hard freeze typically occurring in mid-April in the south and early May in the north.
The late-March ice storm hit trees the hardest, likely affecting fruit crops and vineyards. Additionally, impacts to overwintering row crops are a potential concern due to the possibility of ice sheeting, where a layer of ice could have formed over the ground. Though crop-specific damage reports from this storm have been scarce, yield reductions may become evident in the coming weeks and months.
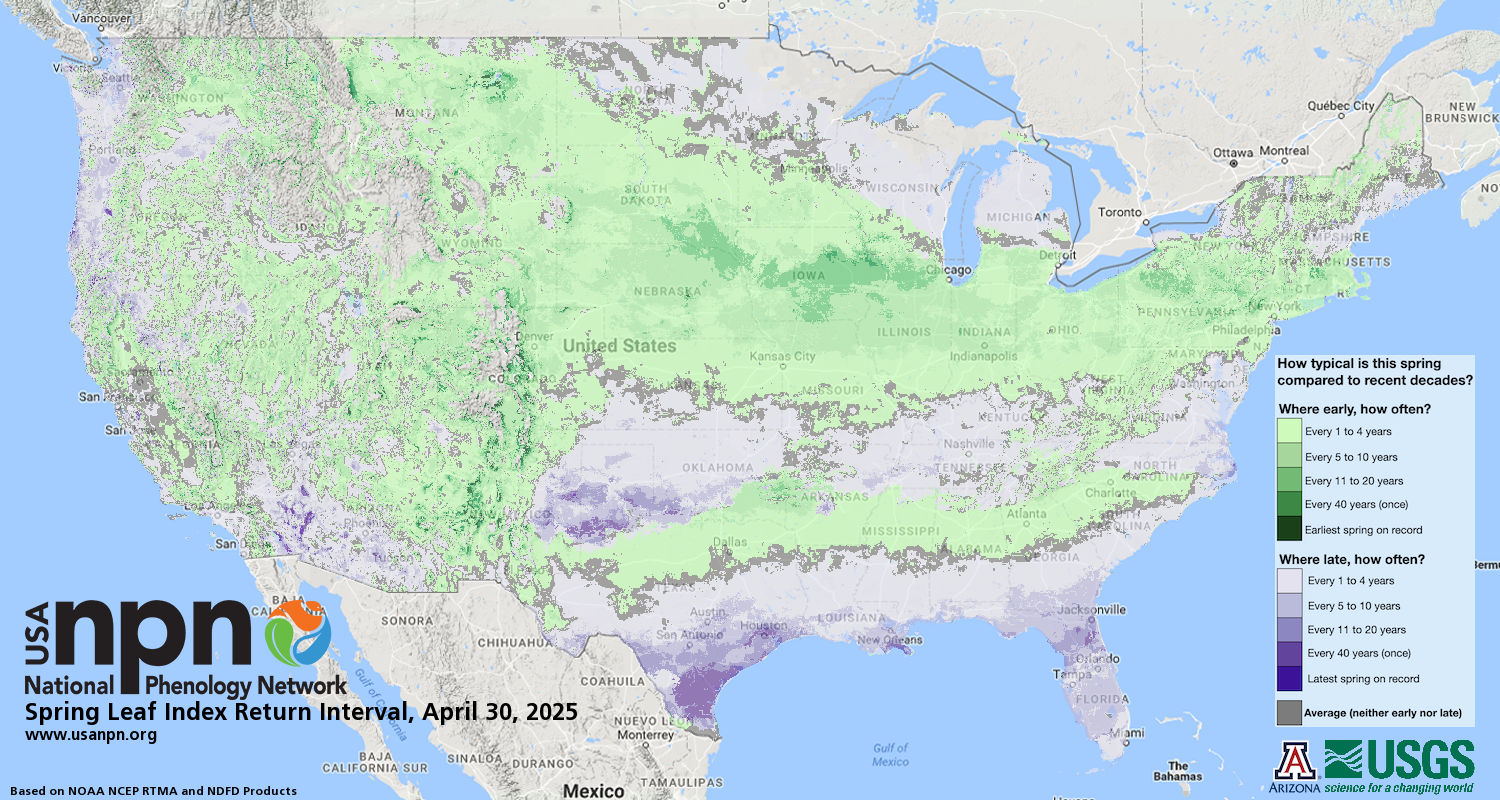
According to the USA National Phenology Network, by the end of March, trees and plants in far southern Wisconsin showed signs of “leaf out” — the development and expansion of leaves after winter dormancy — marking the very start of the growing season in the south. Given the warmer-than-normal conditions in March, this earlier-than-normal activity in the southern part of the state suggests that leaf out for the rest of Wisconsin may advance earlier than usual in the weeks ahead.
Gone Too Soon
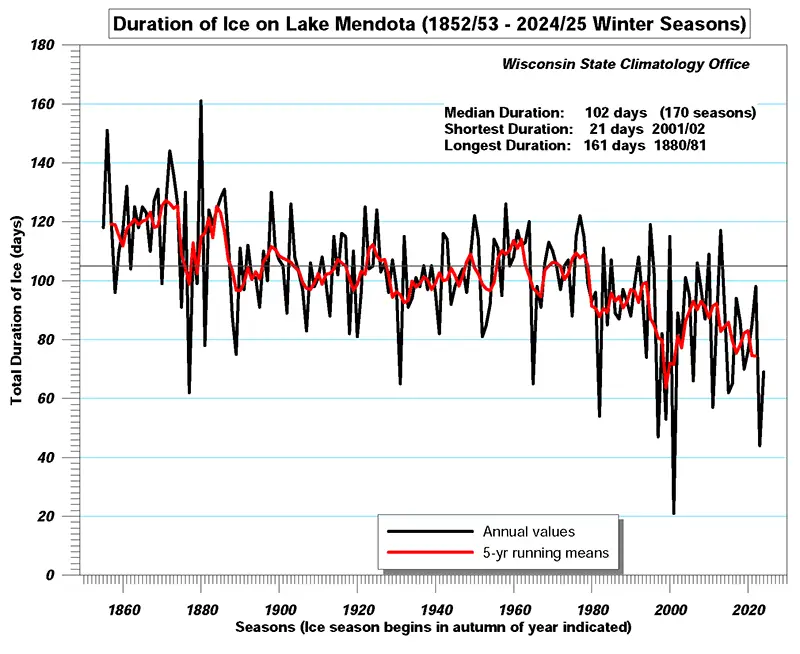
Lake ice disappeared early again this year in Madison, with Lakes Mendota and Monona declared ice-free on March 15 and Wingra on March 11. That is weeks ahead of the long-term medians — April 4 for Mendota, March 30 for Monona, and March 25 for Wingra. In fact, since 2000, over half of Mendota’s ice-off dates have happened in March, a stark shift from the 19th and 20th centuries, when the lake typically stayed frozen into April.
This season, Mendota saw just 69 days of ice cover — well below its median of 102. Monona had 79 days (median: 103) and Wingra held out the longest at 100 days (median: 113). While these lake ice durations weren’t record-setting lows, they continue a trend of shorter ice seasons (Figure 7). The shrinking duration of lake ice is one more sign of Wisconsin’s warming winters in recent years.
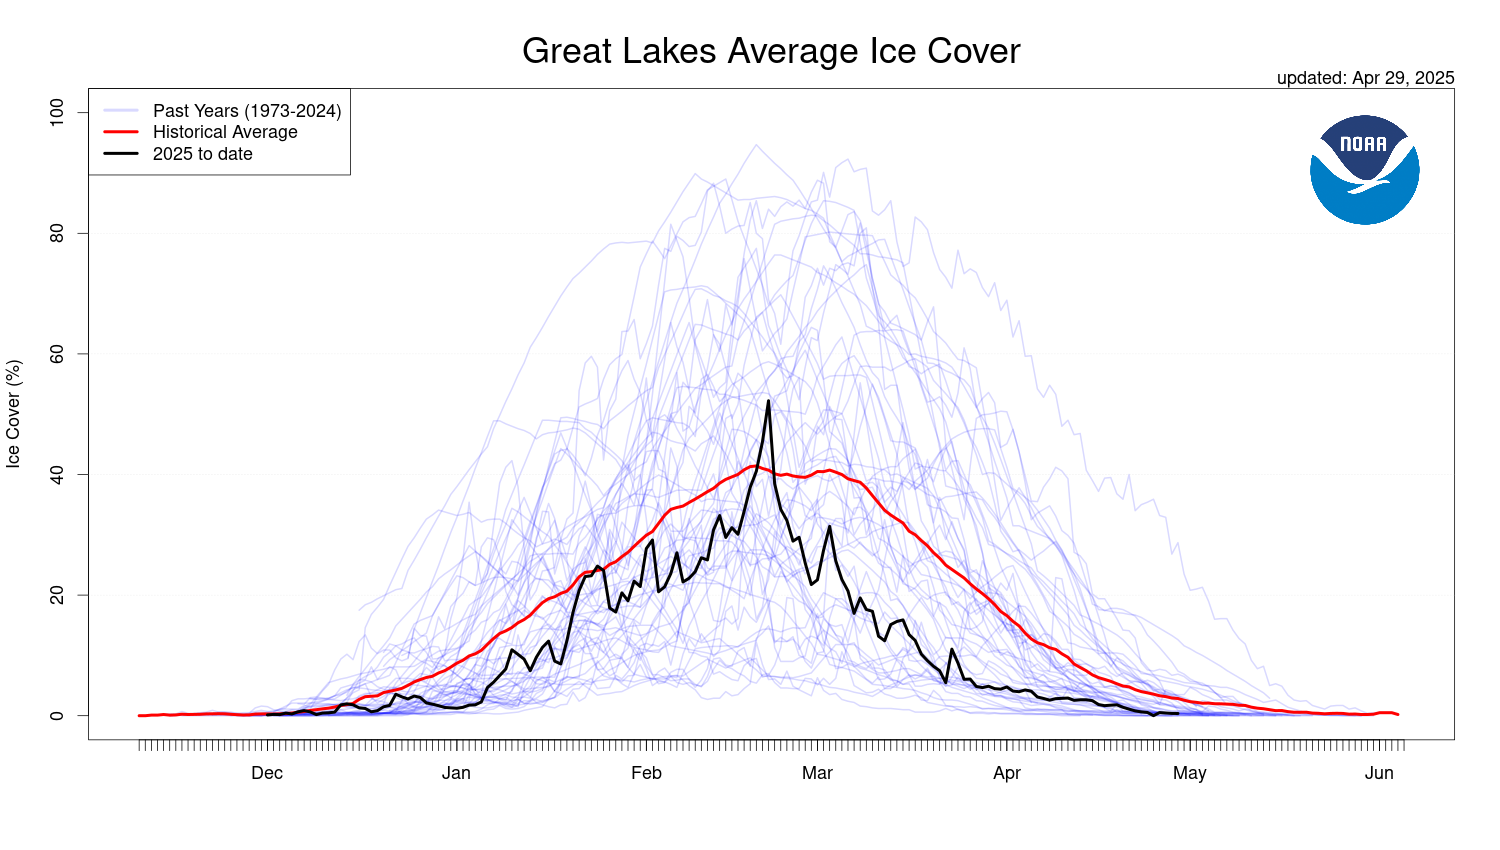
Great Lakes ice cover continued its sharp seasonal decline through March, driven by daytime temperatures above freezing and increasing sunshine. Unlike January and February, no cold snaps arrived to temporarily rebuild ice, allowing the melt to accelerate steadily throughout the month. Ice coverage remained well below average across the basin, as seen in the Great Lakes Average Ice Cover time series and this animation provided by NOAA’s CoastWatch and the Great Lakes Environmental Research Laboratory. This trend was especially noticeable on Lake Michigan and Lake Superior. By the end of March, Green Bay and the stretch of Lake Superior from Saxon Harbor to the town of Superior were nearly completely ice-free, underscoring just how limited this season’s ice presence has been.
Outlook
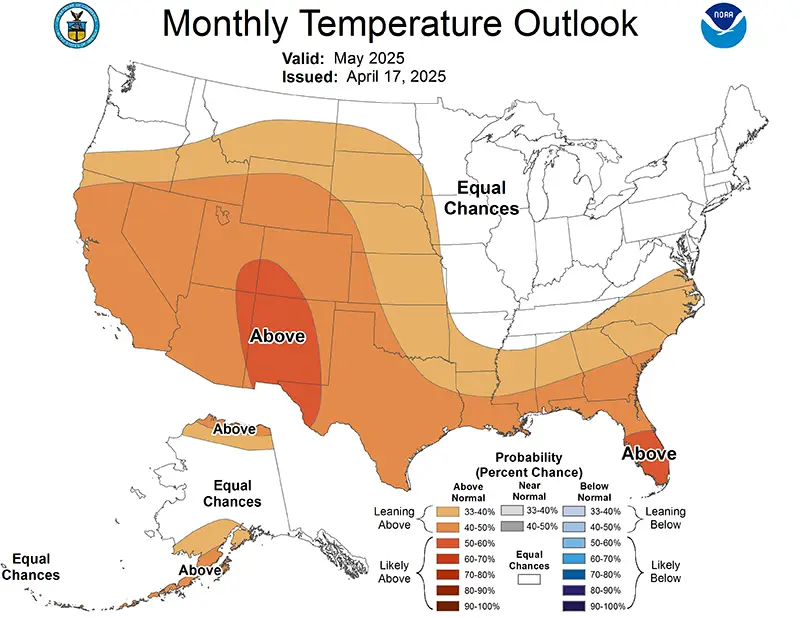
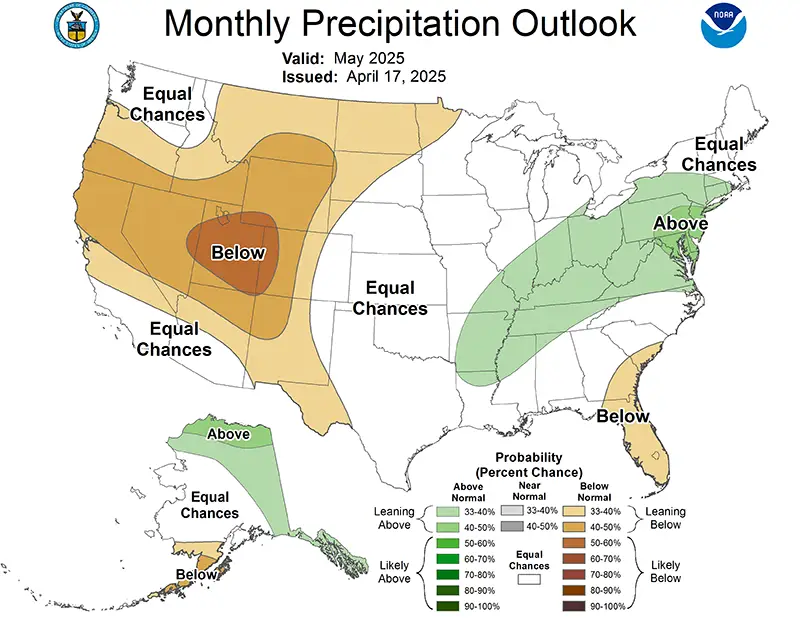
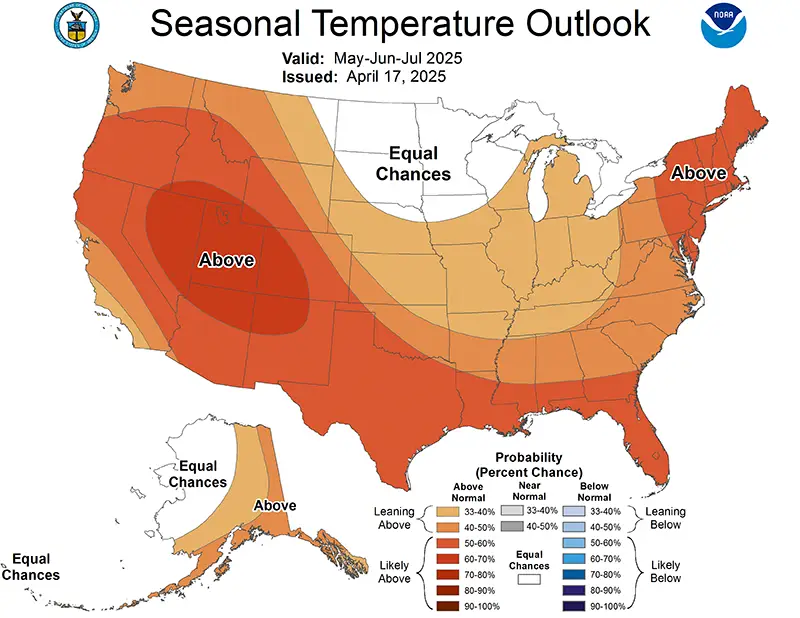
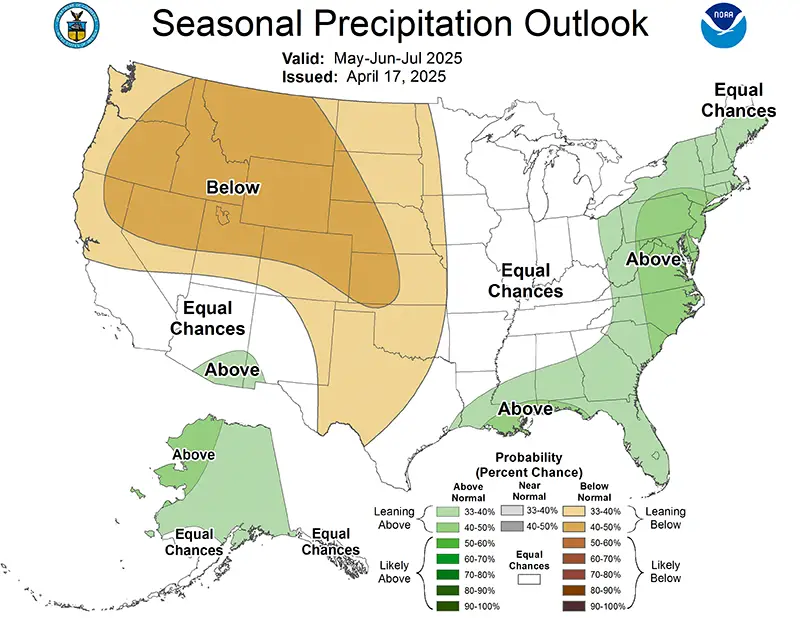
Looking ahead to May, there are equal chances of above-, near-, or below-normal temperatures and precipitation across Wisconsin (Figure 8). This pattern continues for precipitation statewide until July (Figure 9). In areas from Crawford County to Marinette County and points north and west, there are equal chances to see above-, near-, or below-normal temperatures through July. Chances lean slightly toward warmer-than-normal for southern and eastern Wisconsin.
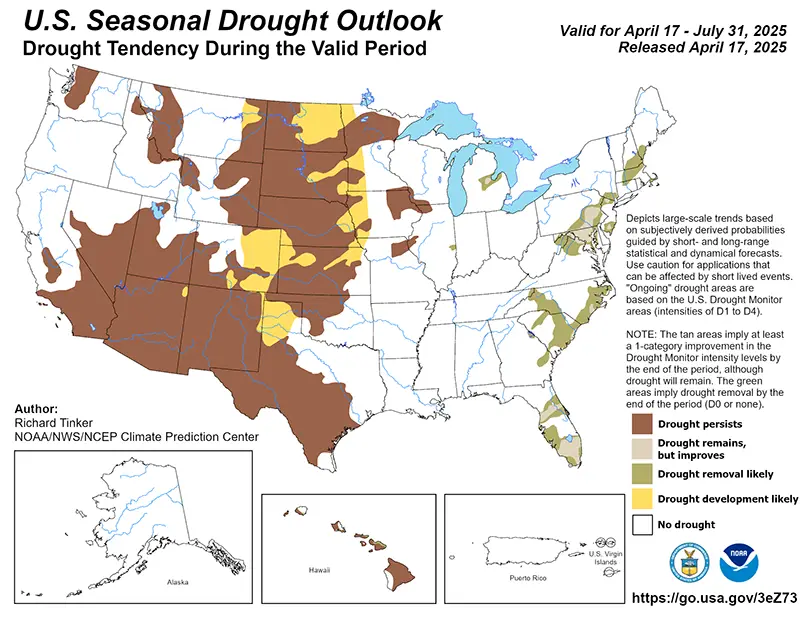
Meanwhile, drought may persist from southwestern to south-central Wisconsin, particularly in areas like Vernon to Green County where long-term precipitation deficits remain (Figure 10). However, spring rains could gradually chip away at those deficits and support some recovery.
Climate Corner
Q: When’s the right time to start your garden in Wisconsin?
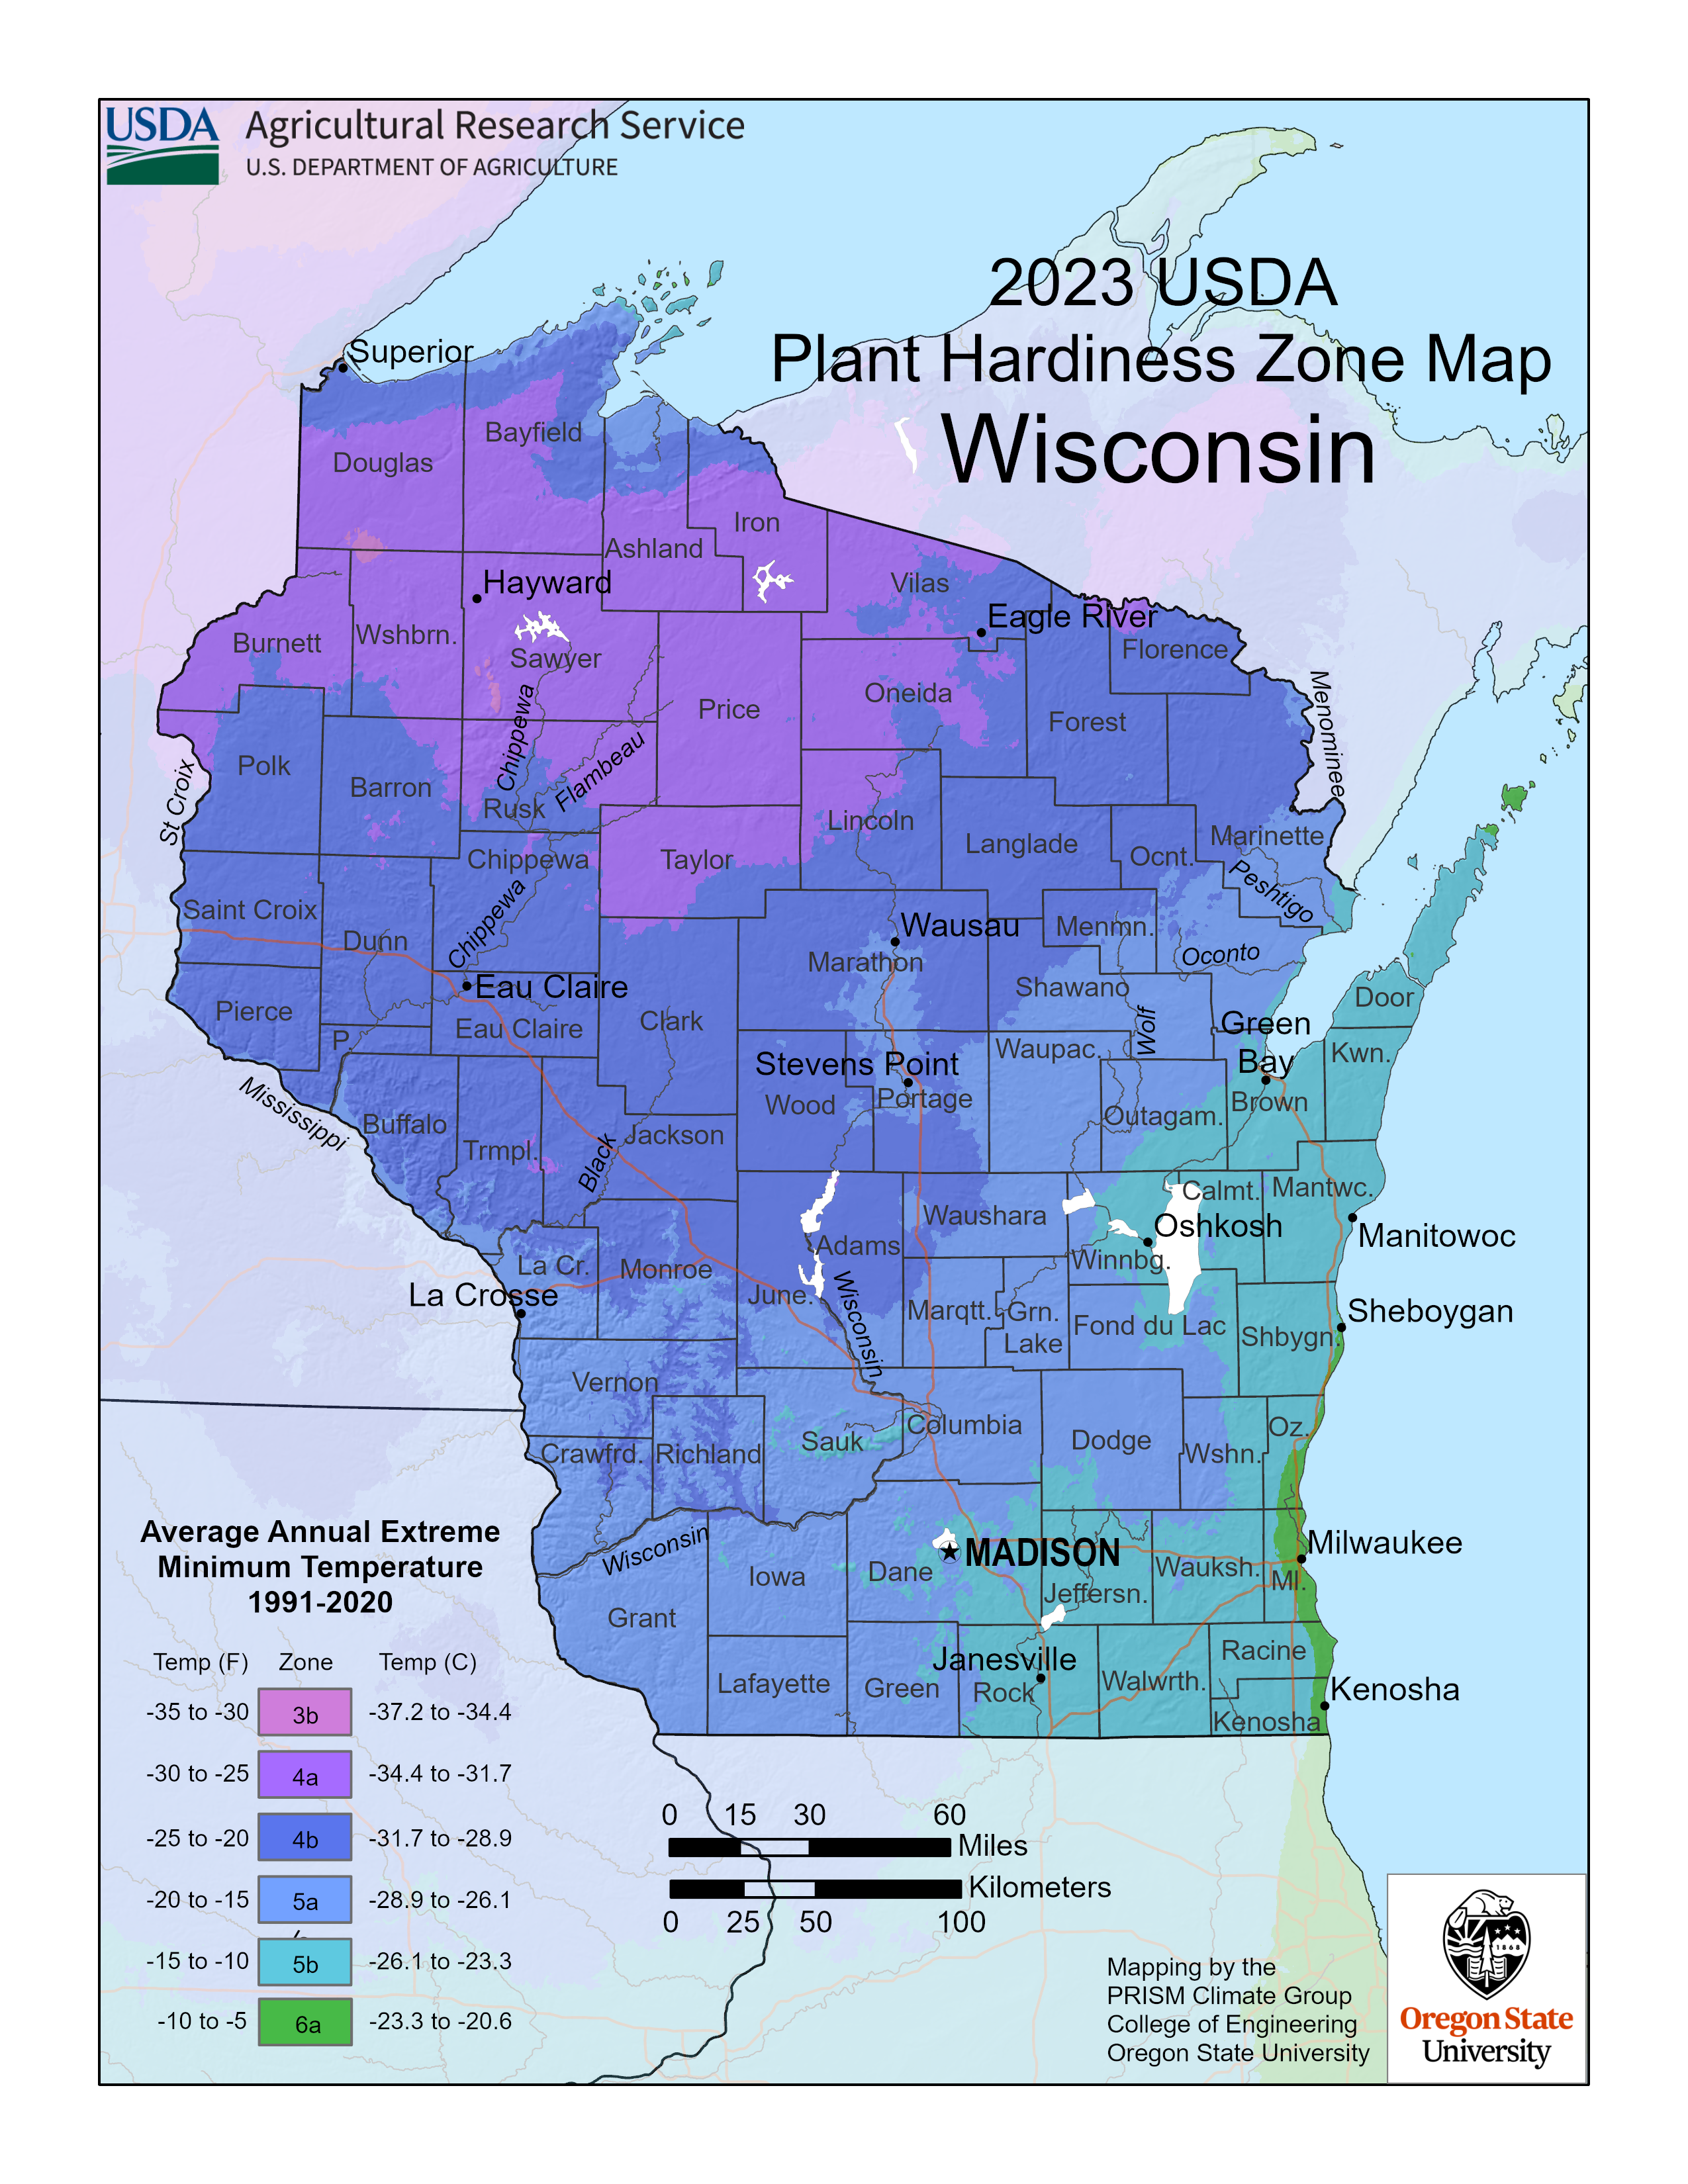
A: As spring arrives and snow melts, gardeners and farmers across Wisconsin are planning for the growing season. A key guide to perennial planting is the USDA Plant Hardiness Zone Map, which is based on the average annual extreme minimum winter temperature. Since its first release in 1960, the map has evolved with better data and rising temperatures, and the 2023 version reflects these changes. Wisconsin now includes six half-zones, from zone 3b in the northwest to zone 6a along the southeastern lakeshore — evidence of a warming trend.
For annual plants, timing is everything. Unlike perennials, they are not frost-hardy, so knowing when to plant is crucial. Cool-season crops like cabbage and potatoes can be planted earlier, while warm-season crops such as tomatoes and corn should wait until after the last frost. The Midwestern Regional Climate Center (MRCC) offers tools and maps showing median dates for last spring frosts and freezes, with southern Wisconsin typically frost-free by late April and northern areas not until early June.
Soil temperature also matters — corn, for example, will not germinate below 50 degrees. The Wisconsin Environmental Mesonet (Wisconet) provides real-time soil temperature data. As of late March, upper soil layers remained in the 30s across much of the state. For more planting advice, local UW Division of Extension offices and the UW Horticulture Program are great resources.
Climate Statistics By Division
Temperature (°F)
| March 2025 | ||
|---|---|---|
| Division | Avg | Dept |
| Northwest | 32.8 | 4.5 |
| North Central | 31.7 | 4.2 |
| Northeast | 32.6 | 4.1 |
| West Central | 37.2 | 5.6 |
| Central | 37.0 | 5.3 |
| East Central | 36.3 | 4.7 |
| Southwest | 40 | 5.9 |
| South Central | 40.1 | 6 |
| Southeast | 39.5 | 5.2 |
| State | 35.5 | 5.0 |
Heating Degree Days
| March 2025 | Since July 1, 2024 | |||
|---|---|---|---|---|
| Division | Avg | Dept | Avg | Dept |
| Northwest | 998 | -140 | 7,019 | -563 |
| North Central | 1,032 | -132 | 7,112 | -534 |
| Northeast | 1,004 | -127 | 6,790 | -551 |
| West Central | 862 | -175 | 6,406 | -547 |
| Central | 868 | -163 | 6,218 | -601 |
| East Central | 890 | -144 | 6,029 | -569 |
| Southwest | 775 | -184 | 5,964 | -476 |
| South Central | 772 | -188 | 5,763 | -549 |
| Southeast | 790 | -162 | 5,668 | -462 |
| State | 843 | -162 | 6,026 | -522 |
Liquid-Equivalent Precipitation (Inches)
| March 2025 | Since Nov. 1, 2024 | |||
|---|---|---|---|---|
| Division | Avg | Dept | Avg | Dept |
| Northwest | 2.94 | 1.35 | 7.91 | 1.23 |
| North Central | 4.10 | 2.38 | 10.10 | 2.62 |
| Northeast | 4.81 | 3.09 | 11.62 | 4.07 |
| West Central | 3.12 | 1.29 | 8.14 | 1.02 |
| Central | 3.88 | 1.99 | 10.29 | 2.67 |
| East Central | 3.90 | 2.03 | 9.78 | 1.51 |
| Southwest | 3.13 | 1.05 | 9.77 | 1.39 |
| South Central | 3.24 | 1.17 | 8.29 | -0.62 |
| Southeast | 3.32 | 1.27 | 8.16 | -1.23 |
| State | 3.61 | 1.79 | 9.35 | 1.67 |
Snowfall (Inches)
| March 2025 | ||
|---|---|---|
| Division | Avg | Dept |
| Northwest | 9.9 | 0.4 |
| North Central | 18.7 | 7.6 |
| Northeast | 17.5 | 8.2 |
| West Central | 8.0 | 0.2 |
| Central | 10.4 | 3.2 |
| East Central | 7.3 | 0.6 |
| Southwest | 1.9 | -3.7 |
| South Central | 1.9 | -3.3 |
| Southeast | 2.9 | -2.4 |
| State | 10.4 | 2.3 |
Steve Vavrus is the Wisconsin state climatologist. Bridgette Mason and Ed Hopkins are the assistant state climatologists.