May and spring kept Wisconsin on its toes: record-breaking heat to unseasonable chills, dry spells to drenching storms, and tornadoes to wildfires.
Climate Stats by Division
To view a summary of May’s key climate statistics for each of Wisconsin’s nine climate divisions, check out the detailed table at the end of this report. This table includes average temperature, heating degree days, total precipitation, and snowfall. For each variable, you’ll find both the observed May values and how they compared to the long-term average from 1991 to 2020. These comparisons help highlight where the month was warmer, cooler, wetter, or drier than usual.
Record Heat to Late Chill
May delivered a temperature whiplash across Wisconsin. Early in the month, a burst of warmth surged in the Northwoods. Many locations recorded their first 80s of the season by May 6 — some 20 to 30 degrees (Fahrenheit) above normal for this date (Table 1). However, temperatures dropped in the Northwoods days later, where Ashland (Ashland County) recorded the state’s lowest temperature of the month: 25 degrees on May 9.
| Location | High Temp on May 6 (°F) | Normal High Temp for May 6 (°F) | Average First 80°F | Earliest First 80°F | Latest First 80°F |
| Ashland (Ashland Co.) | 87 | 60.7 | May 5 | March 17, 2012 | June 4, 2017 |
| Superior (Douglas Co.) | 86 | 54.2 | May 17 | April 5, 1991 | June 22, 1983 |
| Grantsburg (Burnett Co.) | 84 | 65.4 | May 2 | March 18, 2012 | June 12, 1983 |
| Wausau (Marathon Co.) | 84 | 63.4 | May 7 | April 5, 2021 | June 10, 1983 |
| Luck (Polk Co.) | 82 | 64.6 | May 10 | March 29, 1986 | June 20, 2008 |
| Couderay (Sawyer Co.) | 82 | 63.3 | May 11 | April 4, 1991 | June 24, 2008 |
| Rhinelander (Oneida Co.) | 82 | 62.5 | May 10 | April 13, 2023 | June 7, 2008 |
| Gordon (Douglas Co.) | 81 | 61.9 | May 8 | April 6, 2021 | June 3, 2017 |
| Park Falls (Price Co.) | 81 | 61.1 | May 7 | April 14, 2023 | June 3, 2017 |
| Eagle River (Vilas Co.) | 81 | 60.8 | May 13 | April 8, 1991 | June 16, 1996 |
| Hayward (Sawyer Co.) | 80 | 65.6 | May 7 | April 6, 2021 | July 1, 1916 |
But the heat climbed again mid-month, with Madison setting a new daily record high of 87 degrees on May 15, surpassing the previous record of 86 degrees set in 1977 and 2012. Beloit (Rock County) reached 94 degrees that same day — the state’s hottest temperature of the month. Several other southern locations, including Brodhead (Green County) and Delavan (Walworth County), recorded 93 degrees. Wisconet stations near Walworth, Porter, Verona, and Richland Center also recorded their first 90-degree readings of the year. Typically, southern Wisconsin does not see its first 90-degree day until mid-June.
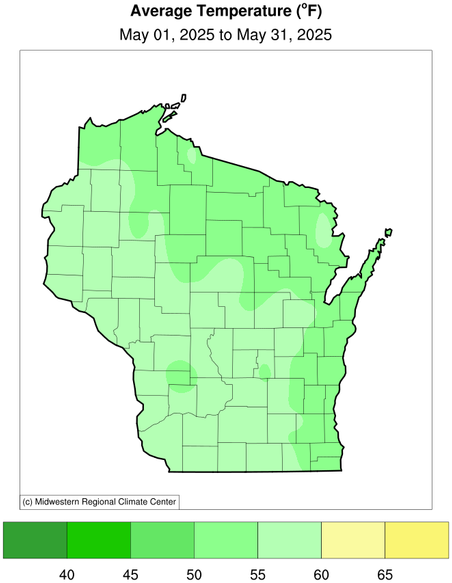
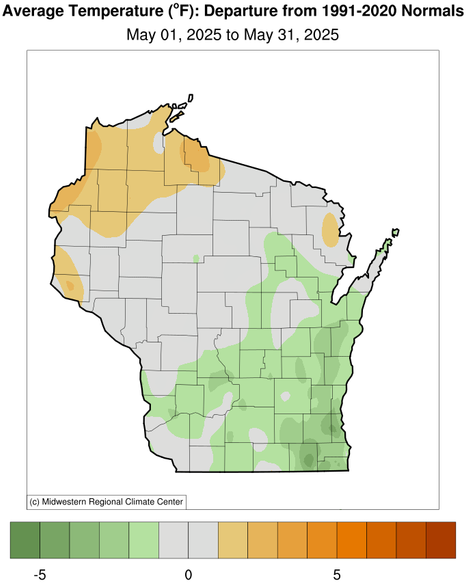
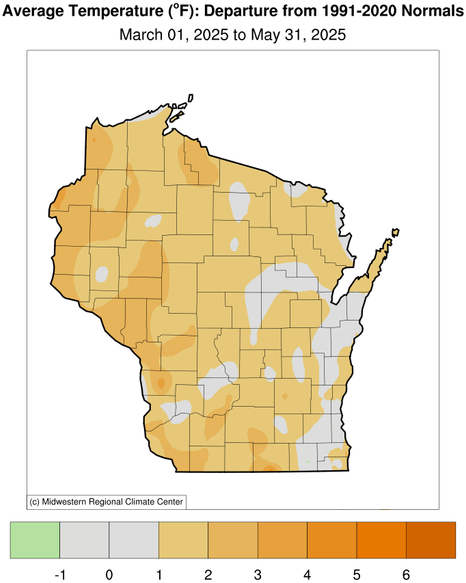
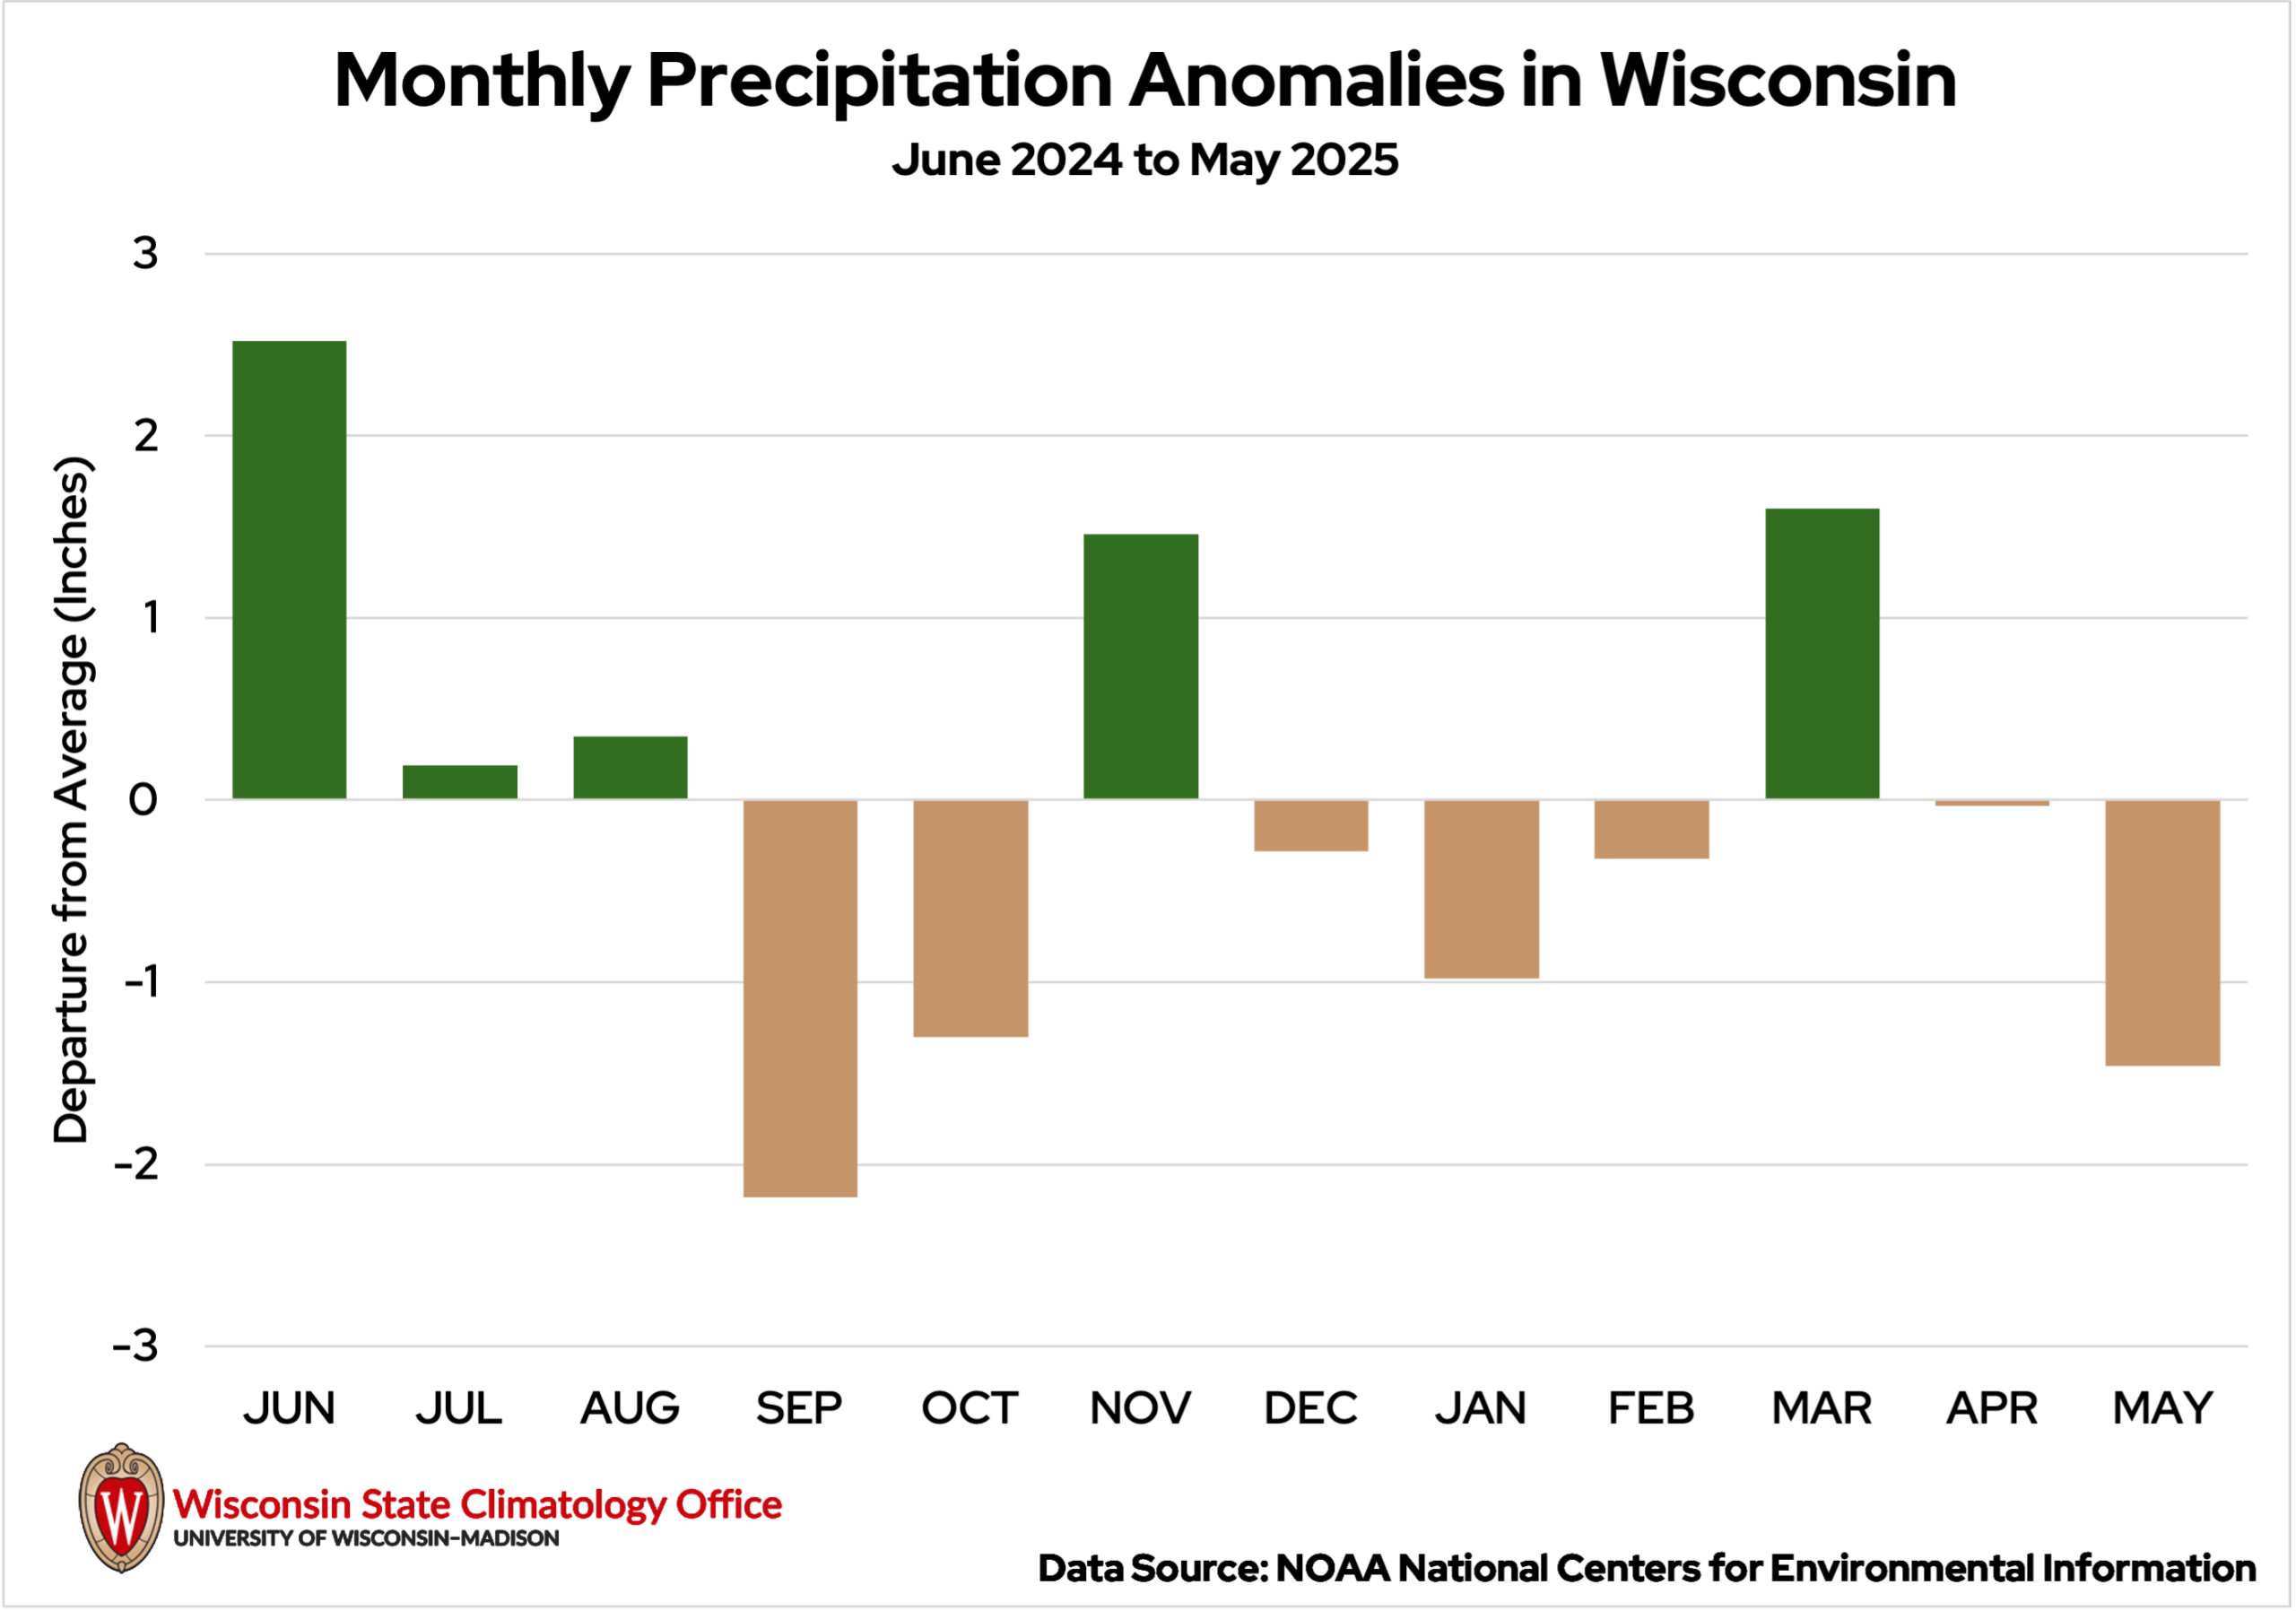
Just as quickly as the heat arrived, it vanished. The week of May 19 flipped the script, bringing much cooler conditions. High temperatures in Milwaukee struggled to reach 46 degrees on May 21 — a whole three degrees below the normal low temperature for that date. Despite the mid-month temperature swing, May averaged 55 degrees statewide, only 0.4 degrees below the 1991 to 2020 normal — yet another near-normal and slightly cooler-than-average month, which is notable given how frequently extreme warmth has dominated over the past year (Figures 1 and 2).
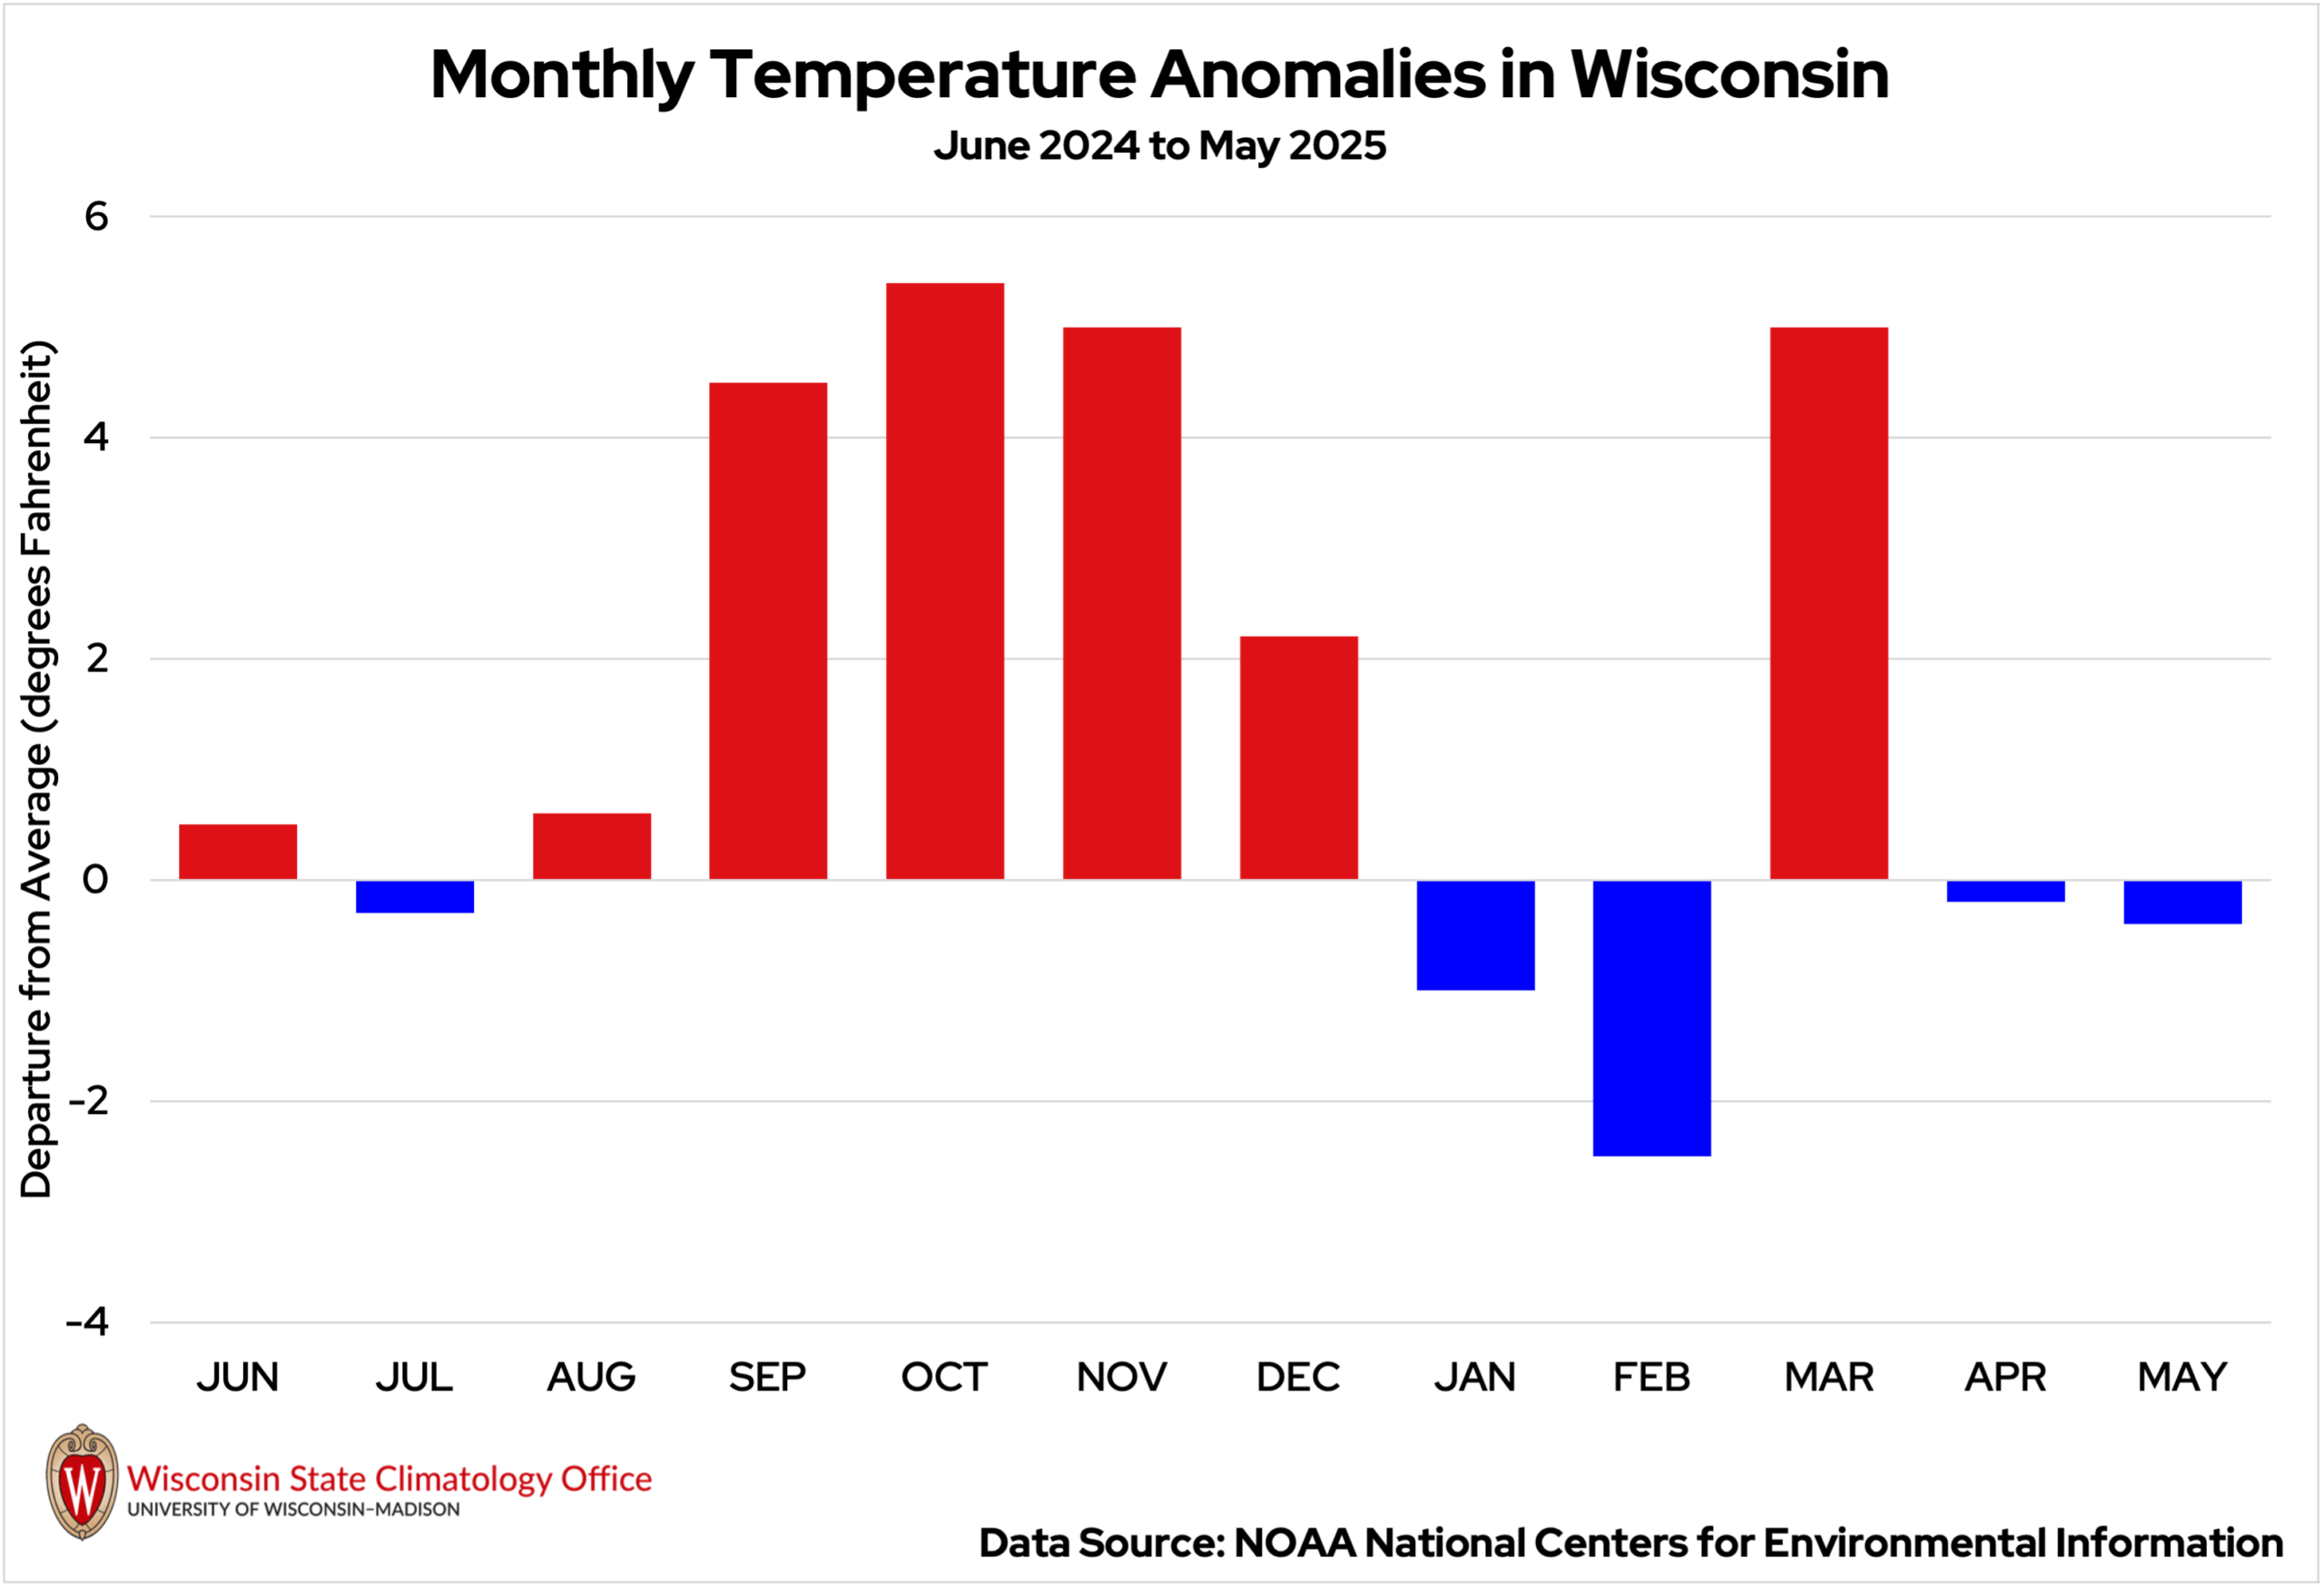
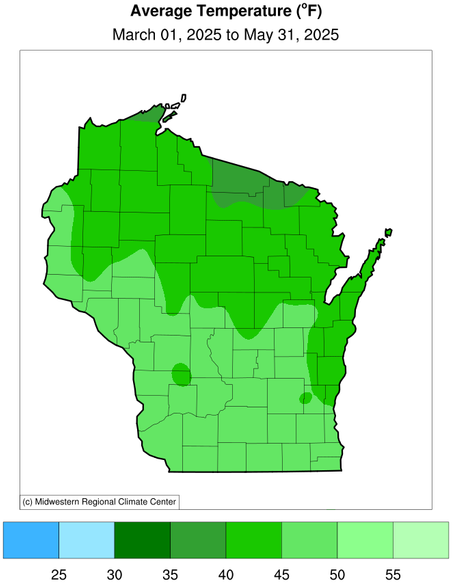
Looking at spring as a whole (March through May), the season started on an unseasonably warm note: March ranked as the 12th warmest on record for Wisconsin, averaging 4.9 degrees above normal. That early-season warmth was followed by an unusual and somewhat refreshing trend — April and May both finished close to normal. Altogether, spring averaged 44.4 degrees, which was 1.4 degrees above the 30-year normal of 43.0 degrees (Figure 3).
Rainfall was Too Hit-or-Miss
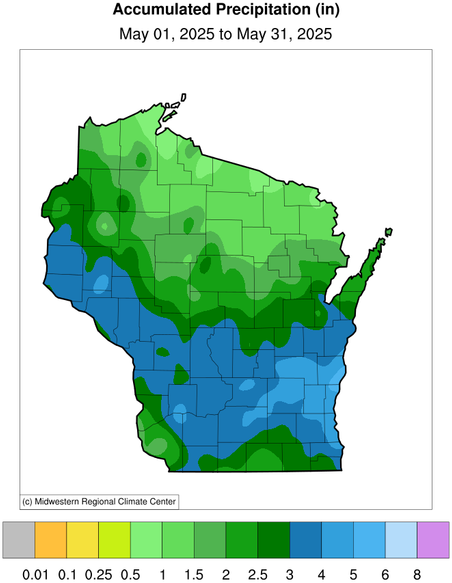
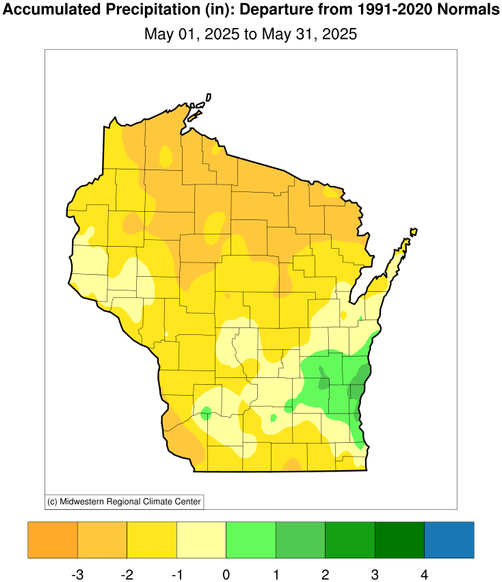
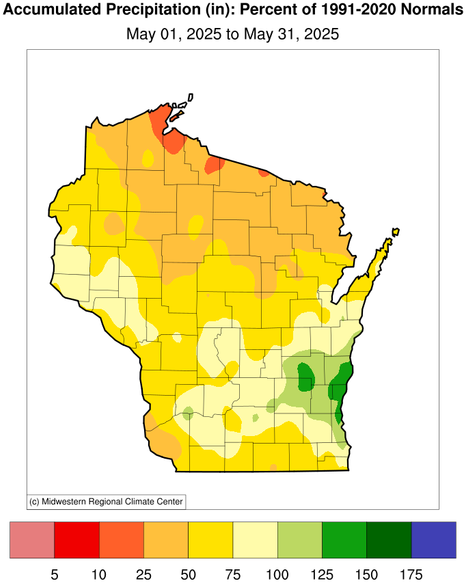
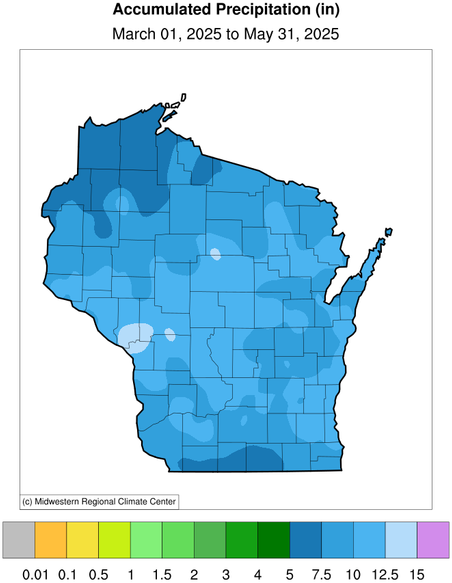
Despite a few rounds of thunderstorms that brought bouts of heavy rain to parts of the state, nearly all of Wisconsin reported drier than average conditions during the month of May. Dryness was especially prevalent in the northern half of the state, where some locations only measured an inch of rain throughout the entire month. Only a small section of eastern Wisconsin reported wetter than average conditions. Statewide precipitation totaled 2.47 inches, 1.46 inches drier than the 30-year average for the month, making this Wisconsin’s 26th driest May in the 131-year record (Figures 4 and 5).
A burst of heavy rain on the first of the month created soggy conditions from south-central to northeastern Wisconsin. Madison set a new rainfall record for May 1 after measuring 1.80 inches of rain, breaking the 129-year-old record of 1.30 inches (1896). A significant dry spell set in from May 4 through May 12, when nearly all of the state remained completely dry for more than a week.
The floodgates opened during the middle part of the month as rounds of heavy rain and thunderstorms moved through the state once again. On May 14, downpours in Monroe County led to manure runoff into nearby springs and rivers, killing hundreds of fish. The highest 24-hour rain total of the month was 2.33 inches measured in Chippewa Falls (Chippewa County) on May 16.
Three days of rain from May 19 through 21 dropped one to three inches on the southern half of the state, easing drought conditions across the south, while northern Wisconsin was left wanting more. On May 20, La Crosse set a new daily rainfall record of 1.70 inches (previously 1.46 inches in 1913), as did Madison with a total of 1.04 inches (previously 0.88 inches in 1959). Meanwhile, light rain under a half inch in the northern counties over those three days amounted to the most rain those areas had received all month.
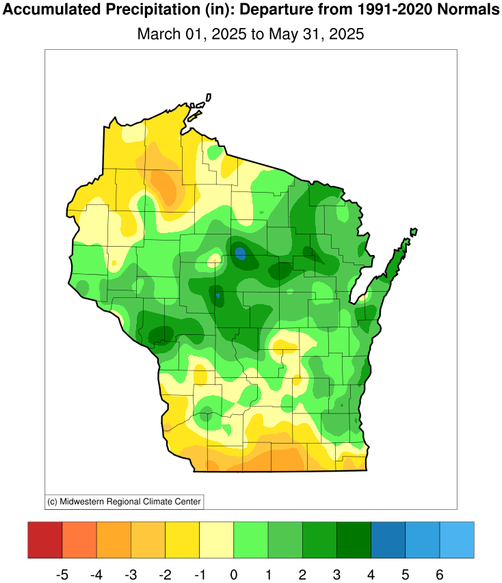
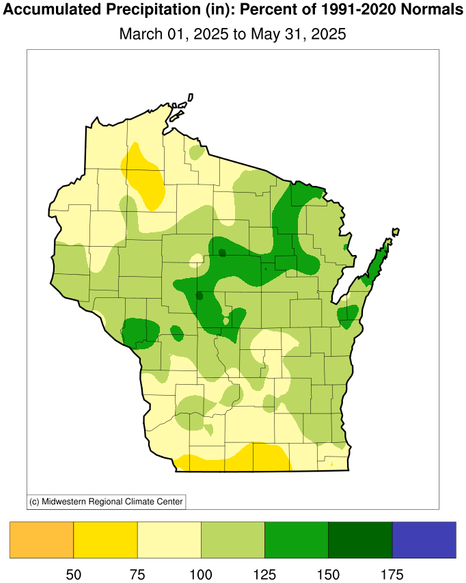
The spring season as a whole flip-flopped between a very wet March, a near-normal April, and a dry May. The statewide precipitation total for March through May was 9.09 inches, only 0.14 inches above the 30-year normal of 8.95 inches (Figure 6).
A Whirlwind 24 Hours
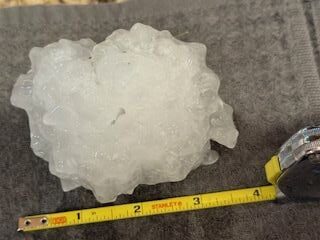
May is typically one of the more active severe weather months in the state, and this year was no exception, though the majority of the month’s severe weather came in a single day. On May 15, a large line of thunderstorms swept in from the west, spawning numerous tornadoes, large hail, damaging winds, and heavy downpours. Hail as large as softballs fell in Eau Claire County, including a four-inch hailstone reported just west of Altoona. This enormous hailstone ties for the fifth largest in the state since 1955. Numerous individuals reported smashed windows and dented vehicles.
Damaging wind gusts were reported all across the state, but were especially prevalent in the northwestern region. The community of Clam Lake (Bayfield County) measured a 79 mile per hour wind gust, and the National Weather Service estimates that wind gusts reached 100 miles per hour in Rusk County. Winds were so powerful across Lake Flambeau in Ladysmith that a pontoon boat was lifted onto another one nearby!

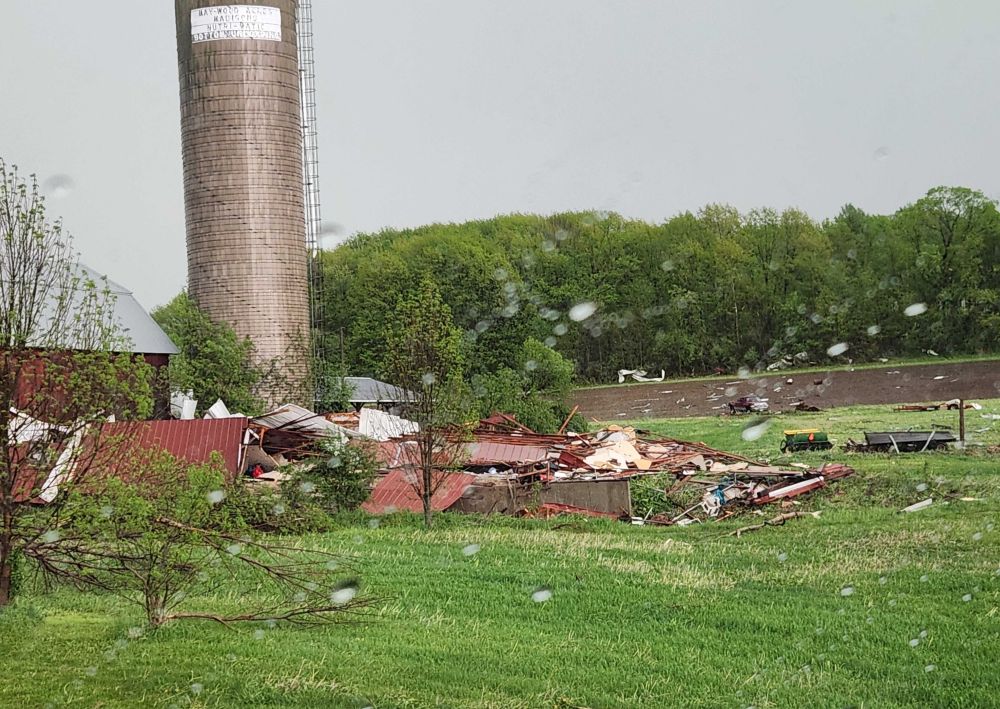
The National Weather Service confirmed that 15 tornadoes touched down in the state during the event, four of which were ranked at EF2 strength with estimated wind speeds of 120 miles per hour (Table 2). Significant damage was done to farm buildings and structures, as well as a few homes. No human deaths were reported from any of the tornadoes, though some cattle were lost in Dodge County.
One tornado in Columbia County was categorized as an EF-Unknown, indicating the intensity of the tornado cannot be evaluated due to a lack of visible damage. These ratings are most common when tornadoes occur over open fields or in remote areas.
| Location | Enhanced Fujita (EF) Rating | Estimate Maximum Winds |
Damage Reported |
| New Richmond (St. Croix Co.) | EF-2 | 120 mph | Damage to outbuilding roofs. |
| Christie (Clark Co.) | EF-1 | 95 mph | Large tree trunks snapped in half. |
| Loyal (Clark Co.) | EF-1 | 100 mph | Damage to trees, powerlines, and one residence. |
| Loyal (Clark Co.) | EF-0 | 85 mph | Damage to numerous trees and the removal of the roof of a farm building. |
| Colby (Clark Co.) | EF-2 | 120 mph | Significant roof damage to a home and multiple outbuildings. Some damage to trees and power poles. |
| Rib Falls (Marathon Co.) | EF-0 | 85 mph | Little to no damage was seen due to touch down occurring in an open area. |
| Bancroft (Portage Co.) | EF-0 | 65 mph | Minor damage to nearby trees. |
| Theresa (Dodge Co.) | EF-1 | 100 mph | Damage to trees along the interstate. |
| Juneau (Dodge Co.) | EF-2 | 120 mph | Damage to homes and farm buildings, one person injured. |
| Lomira (Dodge Co.) | EF-1 | 95 mph | Significant damage to farm buildings resulting in the loss of cattle. |
| Lowell (Dodge Co.) | EF-1 | 90 mph | Multiple trees uprooted. |
| Juneau (Dodge Co.) | EF-1 | 95 mph | Damage to homes and farm buildings. |
| Mayville (Dodge Co.) | EF-2 | 120 mph | Significant damage to outbuildings and trees. |
| Portage (Columbia Co.) | EF-U | Little to no damage was seen; confirmation came from videos and reports from citizens. | |
| Rock Springs (Sauk Co.) | EF-0 | 70 mph | Minor damage to trees. |
| Table 2. A summary of each of the tornadoes in Wisconsin during May, all of which occurred on May 15. Tornado information is from NOAA’s Storm Prediction Center. |
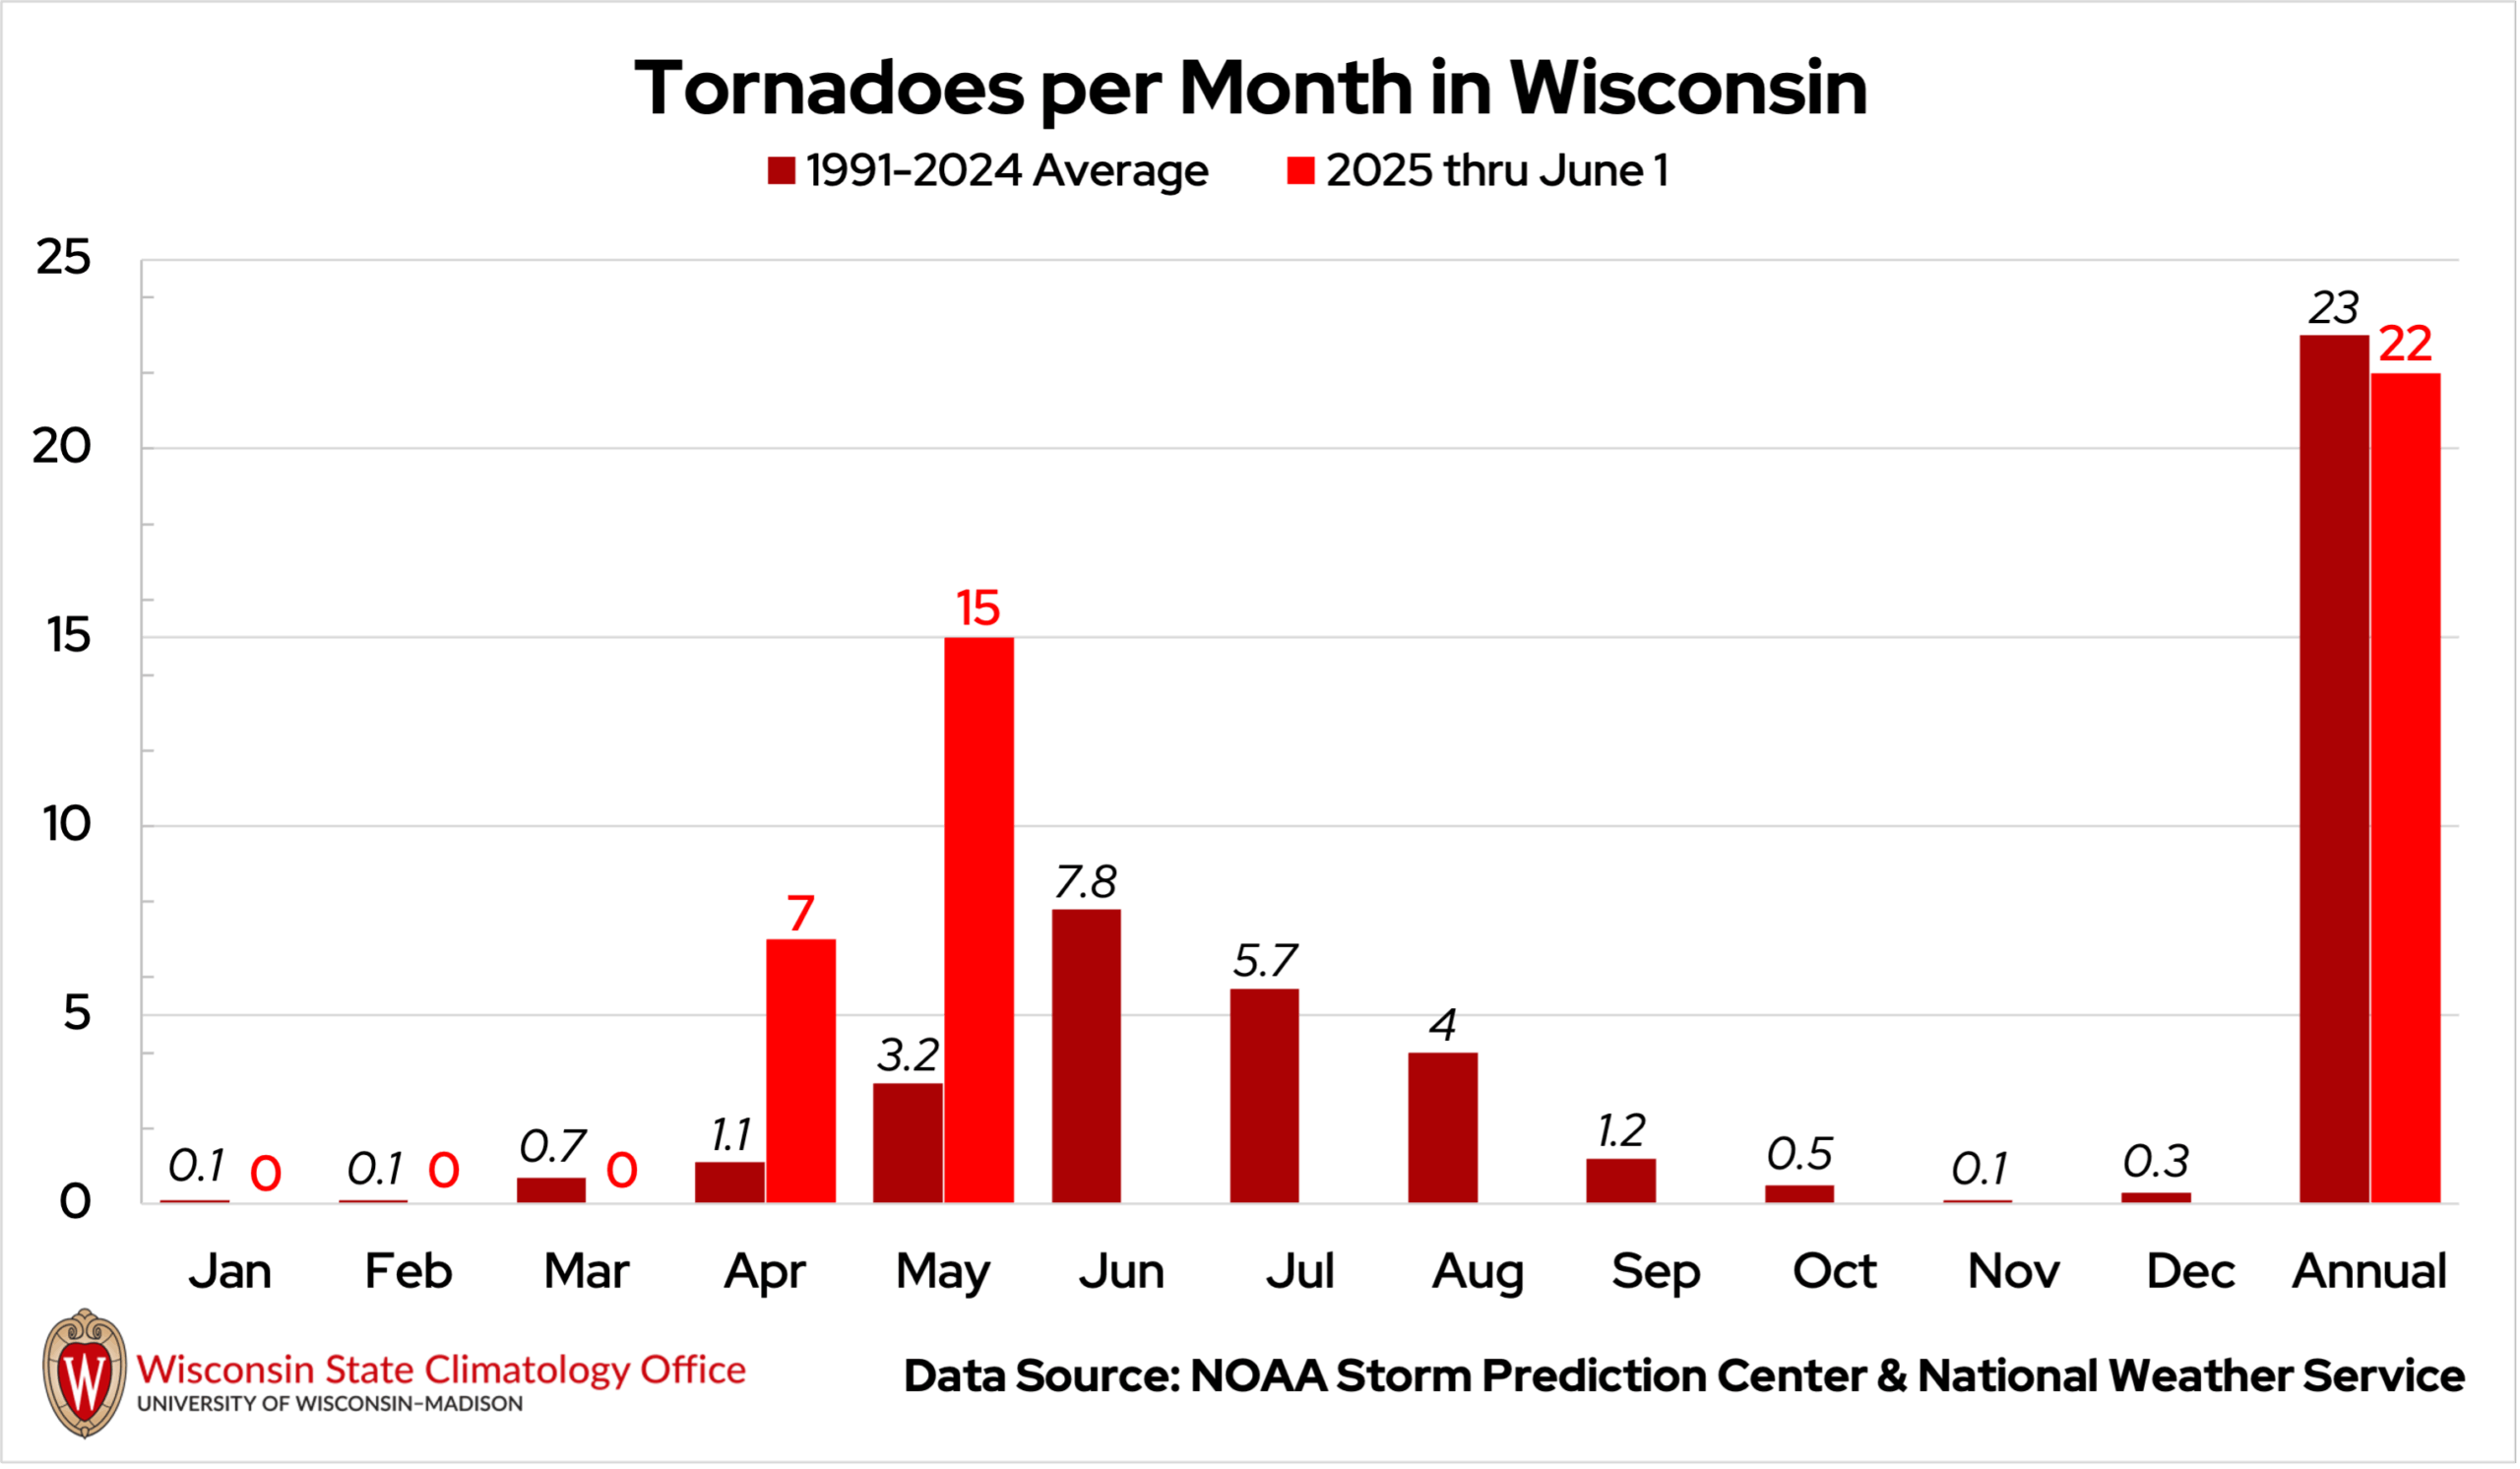
By the end of May, Wisconsin’s 2025 tornado count had reached 22, just one fewer than the state’s average for an entire year (Figure 7). The number of tornadoes in May was nearly five times the 1991 to 2024 average for the month!
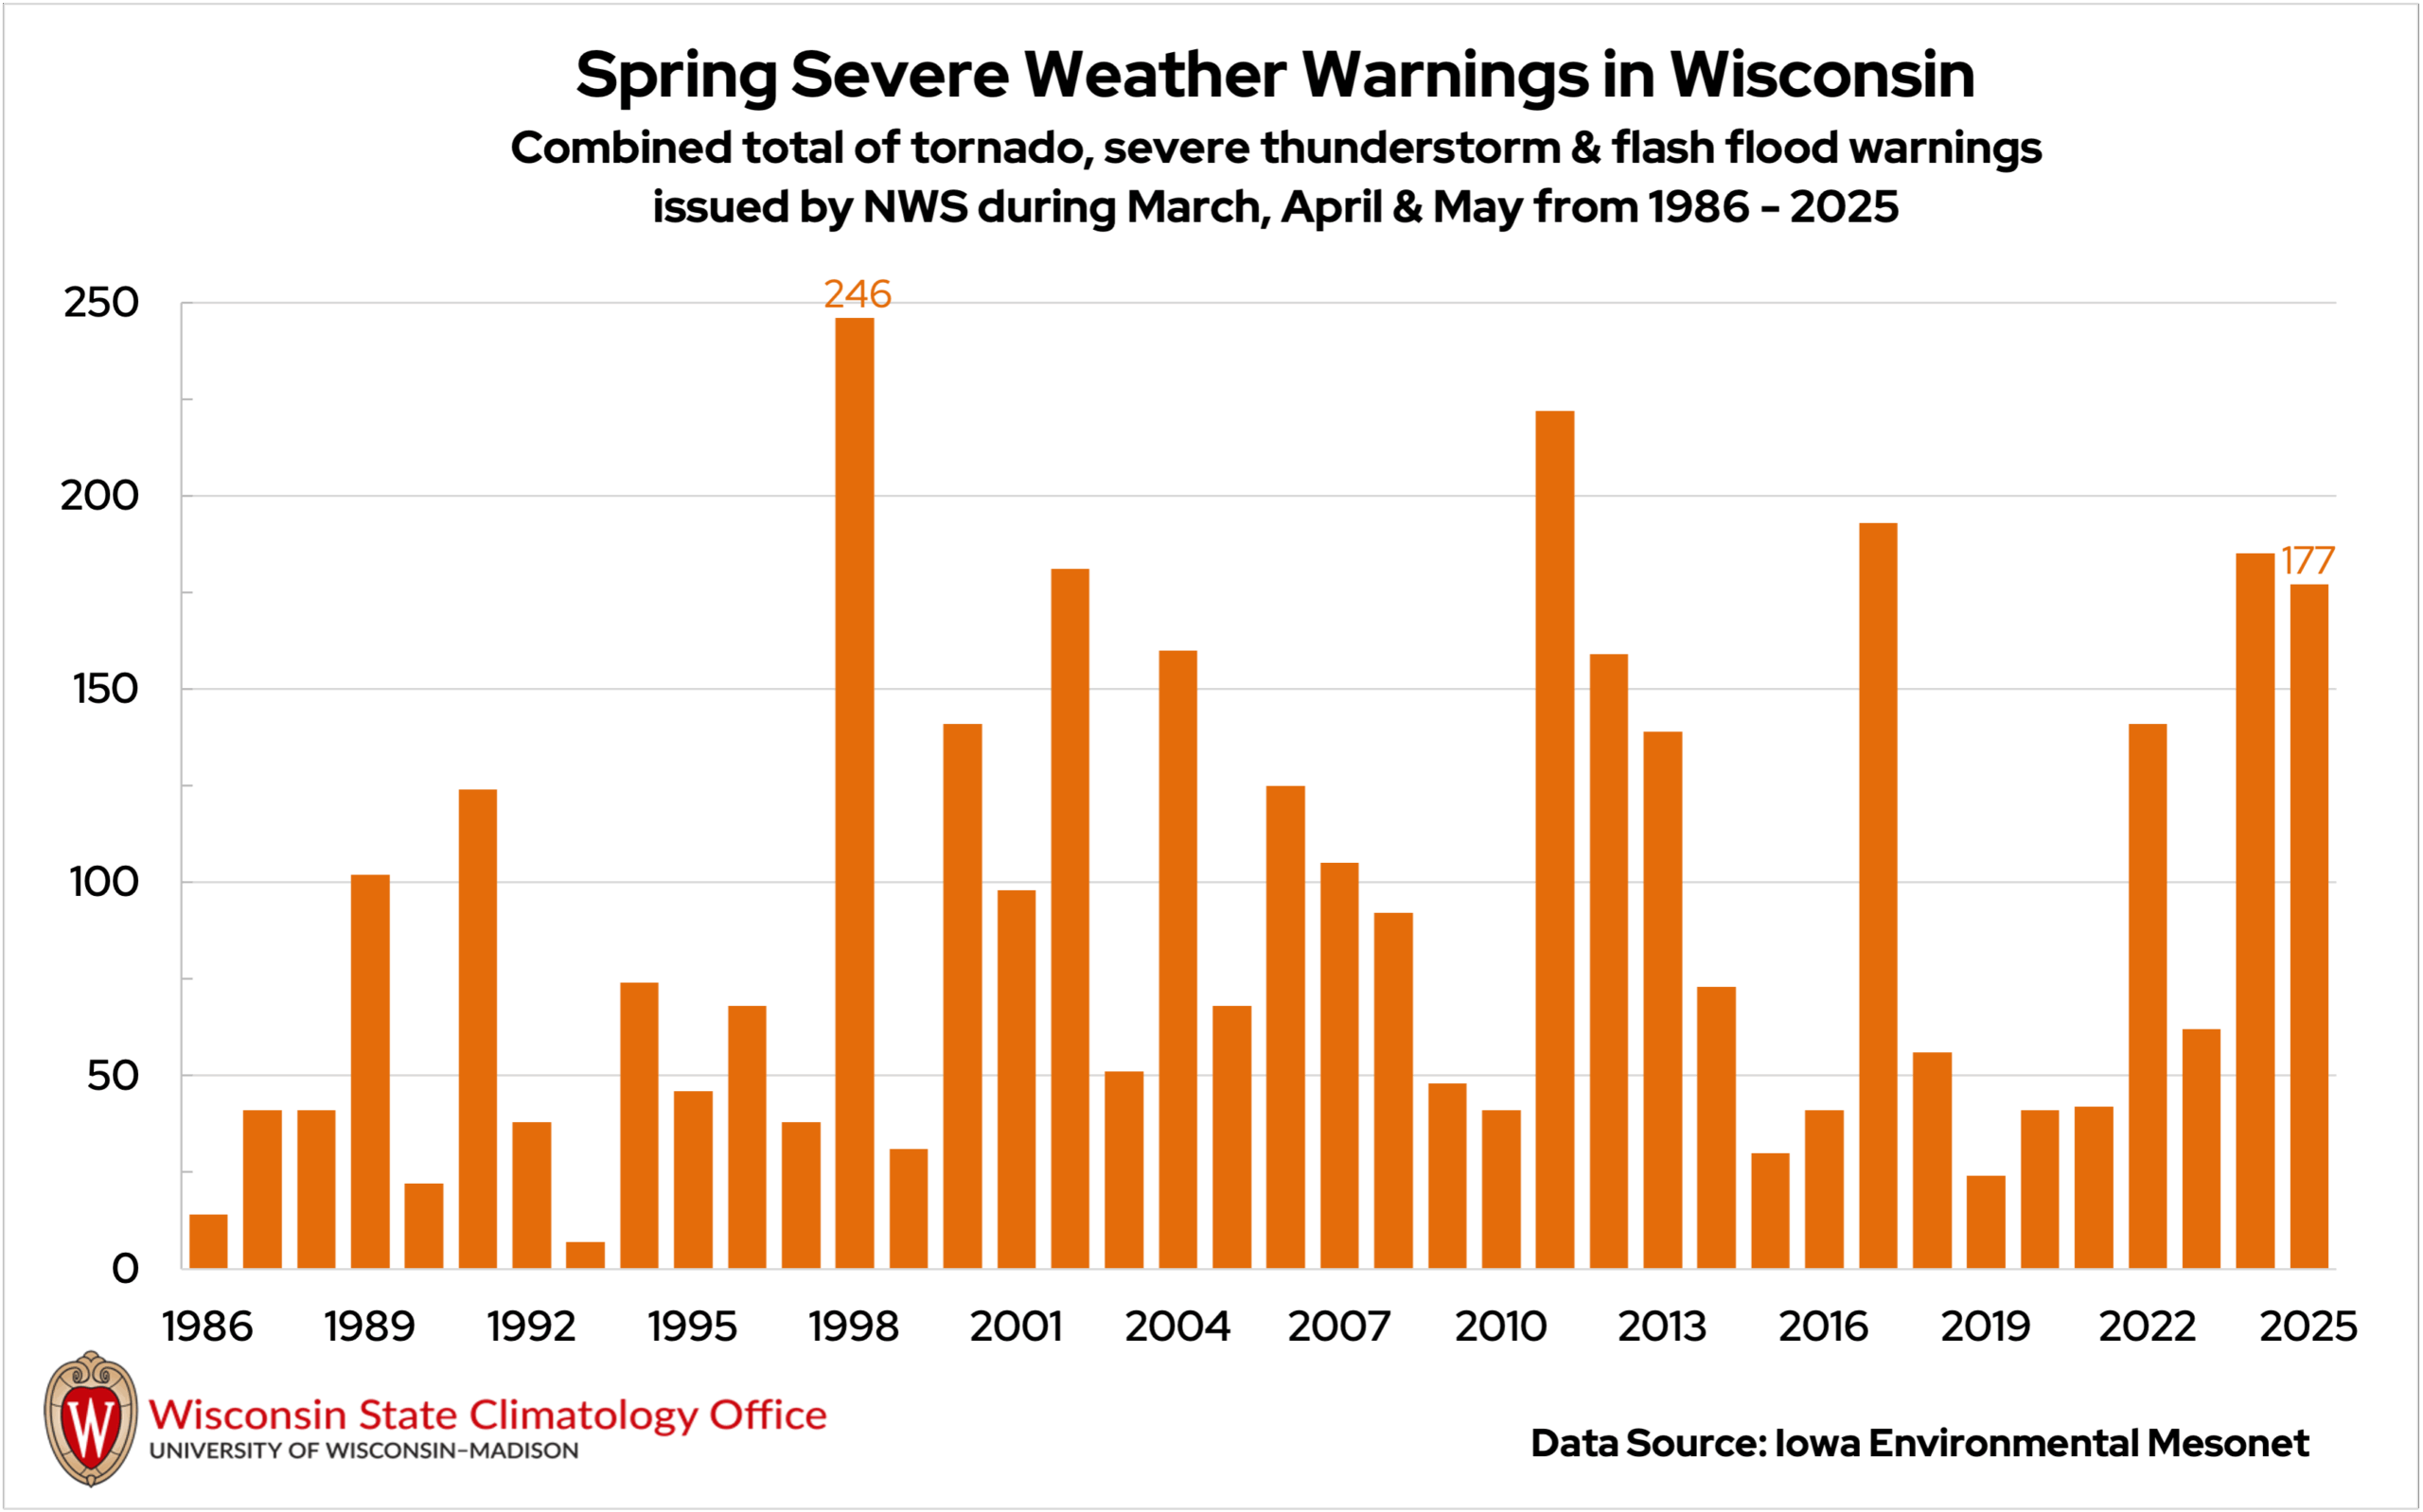
During the spring season, 177 severe weather warnings were issued across the state by the National Weather Service (Figure 8). You may notice that total is fewer than the number of warnings issued in spring of 2024; however, that speaks to how unusually active recent spring seasons have been. March 2025 was the most active since 2017, April was the most active since 2011, and May was the eighth most active on record.
Wildfires Despite Drought Improvements
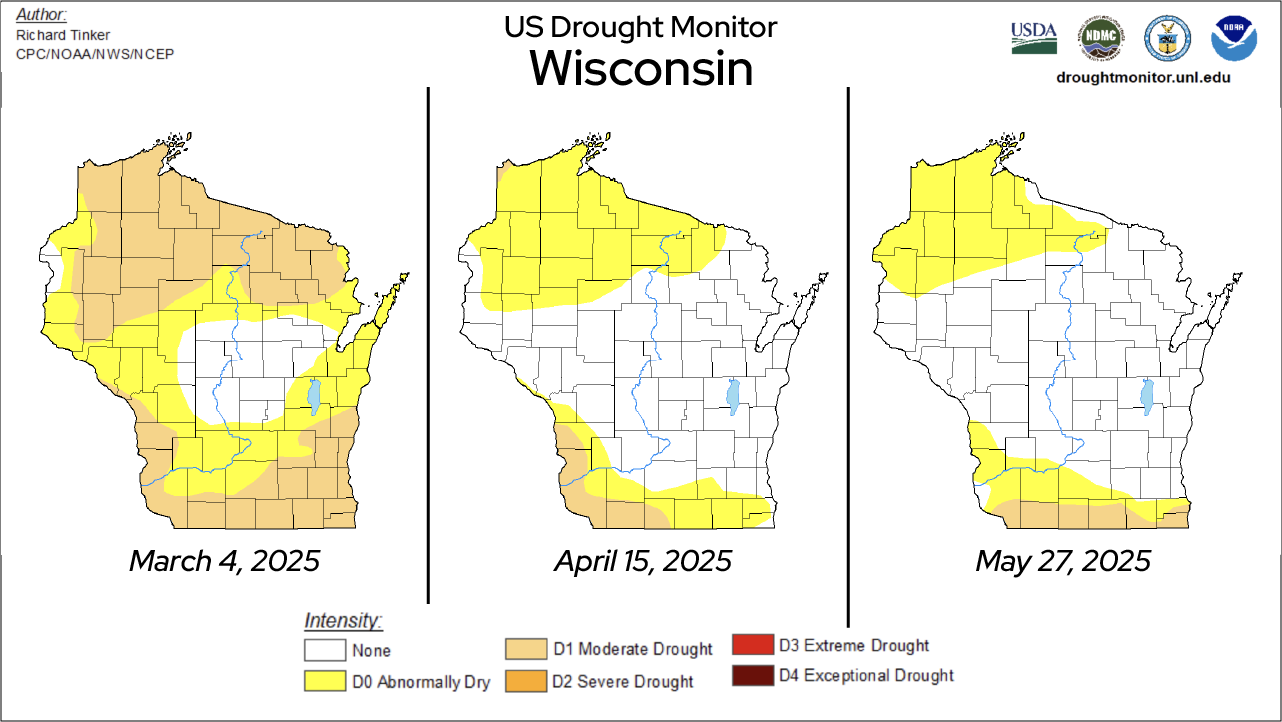
Following Wisconsin’s 16th driest winter, drought conditions improved significantly throughout much of the spring season, though there were slight setbacks in May.
Drought was seen across northern and southern Wisconsin at the beginning of March, when moderate drought (D1) conditions covered 50 percent of the state. By mid-April, only abnormal dryness was reported in northern Wisconsin, and only southwestern Wisconsin was still experiencing moderate drought.
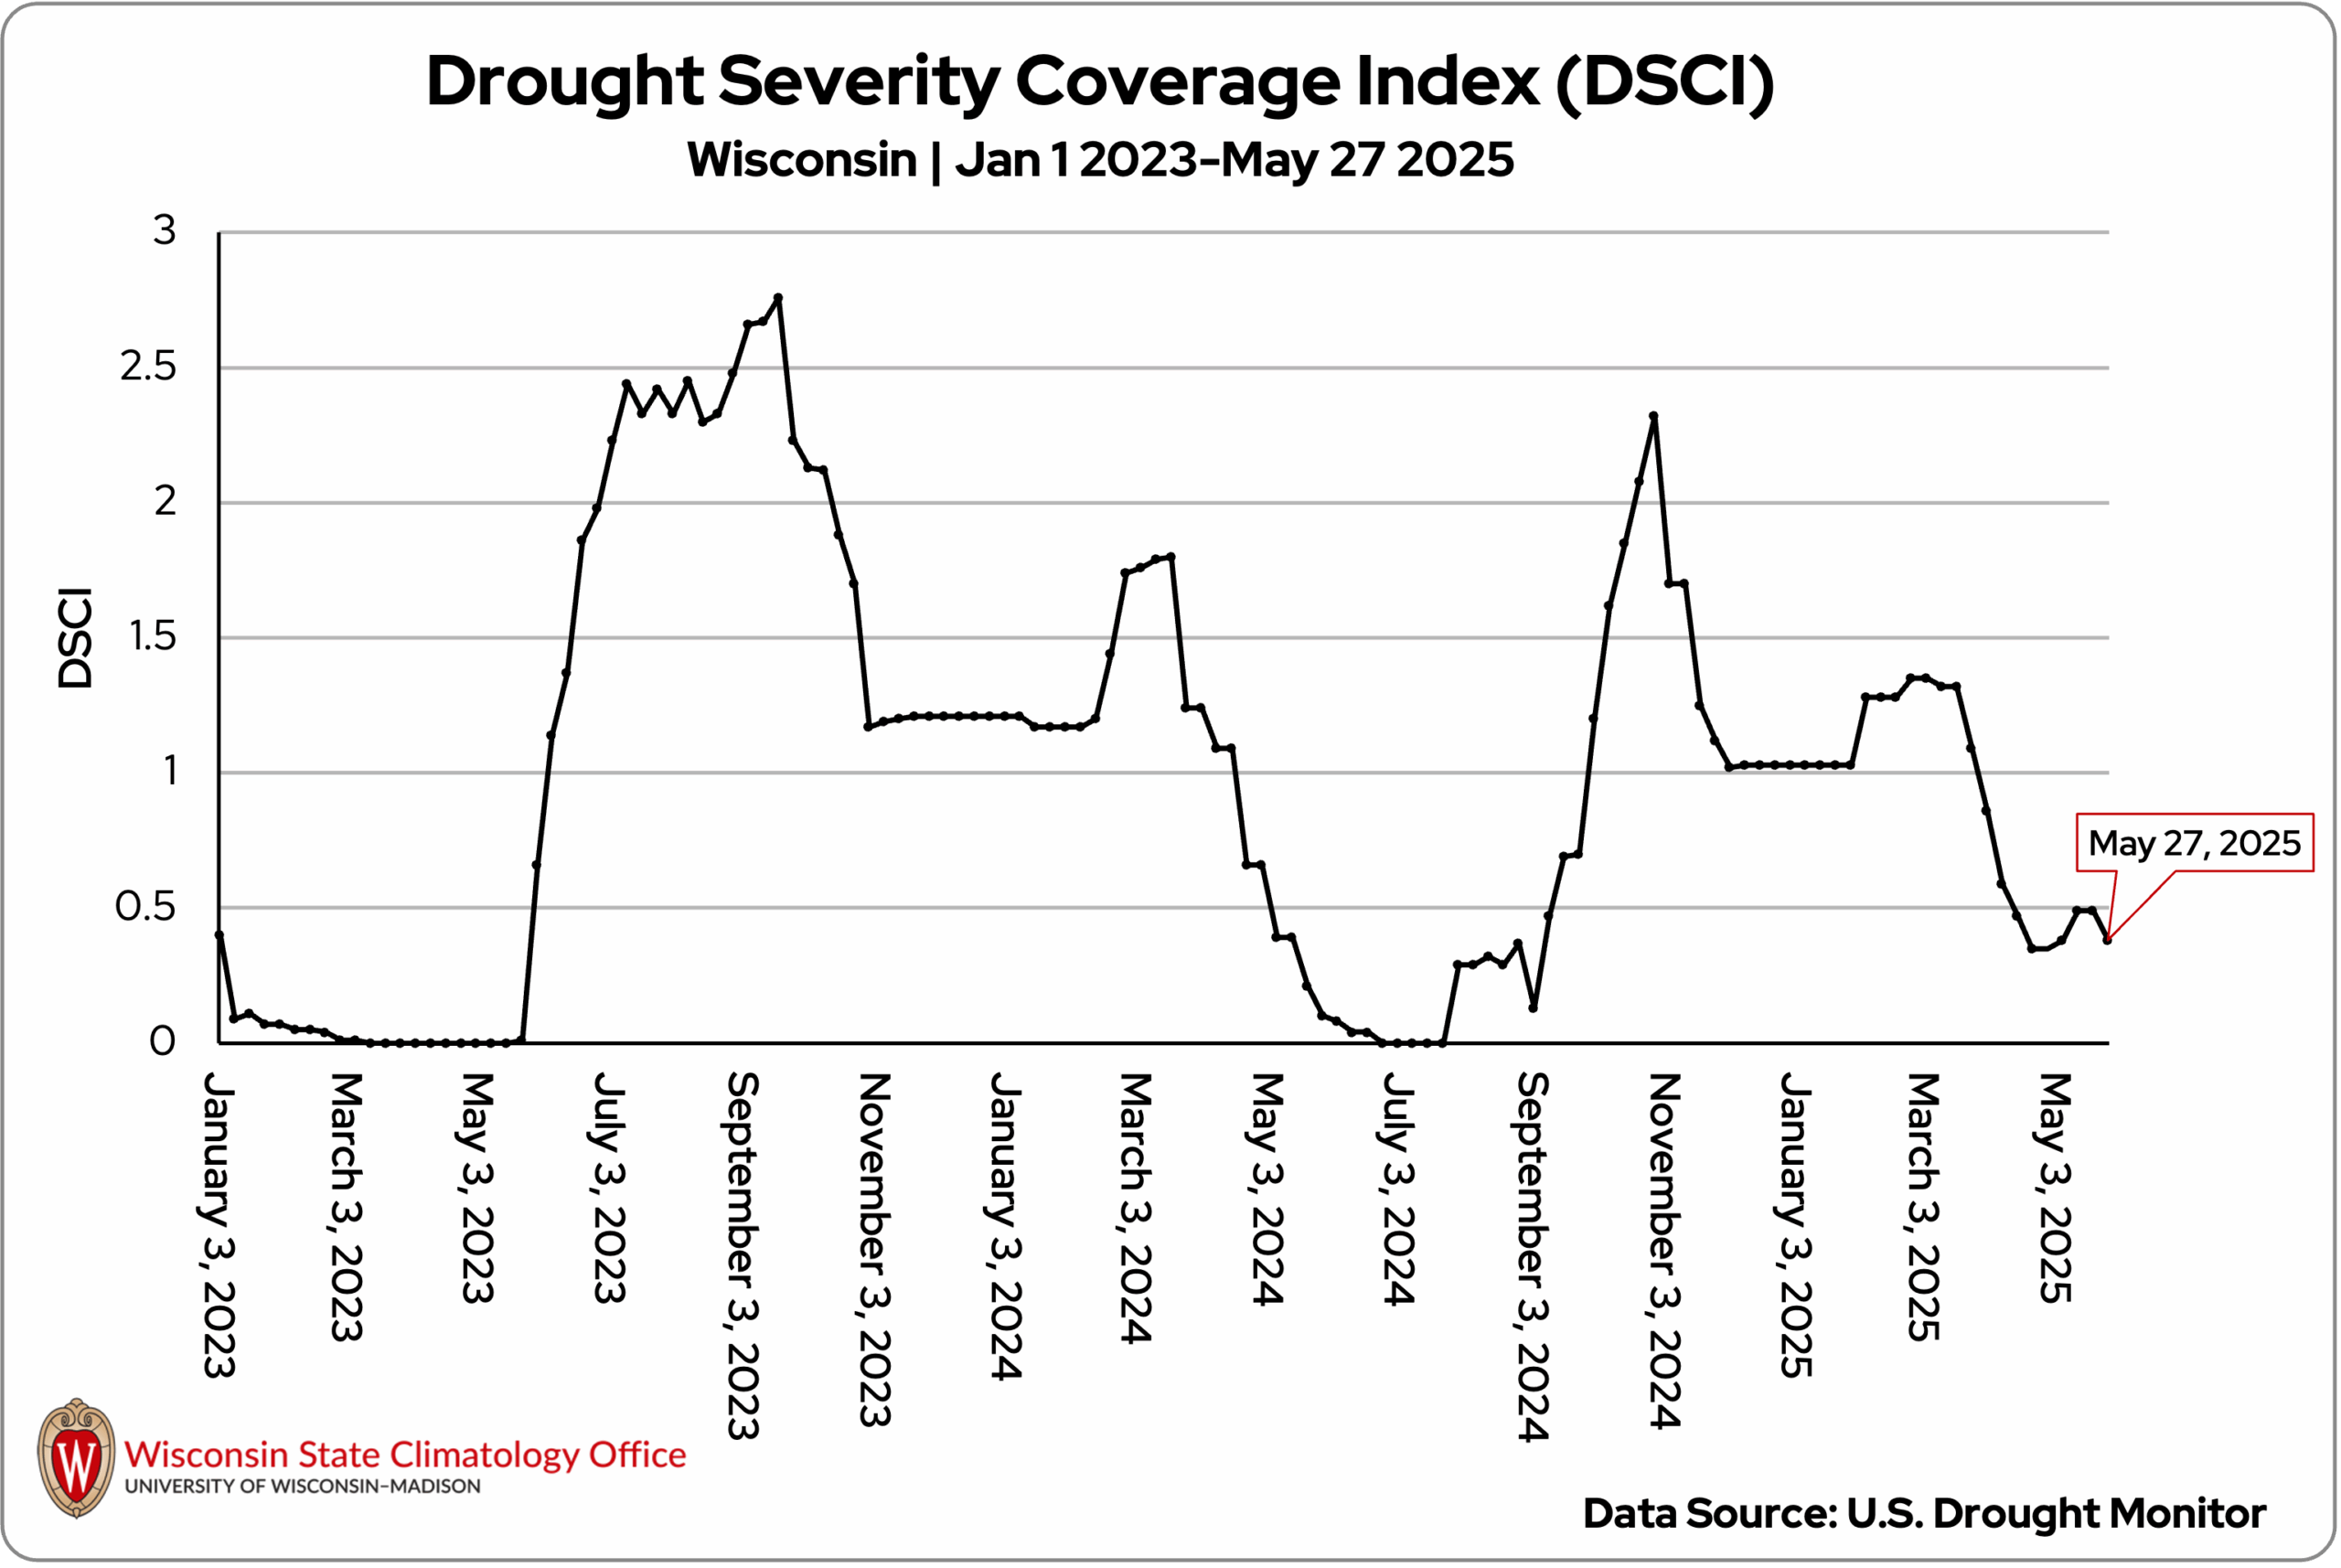
Abnormally dry conditions (D0) persisted through May in the northwestern part of the state, with moderate drought (D1) extending eastward along the southern state line (Figure 9). The Drought Severity Coverage Index (DSCI) showed a slight worsening of drought conditions in mid-May, but overall, much of the state saw drought improvement this spring (Figure 10).
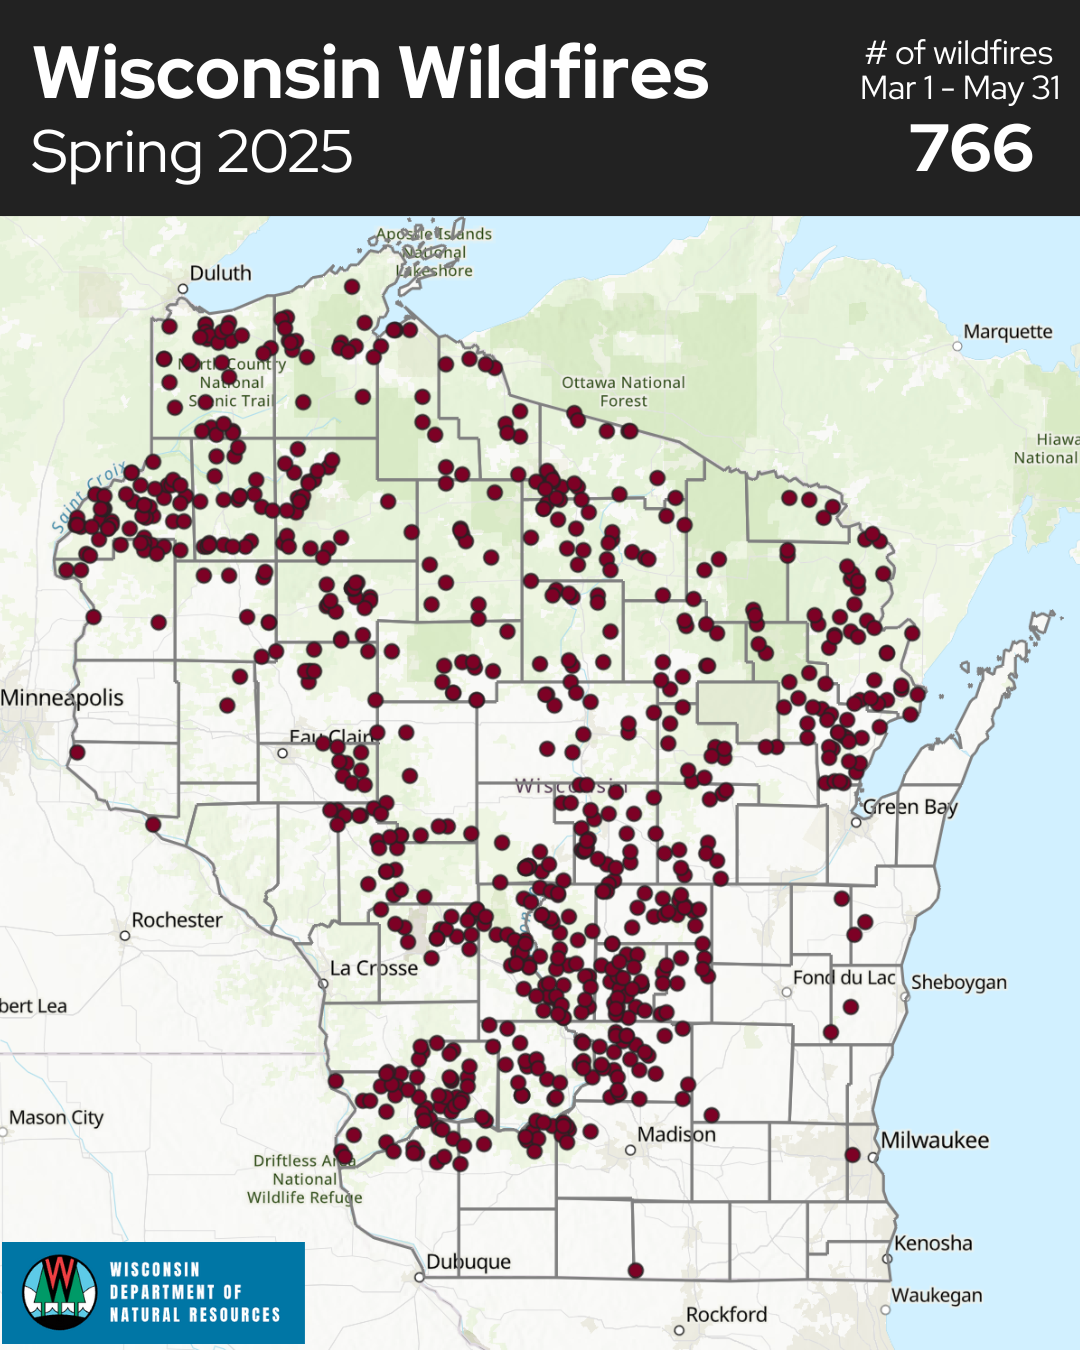
Fire season ramped up quickly this year, with 766 fires burning 2,144 acres between March 1 and May 31 (Figure 11). Comparatively, during that same period last year, 677 fires burned under 1,200 acres in the state. Dry, hot, and windy conditions in mid-May created very high to extreme fire danger in central and northern Wisconsin until beneficial rains arrived on the 19th. For up-to-date fire danger information and burn restrictions, check the Wisconsin Department of Natural Resources’ Wisburn Dashboard.
Planting, Progress, and Weathering the Storms
Farmers made major strides in corn and soybean planting throughout May, especially during the warm and dry conditions in the first half of the month. Planting progressed quickly across the state, and emergence rates responded well to the favorable weather. However, a drop in temperatures in mid-May briefly slowed the accumulation of Growing Degree Days, leading to a slightly below-average total for this point in the season. This led to less rapid corn and soybean emergence rates in late May, but progress is running near the five-year normal as of early June. Despite the early-May dryness, pasture and range conditions held up surprisingly well, with over 70 percent of pasture and range areas rated good to excellent — an encouraging sign for livestock producers heading into summer.
May’s weather also included a sobering reminder of the risks posed by severe storms. The May 15 tornado outbreak caused significant damage to farms and even loss of livestock. In one remarkable story, a dairy cow survived being impaled by a two-by-four board during the May 15 storms.
As the month progressed, crop pest and disease concerns began to surface. Stripe rust appeared in wheat, aided by dewy mornings and cool temperatures. Corn producers and agronomists kept an eye out for possible smoke-related stress, and early disease pressure was also reported in soybeans and corn. Specialty crop growers continued to manage early-season challenges with pests and disease as the growing season ramped up, including the increased risk of fire blight after hail damage on May 15. Click the links above to find recommendations from UW–Madison experts on handling these pest and disease issues.
Overall, spring 2025 set a fast-paced tone for the growing season. March’s unseasonable warmth and drenching rains jumpstarted soil thaw and green-up. April followed with mixed but manageable fieldwork conditions. By May, much of the state had dried out enough to allow rapid planting and strong emergence. While severe storms, lower than normal Growing Degree Days, and some rising disease pressure reminded growers of the challenges that come with spring’s volatility, spring as a whole supported a solid start to the growing season.
Climate Corner
After softball-sized hail fell near Eau Claire last month, Assistant State Climatologist Dr. Ed Hopkins dove into the records of large hail in Wisconsin. He noticed changes in the frequency of large hail events and discerned which counties are most hail-prone. Read his full Climate Ed-ucation report, “Highlighting Wisconsin’s Hail History”!
Climate Statistics by Division
| May 2025 | ||
|---|---|---|
| Division | Avg | Dept |
| Northwest | 54.9 | 0.9 |
| North Central | 53.6 | 0.2 |
| Northeast | 53.0 | -0.6 |
| West Central | 56.7 | -0.2 |
| Central | 55.8 | -0.8 |
| East Central | 53.4 | -1.6 |
| Southwest | 57.0 | -1.0 |
| South Central | 56.5 | -1.4 |
| Southeast | 54.0 | -2.7 |
| State | 55.0 | -0.4 |
Heating Degree Days
| May 2025 | Since July 1, 2024 | |||
|---|---|---|---|---|
| Division | Avg | Dept | Avg | Dept |
| Northwest | 328 | -29 | 8,075 | -574 |
| North Central | 368 | -8 | 8,252 | -507 |
| Northeast | 383 | 15 | 7,905 | -527 |
| West Central | 283 | 0 | 7,292 | -552 |
| Central | 307 | 15 | 7,147 | -588 |
| East Central | 368 | 41 | 7,051 | -525 |
| Southwest | 274 | 19 | 6,801 | -455 |
| South Central | 287 | 29 | 6,599 | -539 |
| Southeast | 353 | 69 | 6,621 | -380 |
| State | 333 | 36 | 6,979 | -482 |
Liquid-Equivalent Precipitation (Inches)
| May 2025 | Since Nov. 1, 2024 | |||
|---|---|---|---|---|
| Division | Avg | Dept | Avg | Dept |
| Northwest | 2.02 | -1.78 | 11.97 | -1.31 |
| North Central | 1.52 | -2.22 | 14.81 | 0.66 |
| Northeast | 1.58 | -1.9 | 16.79 | 2.86 |
| West Central | 3.07 | -1.26 | 14.97 | 0.19 |
| Central | 2.93 | -1.12 | 16.92 | 1.91 |
| East Central | 3.34 | -0.31 | 15.78 | 0.69 |
| Southwest | 2.83 | -1.62 | 15.76 | -0.91 |
| South Central | 3.4 | -0.76 | 13.98 | -2.75 |
| Southeast | 3.38 | -0.58 | 14.34 | -2.68 |
| State | 2.47 | -1.46 | 14.83 | 0.01 |
Snowfall (Inches)
| May 2025 | ||
|---|---|---|
| Division | Avg | Dept |
| Northwest | 0 | -0.4 |
| North Central | 0 | -0.4 |
| Northeast | 0 | -0.2 |
| West Central | 0 | -0.2 |
| Central | 0 | 0 |
| East Central | 0 | 0 |
| Southwest | 0 | -0.1 |
| South Central | 0 | -0.1 |
| Southeast | 0 | -0.1 |
| State | 0 | -0.2 |
Monthly, seasonal, and annual temperature and precipitation values and rankings published in this report are from NOAA’s National Centers for Environmental Information at the time of posting this climate summary. Values and rankings can change after publishing our climate summaries. To check the most recent values and rankings, visit NOAA’s National Centers for Environmental Information Climate at a Glance Tool.
This report is a product of the Wisconsin State Climatology Office. For questions and comments, please contact us by email (stclim@aos.wisc.edu) or phone (608-263-2374).