Extreme Weather Index (EWI)

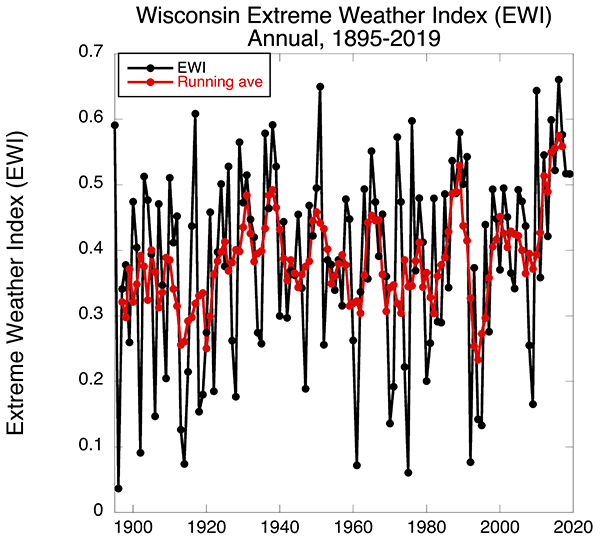
The Extreme Weather Index (EWI) is a metric developed by Wisconsin State Climatologist Steve Vavrus to quantify extreme weather in Wisconsin. It equally weights temperature and precipitation rankings on timescales of at least one month.

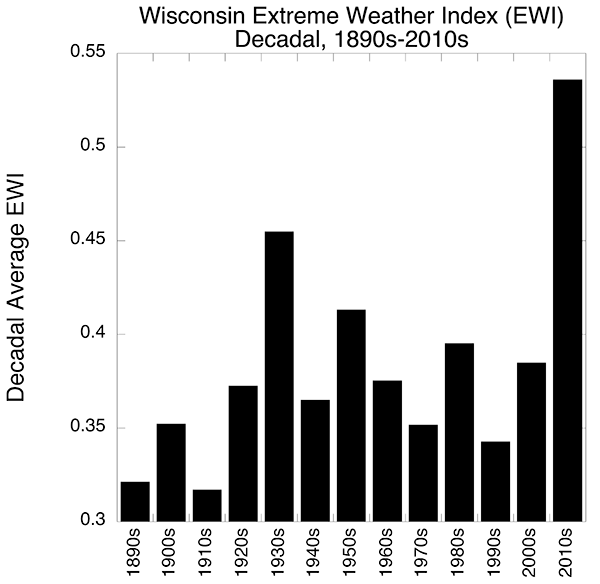
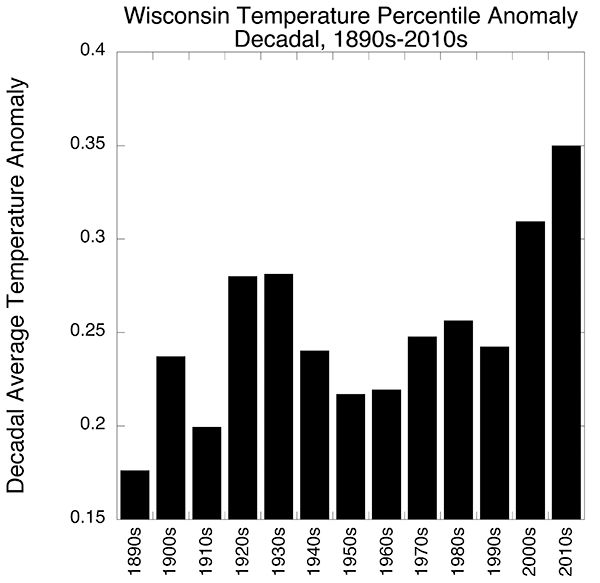
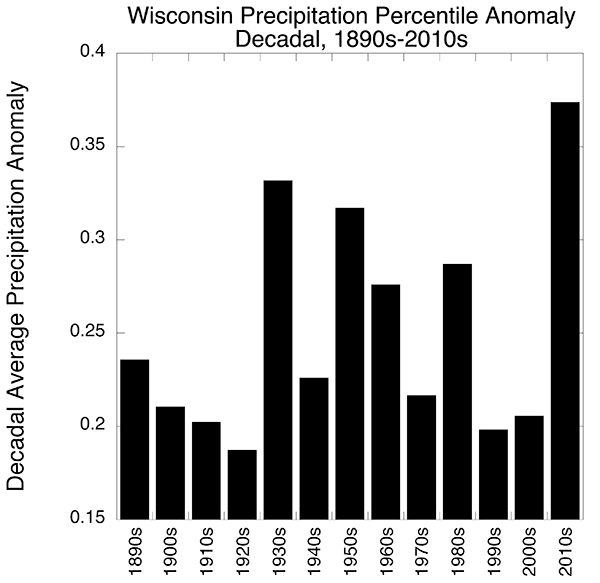
The statewide EWI based on annual temperature and precipitation shows unusually high values in recent years (through the 2010s). The highest EWI of any decade was the 2010s, caused by a record-high contribution from extremes in both temperature and precipitation.

A more detailed follow-up analysis of the EWI by month/season and region will shed light on how Wisconsin’s extreme weather has varied over time.

The extreme weather index shows a steady increase in values since 1900, with the highest values in the 2010s.
The Wisconsin Extreme Weather Index is based on annually averaged and statewide-averaged temperature and precipitation data.
Bar chart showing a clear increase in the extreme weather index in the 2010s compared to earlier decades.
The Extreme Weather Index shows a clear spike during the 2010s and a secondary peak during the 1930s Dust Bowl.
Bar chart showing a steady increase in temperature anomalies over the decades in Wisconsin.
The temperature extremes show a clear upward trend over time.
Bar chart showing the 2010s had the highest temperature anomalies of any decade in Wisconsin, but the 1930s, 1950s, and 1980s also had notable anomalies.
The precipitation extremes do not show the same upward trend.