September was remarkable with extreme warmth and dryness placing it among Wisconsin’s 10 warmest and 10 driest Septembers on record.
Unusually Mild Temperatures
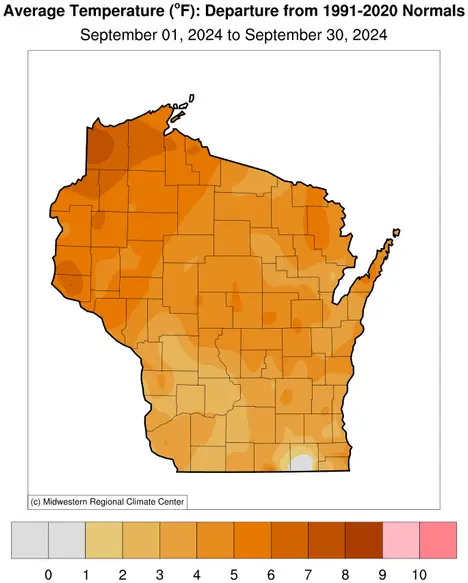
Summer was in no hurry to leave this year, as August-like warmth prevailed in Wisconsin throughout September. The monthly average temperature was a very mild 63.8 degrees, a hefty 4.3 degrees warmer than the 1991–2020 average and the state’s third warmest September since records began in 1895. In fact, this September was even warmer statewide than 18 Augusts on record. The unusual warmth occurred throughout Wisconsin, but was most pronounced in the northwest (Figure 1).
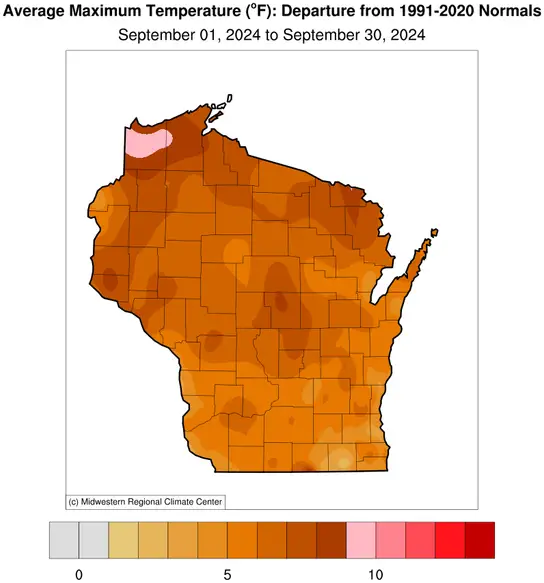
The very dry air masses that controlled our September weather led to exceptional daytime heating and very elevated daily high temperatures, which were more than five degrees above normal throughout most of Wisconsin and up to 10 degrees above in the far northwest (Figure 2). However, the dry air also promoted enhanced nighttime cooling, which meant that daily minimum temperatures exceeded normals much more modestly and in some places were even a tad below average (Figure 3).
On the whole across Wisconsin in September, daily high temperatures were much more impressive (6.4 degrees above normal) than were daily low temperatures (2.3 degrees above normal).

The most noticeable aspect of September’s near-record warmth was its consistency, especially during the middle of the month. Day after day from September 9 to 21, unusually warm temperatures soared into the 70s and 80s with hardly a drop of rain. Records were tied or set for the number of consecutive 80-degree days in many locations, including La Crosse (13 days), Madison (12 days), Green Bay (11 days), and Wausau (10 days).
Despite the persistent warmth in September, Wisconsin mostly escaped excessive heat: the highest temperature anywhere in the state was a tolerable 92 degrees set at several locations (Beloit, Boscobel, Fort Atkinson, Lone Rock and Whitewater). At the other end of the spectrum, the state’s lowest temperature dipped slightly below freezing (30 degrees) on September 7 at Couderay and at Fort McCoy near Sparta.
Dry Spells and Downpours
September started and ended with significant dryness, only to be interrupted by an impressive downpour. For the first three weeks of the month, dryness gripped the state, with only 25 percent of statewide average rainfall occurring by September 20. But on September 21, it was as if someone turned on the faucet and brought widespread one to two inch rainfall across southern Wisconsin.
A downburst occurred on the afternoon of September 21 between Arena and Mazomanie, damaging crops, trees, and outbuildings. Additionally, Madison received nearly four inches of rain, making it the city’s wettest September day on record and the fifth wettest day overall (Figure 4). In the aftermath of the September 21 to 22 storms, widespread dryness returned to most of the state, with the exception of southeastern Wisconsin averaging over an inch of precipitation the last week of the month.
| Date | Precipitation (in.) |
|---|---|
| August 8, 1906 | 4.96 |
| June 17, 1996 | 4.51 |
| July 21, 1881 | 4.32 |
| August 6, 2008 | 4.11 |
| September 22, 2024 | 3.97 |
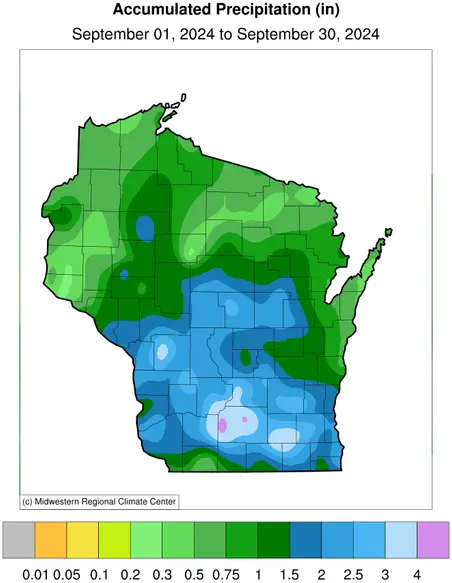
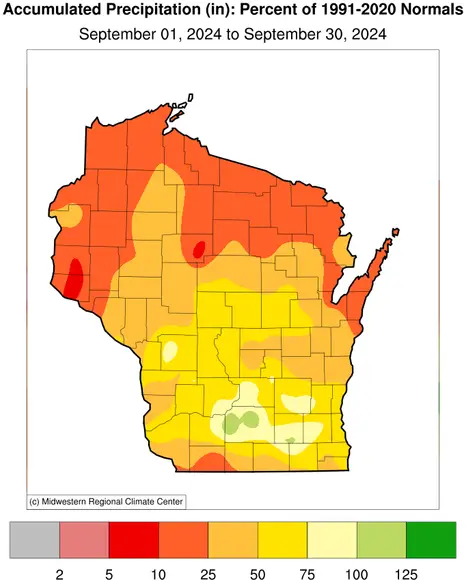
The state averaged only 1.35 inches of precipitation during September, a stark contrast to the normal 3.59 inches (Figures 5, 6, and 7). Northern Wisconsin was the most hard-hit region, receiving a staggering 23 percent of its normal September precipitation. Medford and Rhinelander topped out at their very driest Septembers on record. Medford did not get a single drop of rain all month, while Rhinelander saw a mere 0.35 inches (Figure 8).
Central and southern Wisconsin also lacked rainfall, but not as severely, at 40 and 61 percent of normal, respectively. These deficits placed September 2024 as the sixth driest September on record, with just 38 percent of typical statewide rainfall.

| Location | Period of Record Start | Ranking | Precipitation (in.) |
|---|---|---|---|
| Medford | 1889 | 1 | 0 |
| Rhinelander | 1893 | 1 | 0.35 |
| Baldwin | 1947 | 1 | 0.21 |
| Ellsworth | 1908 | 2 | 0.15 |
| Minocqua | 1903 | 2 | 0.45 |
| Spooner | 1894 | 3 | 0.62 |
Deepening Drought
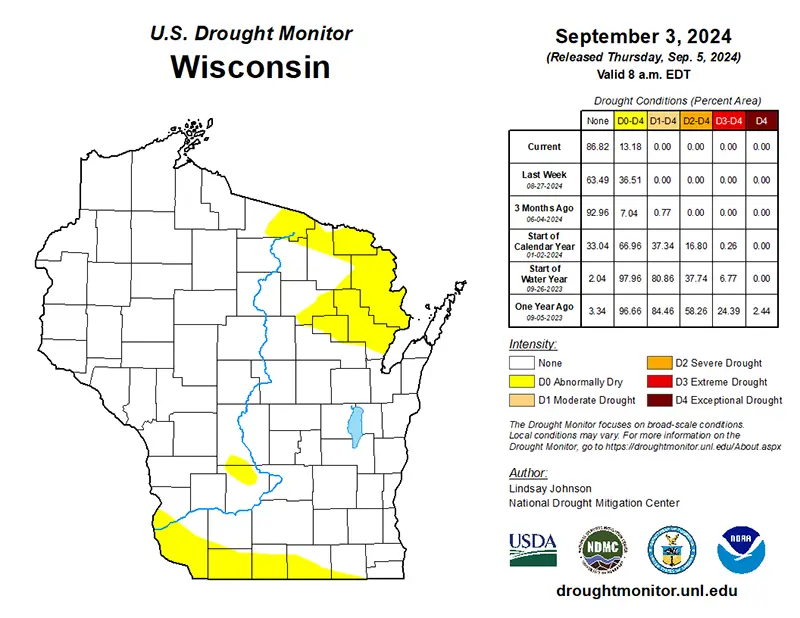
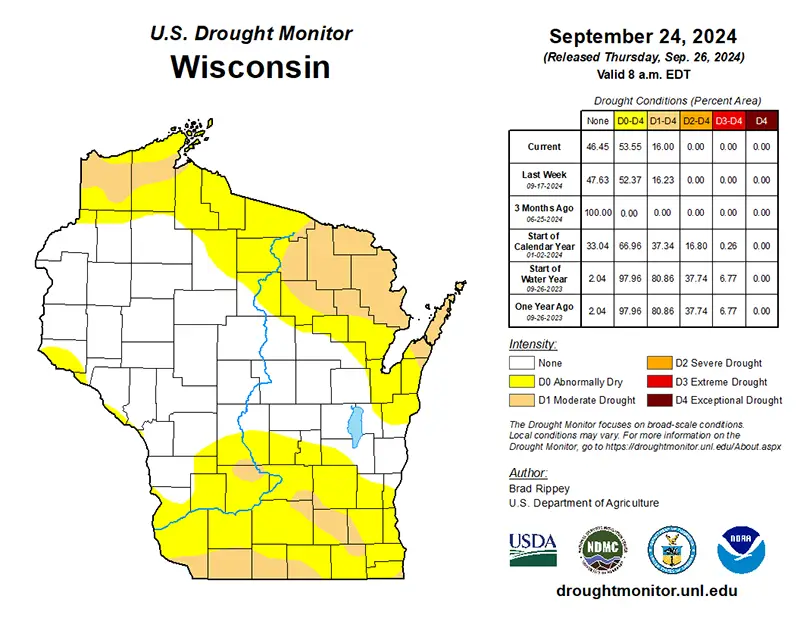
Due to the precipitation shortfall, 13 percent of the state was designated as abnormally dry at the beginning of the month by the U.S. Drought Monitor (primarily in northern Wisconsin), which escalated to moderate drought conditions spanning 16 percent of the state (including northern and south-central Wisconsin) by the end of the month (Figures 9 and 10). View current drought conditions for Wisconsin
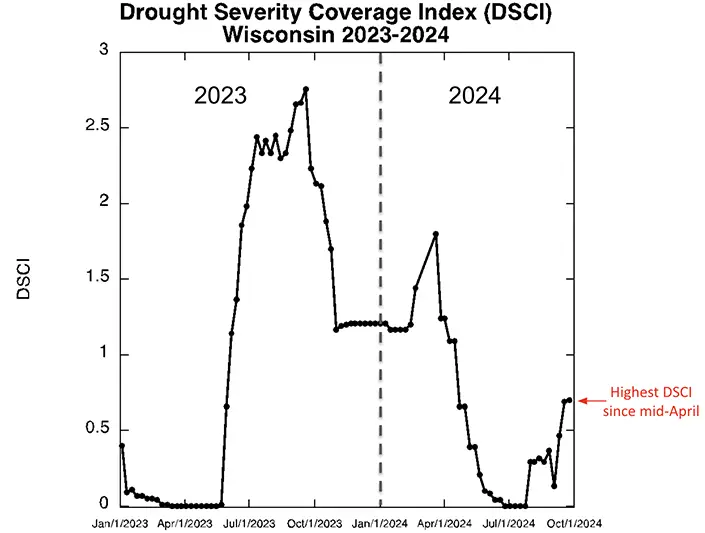
Another way to assess drought conditions is by the Drought Severity and Coverage Index (DSCI). The DSCI is the conversion of drought levels from the U.S. Drought Monitor into a combined measure of both severity and spatial extent. While we’re nowhere close to last year’s conditions, the end-of-September DSCI value of 0.70 indicates the most pronounced drought conditions in the state since April (Figure 11).
A Rare Combination of Extremes
September’s combination of heat and dryness is an example of a “compound extreme,” meaning that more than one weather variable is greatly abnormal at the same time. As stated earlier, last month landed among the 10 warmest (third place) and driest (sixth place) Septembers on record.
Such top-10 compound extreme months are very rare. Based on long-term data since 1895, Wisconsin has only experienced 31 months, or two percent of all months, with a compound extreme for temperature (warm or cold) and precipitation (wet or dry). The last time this happened was in March 2016, so September 2024 was an odd month indeed!
Harvest Challenges
In addition to the ongoing warm, dry conditions raising fire risk across the state, the hot and dry end of August and September contributed to a rapid drying of soybeans and corn. Soybeans harvested in September came in smaller — some as small as BBs — and moisture levels were just 9 to 11 percent, as opposed to the optimal 13 percent, which can lead to the reduced yields.
Dry conditions also impact winter wheat because without adequate moisture, the fall-planted crop may not germinate properly, potentially affecting quality and quantity come spring. Additionally, dry conditions have impacted forage, forcing ranchers to seek alternative feed sources for cattle and sparking concerns that dusty conditions could lead to respiratory problems in weaned calves.
However, moisture levels varied statewide, with corn for grain not quite dry enough to harvest by the end of September. Furthermore, the Oneida Nation’s harvest was not as fruitful as hoped this year, with heavy spring rains leading to reduced yields of white corn, a culturally significant crop. The Oneida farmers and Indigenous communities around Wisconsin and the nation have faced hardships adapting to changes in our weather and climate patterns, which threaten their agricultural heritage and food security.
Overall, while the dryness was convenient for getting equipment in the field for harvest, it’s been a challenging month and growing season for Wisconsin.
Outlook
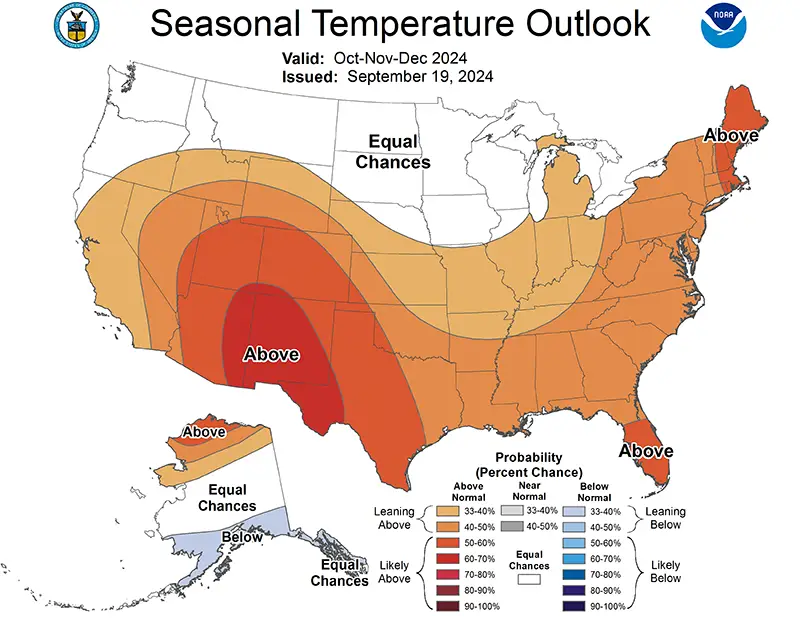
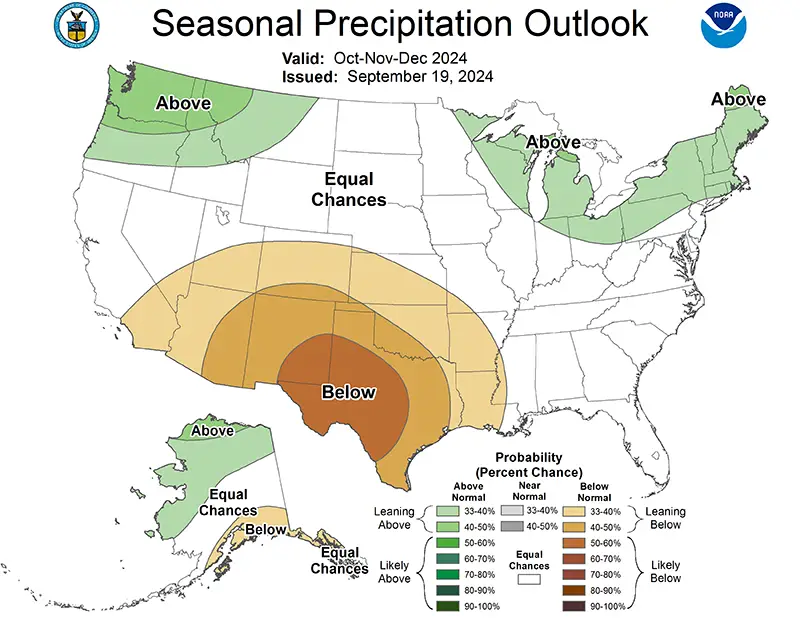
The National Oceanic and Atmospheric Administration’s seasonal outlook indicates no clear signal regarding temperature for the late fall and early winter (Figure 12), following a series of outlooks that consistently projected warmer-than-normal conditions. Precipitation forecasts are mixed, with a slight tendency toward above-normal in eastern and northern Wisconsin, while western Wisconsin has equal probabilities for above, near, or below normal precipitation (Figure 13).
Although the precipitation outlook reflects only a slight tendency for above-normal conditions, it offers the potential for at least some relief from the severity of the ongoing drought.
Climate Corner
What happens to rain and snow after it lands?
About two-thirds of it goes right back into the air through a process called evapotranspiration, a combination of evaporation (liquid water turning into vapor from surfaces like soil and from water bodies such as lakes and rivers) and transpiration (plants releasing water vapor into the atmosphere). As for the rest of the precipitation — about one-third — it runs off into our streams, rivers, and lakes, contributing to surface water supplies.
Hydrologists keep track of runoff using the concept of a “water year.” In the U.S., the water year starts on October 1 and runs through September 30 of the following year. This period is chosen to align with the start of the soil moisture recharge season, when rainfall begins to replenish what was lost during the dry summer months.
For example, precipitation in Wisconsin tends to be relatively light in early October — about 0.05 inches of rain per day — and as the months go on, the rain turns to snow. If the ground is frozen, that snow will stay on the ground until it melts, contributing to runoff. Wisconsin’s 2019 water year produced the most runoff, with nearly 30 inches, while the 1934 water year during the Dust Bowl generated the least, at just over five inches.
The U.S. Geological Survey calculates the trends in runoff using streamflow data, which helps us understand long-term changes in water availability. The 2025 water year, which began on October 1, will continue this monitoring to track how much of our precipitation contributes to surface water, helping us plan for future water needs.
Steve Vavrus is the Wisconsin state climatologist. Bridgette Mason and Ed Hopkins are the assistant state climatologists.