October was another warm and dry month in Wisconsin, featuring summerlike temperatures and rapidly escalating drought conditions.
Rare Fall Warmth
October brought a wave of historic warmth, shattering late-season records and surprising Wisconsinites with almost summerlike temperatures. In Madison, temperatures climbed to 82 degrees on October 29, tying the latest 80-degree reading on record — a benchmark set back in 1937. Green Bay also made history that day with its latest 80-degree reading, nearly a full week later than its previous record in 1899 and a remarkable 30 degrees above average. Despite the late-month excitement, the warmest temperature anywhere in the state this October was 86 degrees on October 11 recorded at the Boscobel Airport.
The rare fall warmth led right into Halloween morning, for example, Bristol (Kenosha County) was a mild 71 degrees at 1:30 a.m., until a mid-day cold front dropped temperatures into the 30s and 40s statewide in the early evening when trick-or-treaters roamed the streets. With a statewide average temperature of 48.3 degrees, this was one of the warmest Halloweens in recent years. Wisconsin did not just see record highs during the day, either. Madison set new records for nighttime warmth around Halloween, with unusually warm low temperatures of 65 degrees on October 29 and 64 degrees on October 30.
The month’s abundance of clear skies played a major role in this temperature pattern. Clear days allowed for more sunlight to heat the ground, while clear nights allowed for cooling. Hence, we saw large maximum temperature departures from normal (8.3 degrees above normal), but not as large minimum temperature departures (2.1 degrees above normal) (Figure 1). However, Wisconsin also saw much cooler temperatures, with the state’s lowest temperature of 16 degrees on October 16 at Fort McCoy near Sparta.
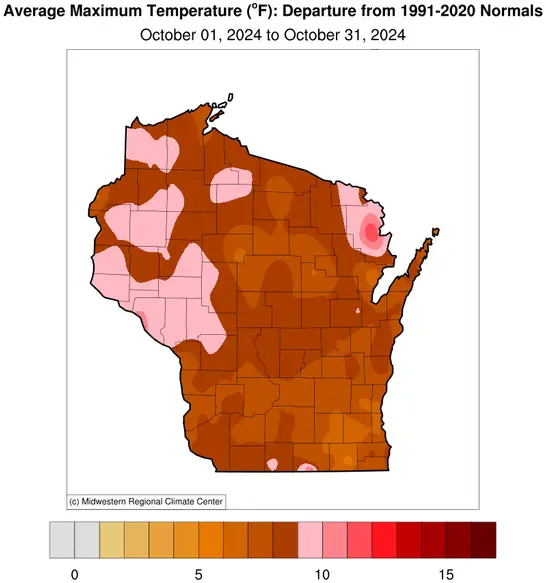
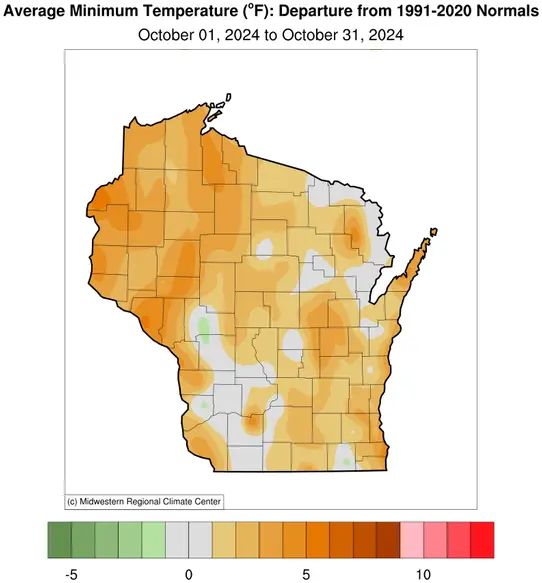
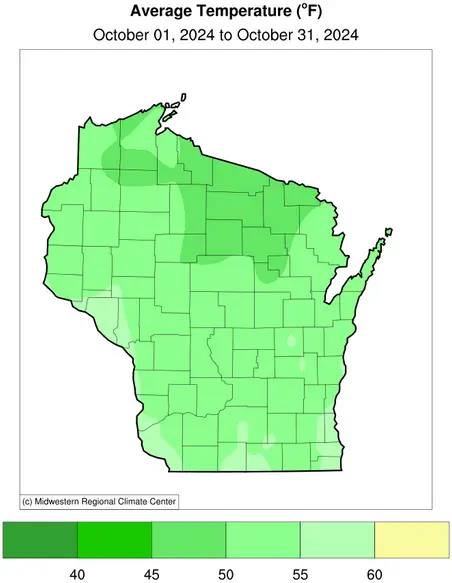
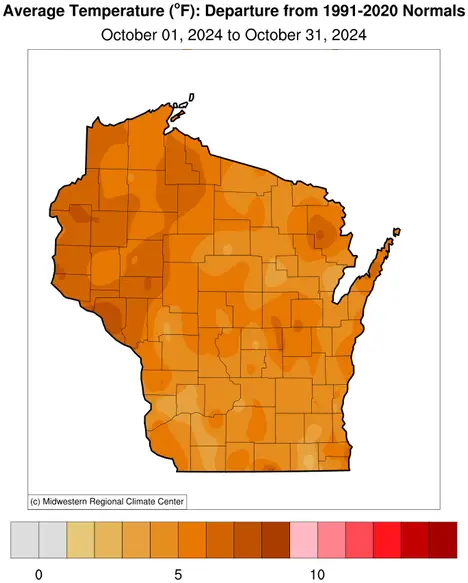
By month’s end, temperatures averaged 52 degrees, 5.2 degrees above the 1991–2020 normal and the 12th warmest October on record (Figure 2). Even more impressively, the past two months have been Wisconsin’s warmest September–October period on record (58 degrees).
Notably Dry
October was notably dry across Wisconsin, especially the first three weeks of the month. The statewide monthly precipitation totaled only 1.71 inches, a mere 57 percent of the normal 3.01 inches. Importantly, most of this rain arrived in the final days of the month, leaving the majority of October exceptionally dry. Between October 1 and 23, there were very few days with measurable precipitation across the state. Madison had only three days, Milwaukee had five days, and La Crosse set a new record with no wet days at all.
All told, 29 stations across the state reported no measurable rain for the entire first three weeks of October. By contrast, the final two days of the month produced the lion’s share of precipitation over much of the state, especially the southern half, where a swath of heavy rain from two to four inches occurred from southwest to east-central Wisconsin on October 30 and 31 (Figure 3).
Several stations across south-central and southwest Wisconsin received 3.7 and 4.1 inches of rain within 24 hours. A station in Lafayette County near Cuba City set a 24-hour maximum precipitation record of 3.80 inches, while Mt. Horeb in Dane County picked up a record 3.70 inches. The Halloween storm system also delivered the first measurable snowfall across Wisconsin, with one to three inches in the northwest and a statewide high of 6.5 inches at Upson in Iron County.
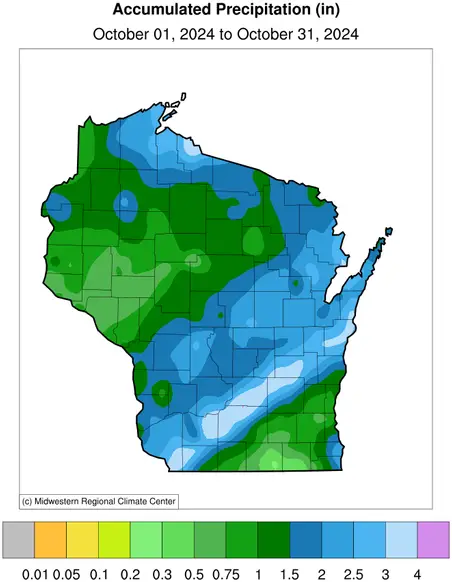
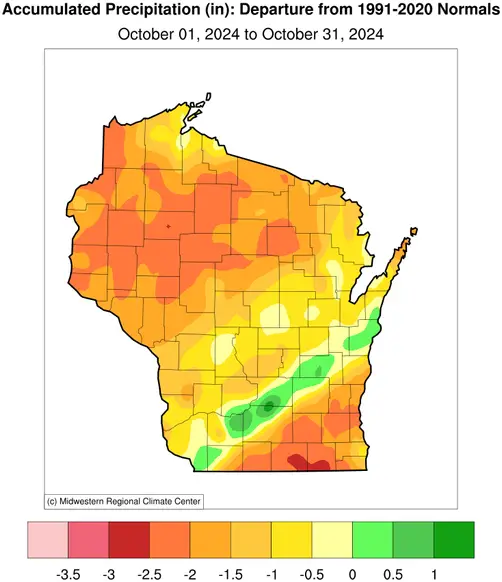
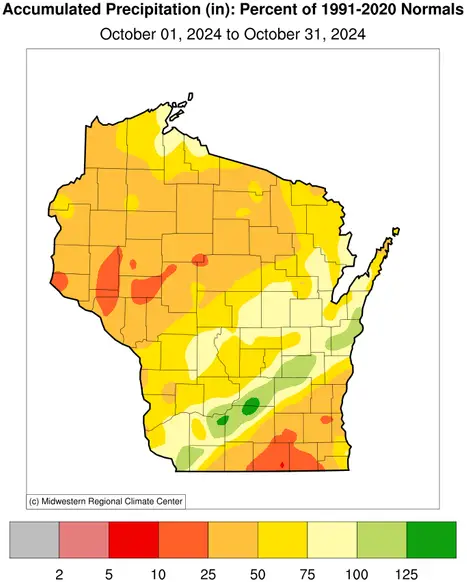
The vast majority of Wisconsin continued the late summer-early fall dry spell throughout October (Figure 4). Precipitation totals were two inches or more below normal over most of the northern half of the state, especially in the northwest, where some locations received less than one quarter of average October precipitation. The other comparably dry parts of the state were the far south-central and southeast regions, which sustained similar anomalies.
The huge hydrologic relief provided by the two days of late-October rainfall can be seen by comparing the amount that fell on October 30 to 31 (Figure 3 cited previously) with the map of month-long precipitation in Figure 5. Despite this tail-end deluge, the past two months represent Wisconsin’s sixth driest September to October period on record.

Worsening Drought
Drought conditions escalated throughout October, as shown in the U.S. Drought Monitor. Wisconsin began October with 30 percent of the state under moderate drought conditions (D1) and just eight percent in severe drought (D2). By October 29, however, 68 percent of the state was in moderate drought and the remaining 32 percent in severe drought.
Furthermore, as of October 29, Wisconsin, New Jersey, and Delaware were the only three states in the entire U.S. that were entirely in drought (D1 or worse), marking the very first time in U.S. Drought Monitor history that Wisconsin was completely drought-stricken (Figure 6).
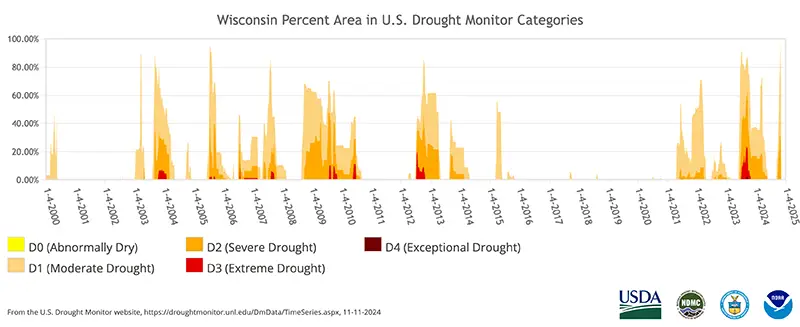
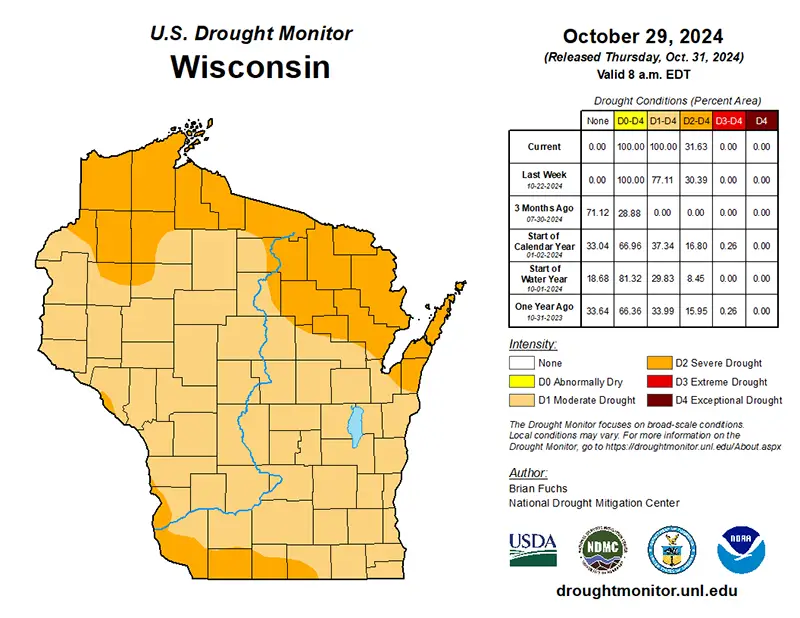
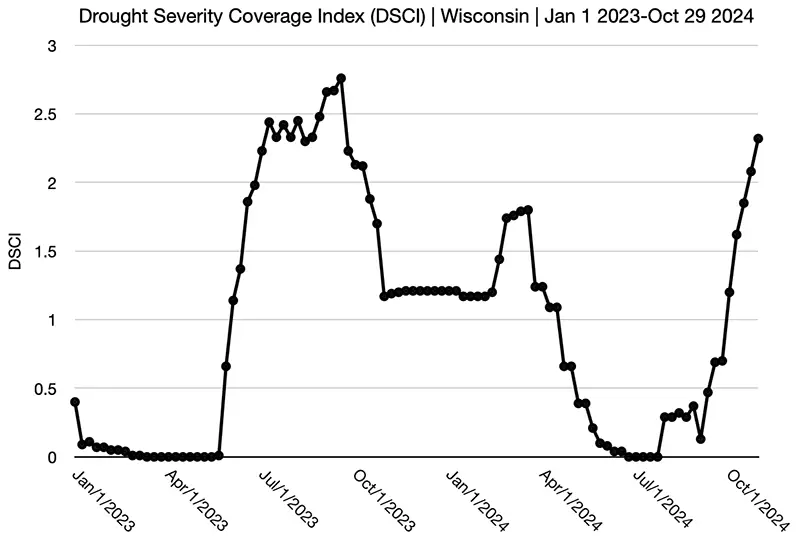
This historical event sent the Drought Severity Coverage Index skyrocketing to levels Wisconsin had not seen since September of last year, when we reached peak annual drought conditions (Figure 7).
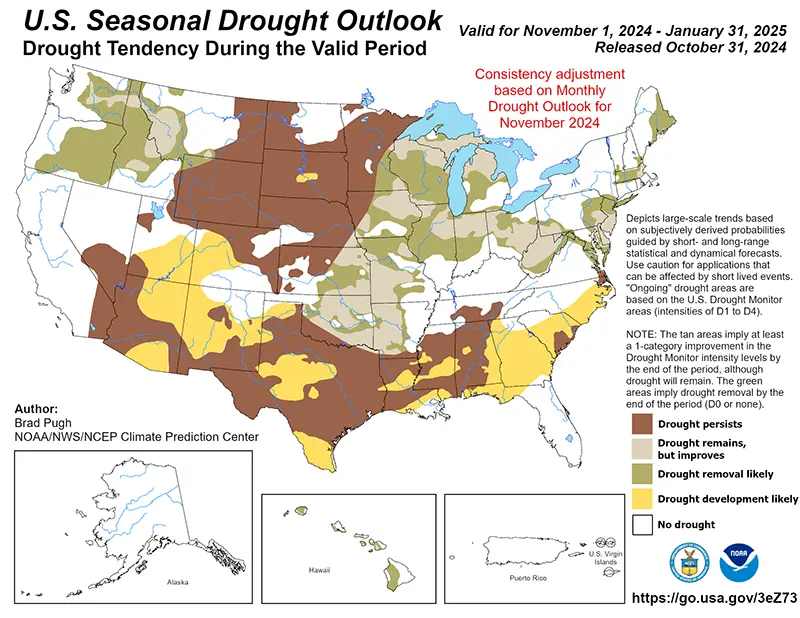
On October 31, the Climate Prediction Center released its seasonal drought outlook for November 1 through January 31, showing that drought is expected to remain in far southwestern and northern Wisconsin (Figure 8). However, drought is likely to end for the majority of Wisconsin.
Low Moisture in Soils and Streams
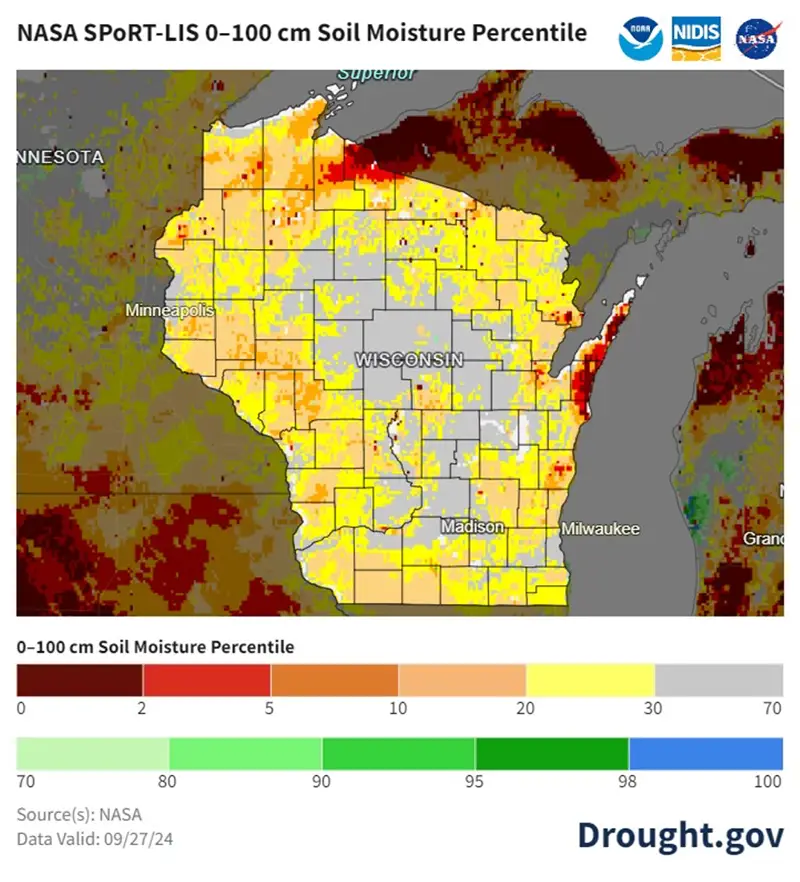
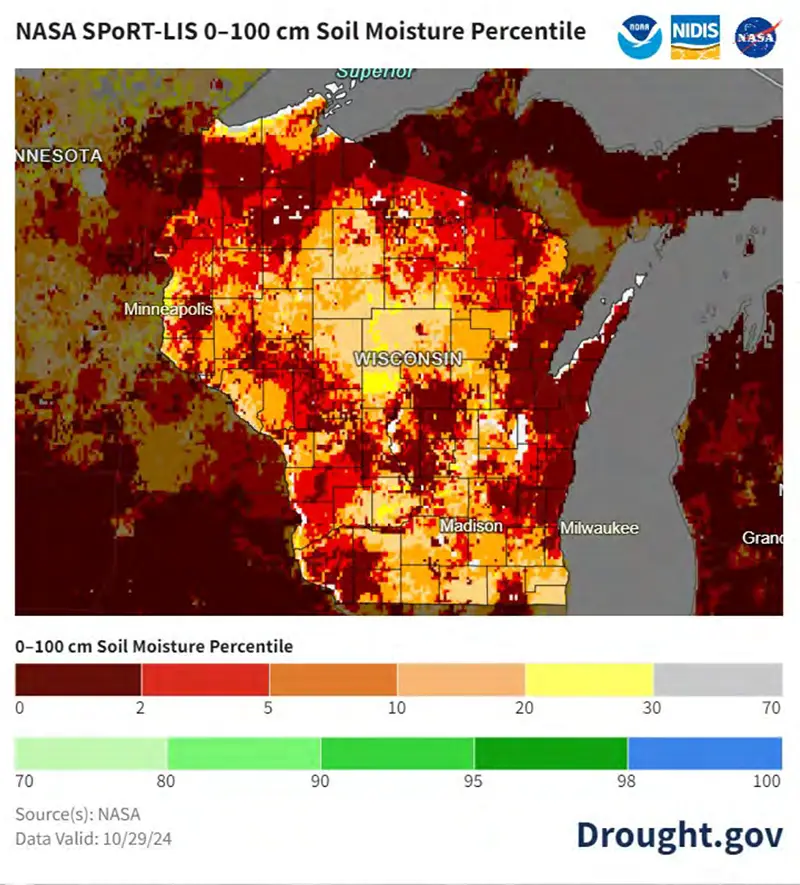
Wisconsin’s soils and streamflows continued to show signs of a lack of moisture. At the start of the month, most areas in the state had soil moisture levels within the upper meter at or below the 30th percentile, with a few counties dropping to the 10th percentile or lower (Figure 9). By the end of the month, conditions worsened significantly, with many counties in the 2nd percentile. While the late-October precipitation helped moisten the topsoil, it barely permeated 20 centimeters below the surface and did not reach to 40 centimeters.
Averaged over the entire month, streamflow across much of central and southern Wisconsin was considered to be near normal (Figure 10). However, many of the U.S. Geological Survey stations in northern and southeastern Wisconsin were below or much below normal, with three reaching record lows for October: the Fox River in Oshkosh (29-year period of record), the Menomonee River in Menomonee Falls (47-year period of record), and the Kinnickinnic River in Milwaukee (40-year period of record).
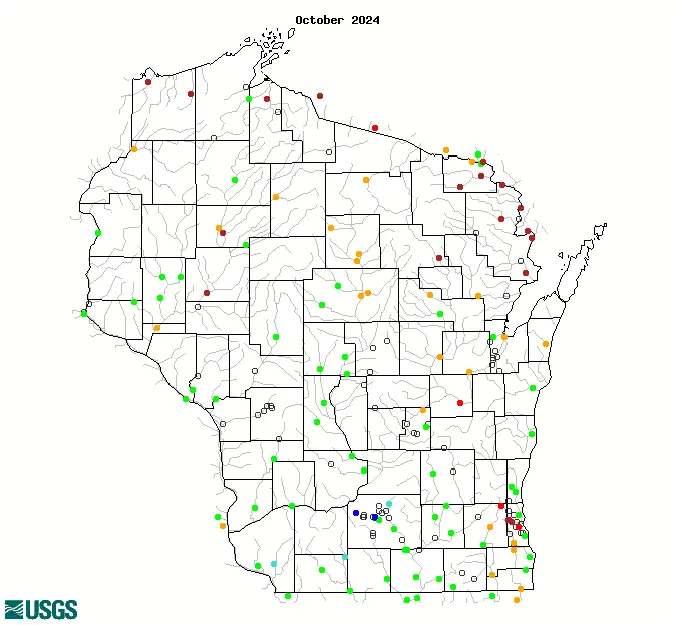
| Category | Percentile Range | Color |
|---|---|---|
| Low | Red | |
| Much Below Normal | Less than 10 | Brown |
| Below Normal | 10-24 | Orange |
| Normal | 25-75 | Light Green |
| Above Normal | 76-90 | Turquoise |
| Much Above Normal | Greater than 90 | Blue |
| High | Black | |
| Not Ranked | White |
Moreover, for the third consecutive year, low water levels in the Mississippi River are causing navigational challenges, hindering goods transport, and enabling saltwater intrusion, which could impact municipal and industrial water supplies. It is anticipated that the lower Mississippi’s flow will remain low until late fall or early winter, as both the upper Mississippi and the Ohio and Missouri River Basins, all major contributors to the lower Mississippi’s flow, need time to recharge.
Wrapping Up a Warm, Dry Harvest
As we neared the end of the growing season, the USDA’s National Agricultural Statistics Service Crop Progress and Conditions Report noted that Wisconsin consistently saw six days suitable for fieldwork each week in October, thanks to the prolonged dryness. These conditions moved fall harvest along quickly and helped farmers with planting cover crops, seeding winter wheat, spreading manure, and fall tillage. Soybean harvest was practically complete by the end of October, and corn for grain was two-thirds of the way there.
Unfortunately, the warm, dry weather hindered pasture conditions. Additionally, the Wisconsin Wildfire Dashboard showed that 198 fires broke out in October and burned just over 1,000 acres, with 19 fires reportedly related to tractors, mowers, and brush hogs. Fortunately, the concerns that growers were having in September regarding inadequate soil moisture levels for fall-planted crops were lifted, as these crops emerged within a few weeks of planting.
Outlook
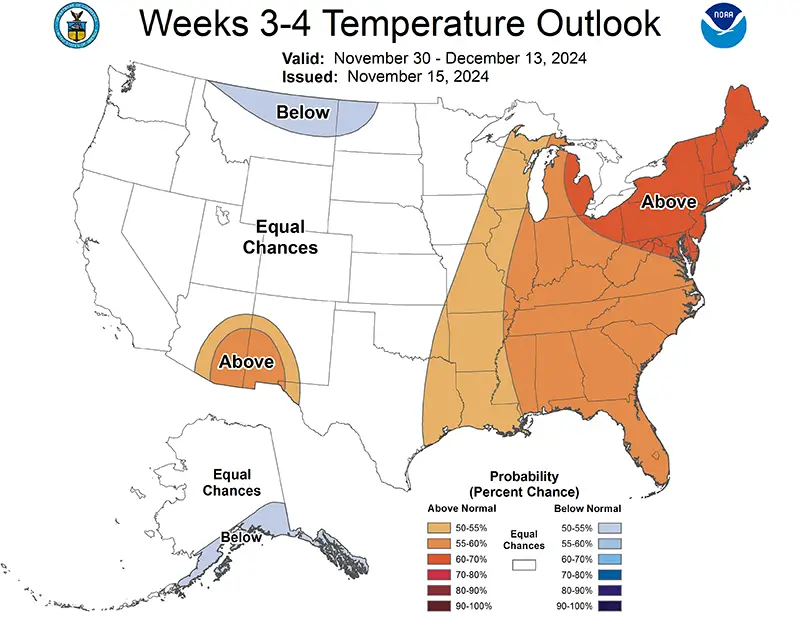
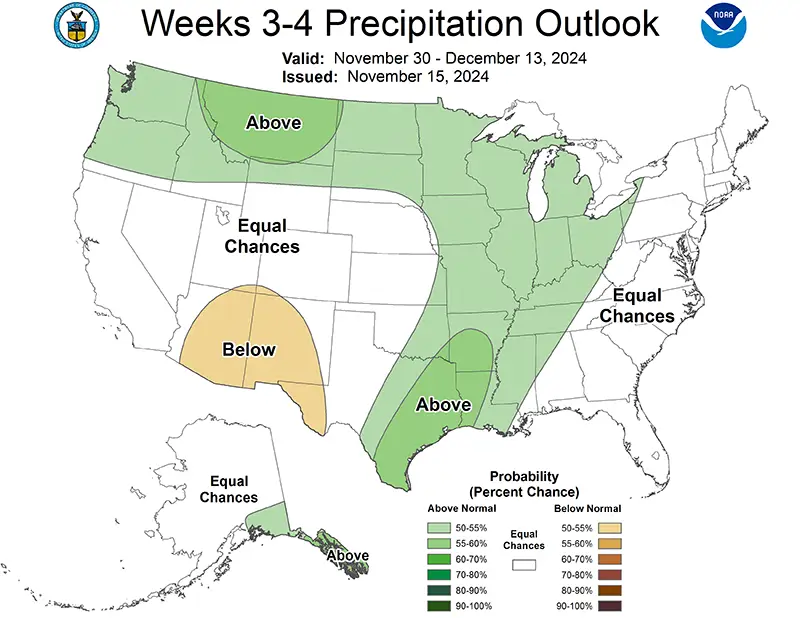
In the short term, the National Oceanic and Atmospheric Administration’s Climate Prediction Center’s outlook for November 30 to December 13 indicates slightly elevated chances for abnormally wet and warm conditions in our state, with the exception of equal chances for above, near, or below normal temperatures in northwest Wisconsin (Figure 11).
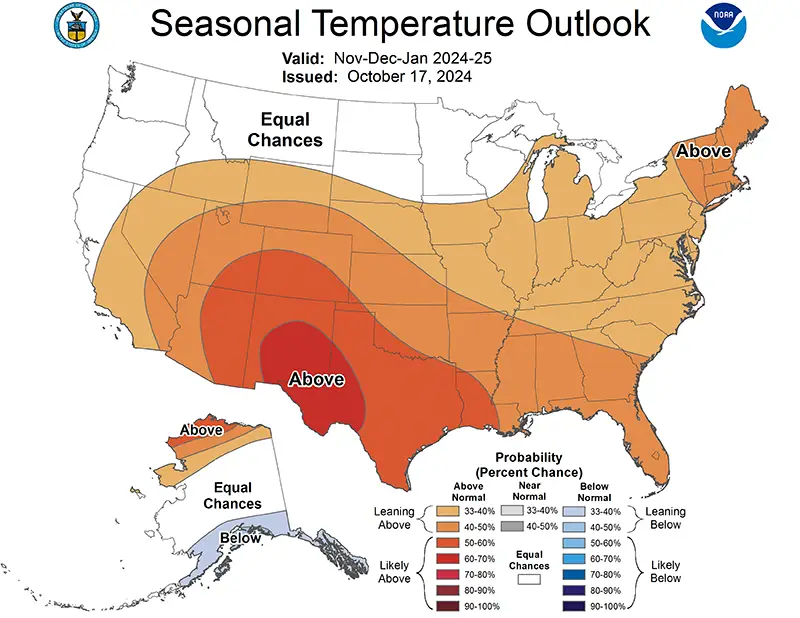
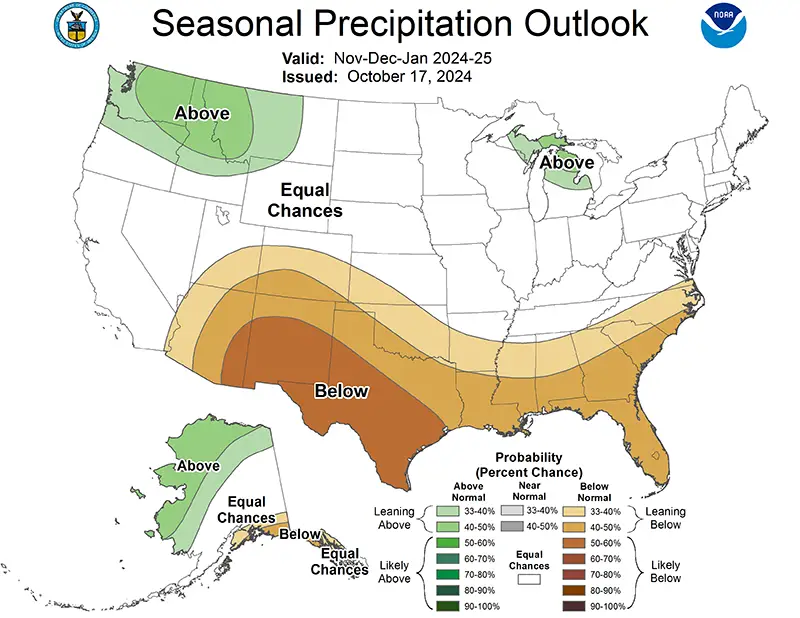
Similarly, there is no strong signal for either temperature or precipitation between November and January (Figure 12). The exceptions are a slight lean toward warmer temperatures for southern and eastern Wisconsin and wetter-than-normal conditions to the northeast of Wisconsin, the latter of which may be a sign of La Niña.
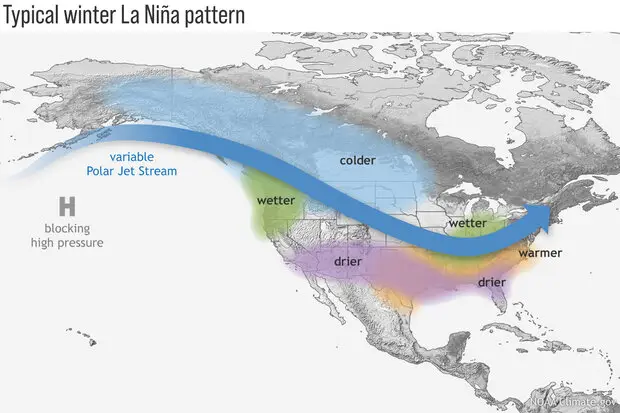
During La Niña winters, the polar jet stream typically shifts north over the eastern Pacific Ocean and dips south across the eastern U.S., bringing colder and wetter conditions to the northern U.S., while the weakened subtropical jet stream favors drier winters in the southern U.S. (Figure 13). This type of weather pattern typically leads to an increase in snowfall around Wisconsin. While snowfall can vary with each La Niña, a strong pattern shows above-average snow in the Great Lakes areas.
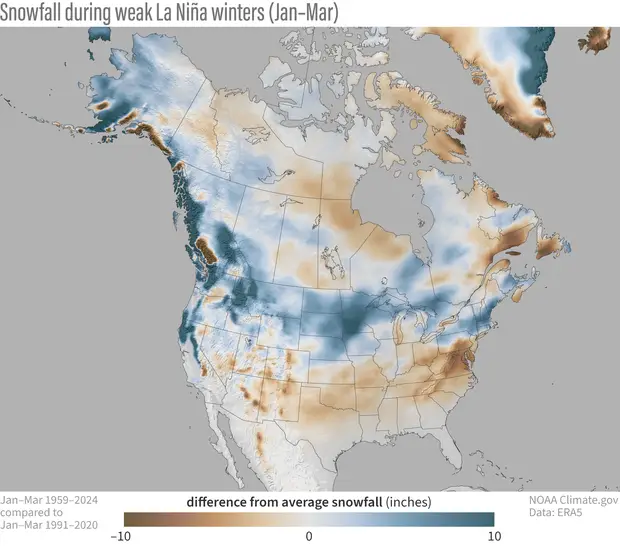
In weak La Niñas, like the forecasted one this winter, snowfall patterns are similar but less pronounced, with northern Wisconsin and much of the northern U.S. likely seeing more snow than normal (Figure 14). However, there is still a decent chance (25 percent) that La Niña will not officially form at all this winter. Whether or not La Niña forms, winter impacts in Wisconsin and the Midwest can be affected by many factors, including short-term weather events and long-term trends, like Wisconsin’s warming winter trend (see the Winter 2023-24 Climate Summary).
Climate Corner
Q: What are the “Gales of November?”
A: As November arrives, the changing atmospheric circulation over midlatitudes introduces intense early winter storms to the Upper Midwest and Great Lakes. These storms, famously dubbed the “Gales of November,” are driven by increased temperature and moisture contrasts between the warm Gulf Coast and cold Arctic air masses from Canada, setting the stage for powerful polar front cyclones along the jet stream.
As these storms organize, a warm sector of tropical air is situated southeast of the storm’s center, while a cold front drives arctic air southward on the northwest side, intensifying wind and snow as it progresses. The jet stream, a high-altitude ribbon of fast-moving air, guides these systems eastward. When these storms move over the Great Lakes, they gain additional moisture and heat as the lakes are warmer than the surrounding air, further intensifying their winds and precipitation.
Noteworthy examples include the “Great Blue Norther” of 1911, which brought sudden temperature drops of up to 63 degrees in Wisconsin and caused rare November tornadoes. The “Armistice Day Storm” of 1940 trapped hunters in blizzard conditions, resulting in over 150 fatalities and widespread cattle loss due to unexpected snowfall and strong winds. In 1975, a gale-force storm caused the tragic sinking of the Edmund Fitzgerald, with 29 crew members lost.
Lake Michigan shipping is especially vulnerable in November due to high waves driven by wind speed, duration, and open-water distance (fetch). Even 40 mile per hour winds can generate waves of 25 feet, enough to capsize vessels. As the Great Lakes remain warmer than the air above them, extreme temperature differences can reach 15 to 17 degrees over Lake Superior, creating additional instability. Over time, the northward shifting of these storm tracks could lead to changes in winter precipitation types over the Midwest and Great Lakes, from snow to rain or mixed precipitation events.