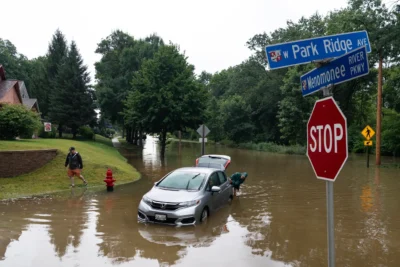
A deluge in southeast Wisconsin on August 9, 2025, caused disastrous flooding in Milwaukee and Waukesha Counties as local rain gauges measured nearly a foot of rain in about 10 hours.
The highest rainfall measurement was a staggering 14.55 inches reported on the north side of Milwaukee.
Wisconsin’s 24-hour rainfall record has stood at 11.72 inches for nearly 80 years — a total measured in the city of Mellen in Ashland County on June 24, 1946. This new Milwaukee measurement surpasses the record by nearly three inches!
However, climatologists don’t just declare state records willy-nilly. Rather, a task force of experts is created, and a meticulous process is followed to ensure the validity of the measurement before it can go down in the record books.
Why Verify Records?
Records don’t just make an event more notable or memorable, but they become part of the climate history for that place, so they need to be accurate. If a high temperature record was measured on a thermometer in the middle of a blacktop parking lot, that reading will be skewed and unusable.
Emergency managers, city planners, and engineers use the weather extremes of a place to know what conditions to prepare for. Homes and infrastructure need to be able to withstand the worst conditions that the region could realistically experience.
Extremes Committee, Assemble!
The National Centers for Environmental Information (NCEI) began using State Climate Extremes Committees in 2006 to fill the need for proper evaluation of record reports on a state level. A new committee is formed after a potential all-time record event.
Committees are comprised of representatives from five organizations: the local National Weather Service (NWS) office, the NWS Regional Headquarters, the state’s Climatology Office, the area’s Regional Climate Center, and NCEI.
Records from the “Olden Days”
Karin Gleason, a Monitoring Section Chief at NCEI, coordinates the record-verification process. She explained that after the official evaluation process was established in 2006, NCEI worked with state climatologists to determine a baseline for each state.
They dug through records and agreed on the most likely known historical records, including those for all-time maximum and minimum temperature, greatest 24-hour precipitation, monthly maximum snowfall, and all-time maximum snow depth. – Karin Gleason
But what about the really, really old records? Like Wisconsin’s all-time hottest temperature from 1936?
Gleason says that they have to trust the process with those.
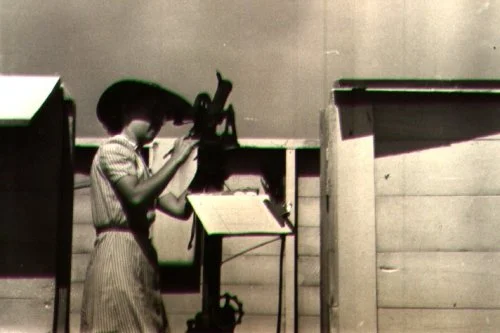
For these early records, we know that they were observed by NWS instruments and/or observers and were part of a national network of stations. That means they are calibrated, inspected regularly, sited properly, and operated by people who have been trained. Knowing this, there is a certain amount of trust involved, but many of those NWS observers from the “early days” were some of the most proud and dedicated observers, taking their work very seriously. – Karin Gleason
Passing the Test
The reliability of the reporting site is a large factor in whether or not its measurement is considered legitimate. The length of the site’s reporting history can help prove the accuracy of the equipment, as can records of how often the equipment is calibrated.
There are strict guidelines for where and how a site should be set up to get the most accurate measurements.
Thermometers should be in an open area to provide ventilation, while rain gauges should be more protected from wind to avoid precipitation being blown into the gauge, yet still away from overhanging trees.
A report from an imperfect site location won’t be disregarded, but influencing factors like overhanging tree limbs are taken into account when considering measurement accuracy.
Before this summer’s deluge, the most recent all-time record in Wisconsin was set during a cold snap in February 1996. On February 2 and 4, the small village of Couderay in Sawyer County reached a low temperature of -55 degrees Fahrenheit! That took the cake from Danbury (Burnett County) to become Wisconsin’s all-time coldest temperature.
Reports that Don’t Make the Cut
Gleason says that it’s often the human component of reporting to blame for potential records not passing the test.
Often, observers will put instruments and rain gauges near their house for convenience or mount [them] to a fence or near a tree line. Also, observing large snow events properly is tricky, and often, observers measure too frequently or don’t site their snow board well or clear it completely after a measurement. – Karin Gleason
A recent example of a record event in Wisconsin that didn’t make the record books was in August 2018. Over a foot of rain fell in western Dane County, washing out roads and flooding homes. Numerous 12 to 15-inch reports were investigated, but none held up to NCEI equipment or site standards.
Did the Milwaukee Report Pass the Test?
The 14.55-inch Milwaukee rainfall report in question came from a gauge on top of James Madison High School, and is maintained by the Milwaukee Metropolitan Sewage District (MMSD). The weather station was set up in August 2011, giving the site a 14-year history to prove its accuracy.
Representing NWS Milwaukee/Sullivan, Observing Program Leader Ben Miller was tasked with assessing the weather station as part of the State Climate Extremes Committee.
My primary focus on my initial visit to the gauge location was the siting and calibration of the gauge. I wasn’t really concerned with either of those issues as I knew from past experience that the gauges were installed correctly and were annually calibrated in the spring. This gauge was no different. – Ben Miller

To avoid the influence of wind on precipitation measurements, a fence-like wind screen had been placed around the gauge when it was initially installed, so the location of the site cleared Miller’s inspection.
But there was one potential issue: the calibration of the gauge was off.
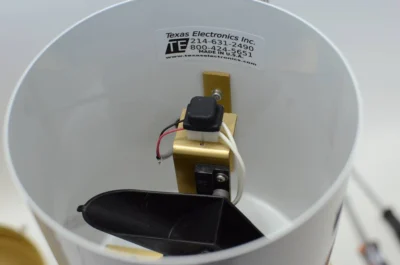
Rather than a typical rain gauge you’d see in a backyard, this site had a tipping bucket rain gauge. As precipitation falls, a small bucket inside the gauge fills up with 0.01 inches of water, tips the water out, and a sensor counts the number of tips.
The volume of water used for calibration should produce 100 tips. The first attempt only yielded 91 tips. MMSD technicians cleaned the gauge and tried again. The second attempt had 95 tips, which was just inside the gauge specifications of above or below five percent. – Ben Miller
MMSD’s calibration check of the gauge a month prior showed that it had produced 96 tips, also within the margin of error. This means that the rain gauge was under-reporting the amount of water it was capturing. In other words, the rainfall on August 9 was likely even greater than what the instrument measured!
Wisconsin’s Newest Record
With confidence in the location and calibration of the equipment, all five representatives of the Extremes Committee approved the 14.55-inch measurement as a new record for single-day rainfall in Wisconsin. Ed Hopkins, Assistant State Climatologist, served as our office’s representative on the Extremes Committee.
Higher rain totals of 15 to 16 inches were reported at nearby locations during this extreme rain event, but none met NCEI site standards.
This event highlights the need for flood mitigation and planning in areas not typically considered flood-prone.
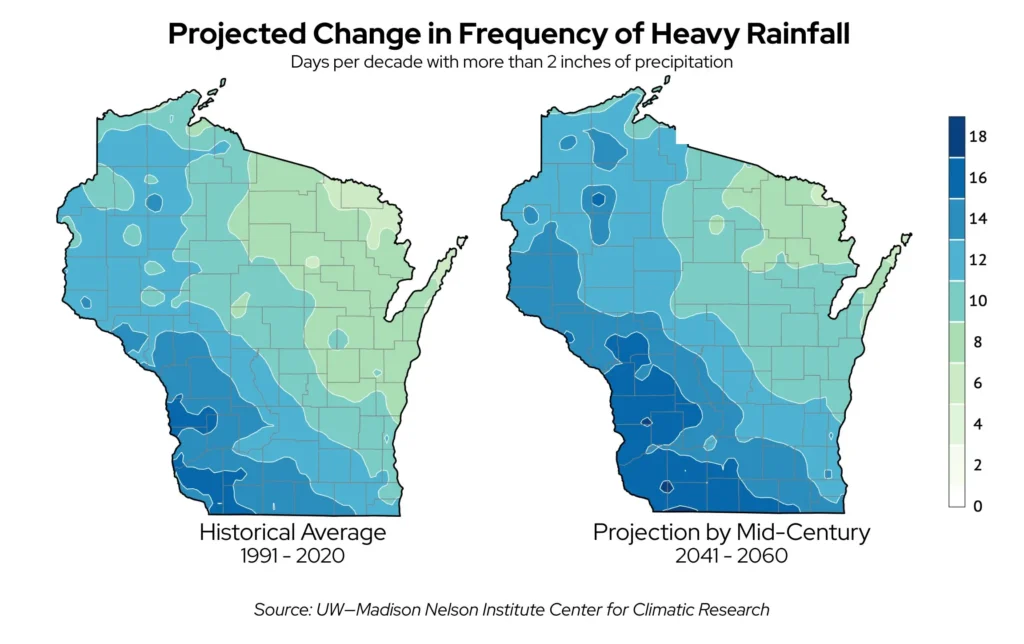
As Wisconsin’s climate becomes wetter, heavy to extreme rain events are likely to become more common. By mid-century, most of Wisconsin could see two to four additional days per decade with heavy precipitation.
As Wisconsin’s climate changes, Wisconsinites will need to change with it.
This is a product of the Wisconsin State Climatology Office. For questions and comments, please contact us by email (stclim@aos.wisc.edu) or phone (608-263-2374).