April in Wisconsin was warm and wet with a whiff of winter. On a statewide basis, the average monthly temperature was 2.2 degrees (Fahrenheit) warmer than normal and precipitation was 15 percent higher.
A Roller Coaster of Temperatures
April is notable for its indecisiveness when it comes to weather. Will we need our winter parkas or our bathing suits? We hope you had them both because we rode the temperature roller coaster last month (Figure 1). April began much cooler than normal, including the month’s statewide minimum temperature of 12 degrees on April 1 in Rice Lake. Temperatures then climbed much warmer than normal a couple weeks later with a monthly statewide maximum temperature of 85 degrees on April 15 at the UW–Madison Arboretum.

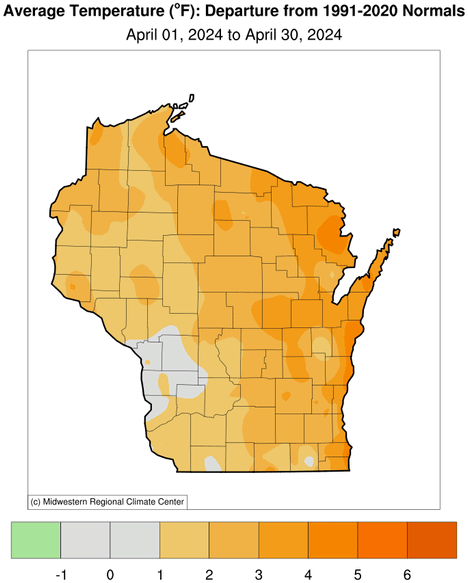
Then, temperatures quickly dropped over a matter of days, due to an intruding cold front, before fluctuating above and below normal the last third of the month. Overall, the month of April averaged 40 to 45 degrees in the north and 45 to 50 degrees in the south, and, despite the twists and turns, the trend of warmer than normal monthly temperatures prevailed. The warmth was most evident in the eastern half of Wisconsin, but virtually everywhere experienced above-average temperatures (Figure 2).

April Showers … and Snow!
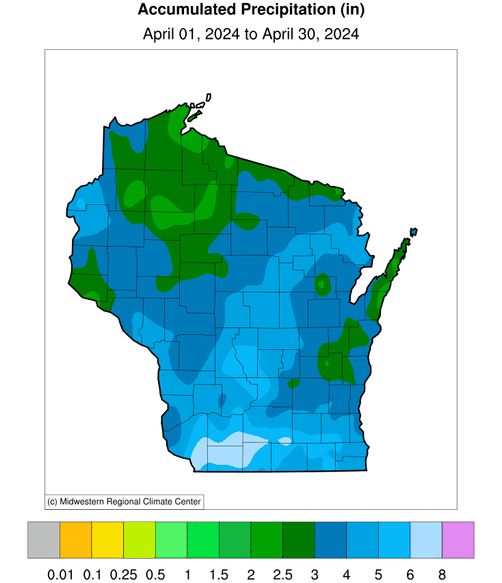
Continuing with the theme of an indecisive month, Wisconsin saw rain, snow, and thunderstorms galore. From north to south, Wisconsin saw roughly two to six inches of accumulated precipitation, which ranged from about 75 to 175 percent of normal (Figure 3). In general, the heaviest amounts occurred in the far south, along with a moderate area exceeding an inch above normal in a swath from central to northeastern Wisconsin.


The precipitation came in bursts during the beginning, middle, and end of the month (Figure 4). The start of April brought a significant rain-to-snow event in the east-central and southeast regions, where rainfall totaled one to 1.8 inches in just five hours on April 2. As temperatures dropped, the rain quickly transitioned to a substantial snowfall of over two inches across a majority of the state between April 2 and 3. This winter storm rapidly deteriorated rush hour travel conditions, created a two-foot–plus rise in water levels at the mouth of the Green Bay, and left over 100,000 Wisconsinites without power, among other impacts. Wisconsin’s highest single-day snowfall during April reached 15 inches in Shiocton because of the intense snowfall.

Remarkably, due to the 655-foot elevation difference between the low-lying La Crosse Regional Airport and the La Crosse National Weather Service office, along with the warmth of the Mississippi River, only 1.1 inches of snow fell at the airport while 17 inches fell at the weather service office, despite these two sites only being 4.9 miles apart. This two-day event boosted last month’s snowfall accumulations to a half a foot above normal in the southeastern region of the state, but, unfortunately, the snow-deficient northwest remained two to six inches below normal (Figure 5).


After an eventful first three days of the month, the weather quieted down, but not for too long. Another round of plentiful precipitation came April 16 and 17. Between 0.2 to 2.5 inches fell, with the highest totals in the western half of Wisconsin and lowest totals to the northeast. Twenty to 40 mile per hour wind gusts accompanied the rain and ended up destroying one of the oldest buildings in Beloit. Rounding out the end of the month was another serving of severe weather with a scattering of one inch plus hail and a 58-mile per hour wind gust reported to the southwest. Fortunately, no tornadoes coincided with the rain, hail, or wind in Wisconsin.
Drought Status
April’s precipitation is reflected in the U.S. Drought Monitor, which showed a substantial easing of drought across a majority of the state over the course of the month (Figure 6). Wisconsin started April with nearly a third of the state under moderate drought conditions, but ended the month at just under 20 percent. Unfortunately, areas to the far north and the southwest remain under severe drought in a continuation of the almost year-long drought and precipitation deficits (Figure 7).


Fortunately, soil moisture continued to be replenished with the multiple rounds of rain as well as the exceptionally heavy, wet snowfall on April 2 and 3. At the start of the month, the U.S. Department of Agriculture’s National Agricultural Statistics Service was reporting soil moisture shortages in 27 percent of Wisconsin’s topsoils and 39 percent of subsoils. By the end of the month, however, these shortfalls dropped to 15 and 18 percent, respectively (Figure 8).


Along with the rejuvenation of soil moisture, statewide topsoils pushed near and even above 50 degrees by month’s end, hitting the temperature threshold to begin planting various crops. While April’s showers created obstacles for Wisconsin farmers who were challenged to find dry enough periods for planting, farmers overcame the slightly wetter than normal conditions and stayed ahead of the five-year average for corn, soybean, and oat planting during April.
Astronomical Impacts
The solar eclipse on April 8 (Figure 9) made noticeable changes to Wisconsin’s environment, which can be seen at the Cold Spring Wisconet station (Figure 10). Between the start and peak of the eclipse, there was a significant decrease in solar radiation (906 to 78 watts per meter squared), a four degree temperature drop, and a 7.2 mile per hour wind speed reduction. The change in temperature and wind speed are an indication of less heat and less vertical mixing in the atmosphere due to the dimmed solar energy.


Outlook
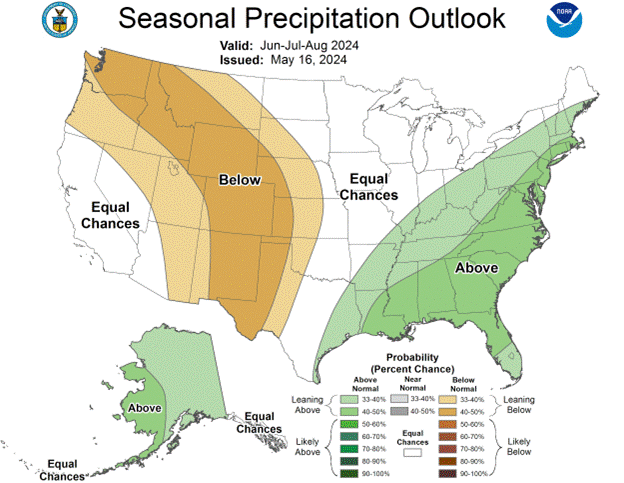
May has already started out warmer than normal, and the National Oceanic and Atmospheric Administration’s outlooks indicate that this warm trend has a 33 to 50 percent probability of continuing over the next three months throughout Wisconsin (Figure 11). Forecasted precipitation patterns during this time frame, however, show no clear signal whether Wisconsin will be wetter or drier than normal. Therefore, this outlook alone should not sound any alarms about a repeat of last year’s drought.

Climate Corner
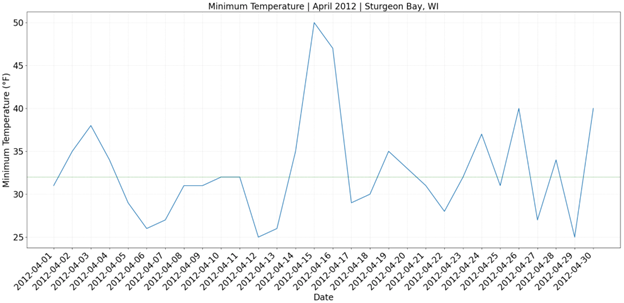
In 2012, Wisconsin faced a “false spring,” where a warm March (Figure 12) abruptly turned into a frosty April (Figure 13), devastating fruit trees, crops, and maple syrup production. The unusually warm March led to premature dormancy break in plants, only to be hit by freezing temperatures in April, resulting in significant yield loss. The cherry and apple crops were particularly affected, with losses of 75 and 45 percent, respectively, compared to 2011. Maple syrup production plummeted by 68 percent due to record high day and nighttime temperatures disrupting maple sap flow.

How likely would we experience a false spring this year? As we head into May, most of Wisconsin is approaching the median date for the last occurrence of freezing temperatures. The current near-term outlooks show a 33 to 50 percent probability of below normal temperatures while the seasonal outlook shows the potential for above normal temperatures. Furthermore, field reports indicate that crops are only slightly ahead of schedule, making them hardier than in 2012. Thus, while caution is warranted, conditions don’t appear conducive to a repeat of the destructive false spring experienced in 2012.
Steve Vavrus is the Wisconsin state climatologist. Bridgette Mason and Ed Hopkins are the assistant state climatologists.