After a record-breaking February and winter (December to February), Wisconsin’s weather returned to more recognizable conditions during March, although the month was significantly warmer and wetter than normal.
In Like a Lamb, out Like a Lion
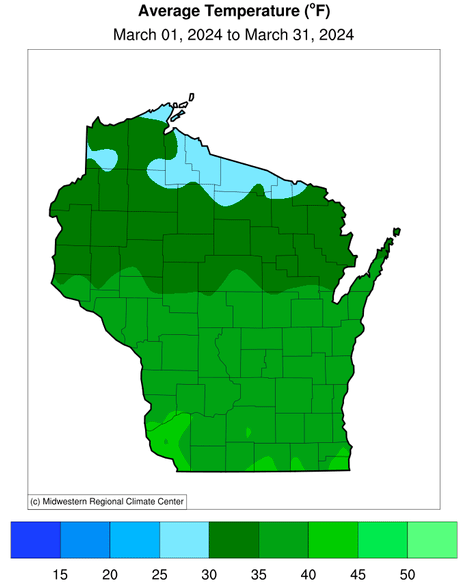
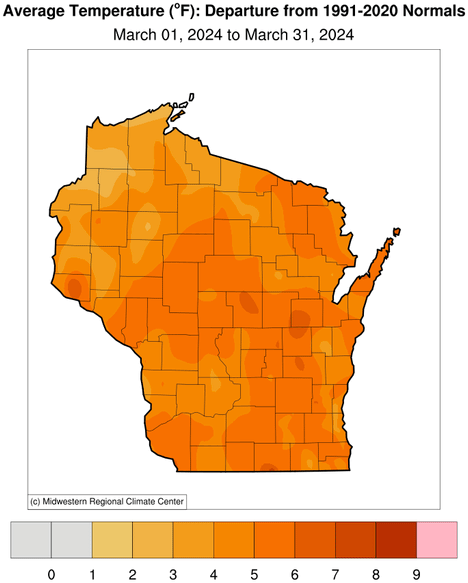
March finished as the 12th warmest March on record since 1895, averaging 35.2 degrees (Fahrenheit), which was 4.7 degrees above the 1991–2020 normal. Despite the abnormal warmth not being as extreme as the preceding months (February and December were both the warmest on record), the entire state averaged two to six degrees above normal during March, and the central and southern regions saw the largest departures from normal (Figure 1).
While March usually begins cool and ends warmer as we transition from winter to spring, the opposite occurred this year. The first two weeks of the month began with unseasonably warm conditions, as statewide average temperatures soared 10 to 15 degrees above normal. A few locations warmed above 70 degrees at times, including La Crosse at 74 degrees on March 3 compared to its normal 39 degrees (Figure 2).
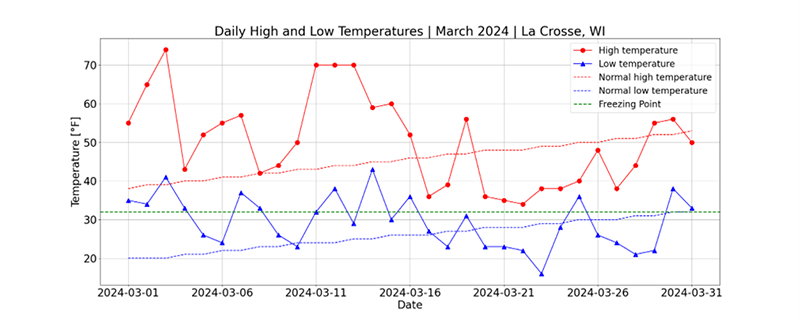
However, a shift occurred between March 14 and 15 as cool northerly winds swept through and caused a significant temperature change, including a drop of 14 and 12 degrees in Janesville and Monroe, respectively, within a span of 24 hours. Subsequently, the remainder of the month was one to five degrees below normal for the northern and eastern portions of the state and near normal to the south and east.
Precipitation Rebound
Following a very dry February, precipitation across Wisconsin rebounded strongly during March. The amount of precipitation averaged statewide was substantially above normal (by 0.66 inches or 36 percent), and the month ranked 21 st among all Marches in Wisconsin since 1895. The most excessive wetness occurred in the southeast, where much-needed precipitation exceeding normal was over three inches in places and more than double the average March precipitation (Figure 3).
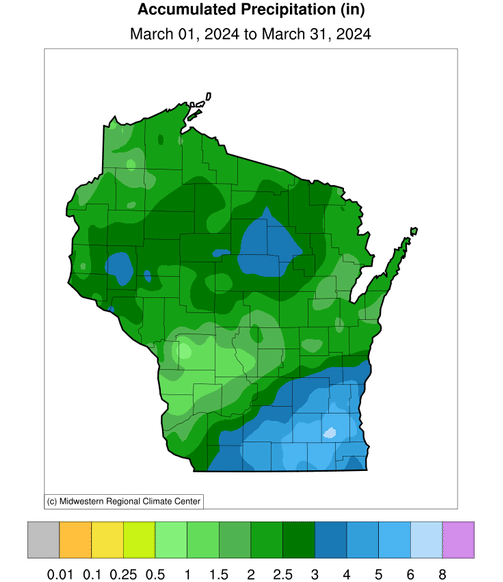
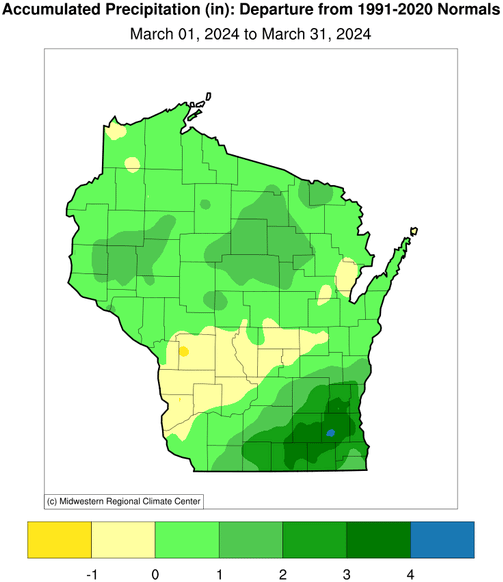
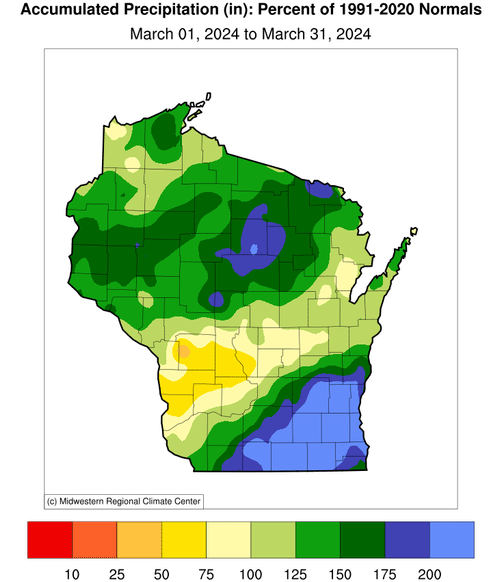
Unfortunately, the region of the state that missed out the most was the southwest, which has been the most drought-stricken area since last year. Much of the southwest received less than 75 percent of normal precipitation in March.
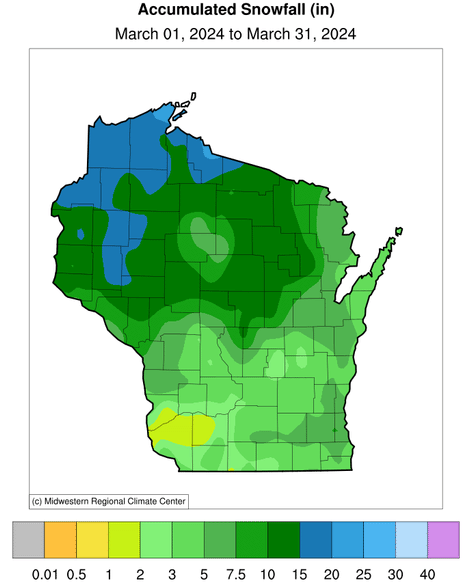
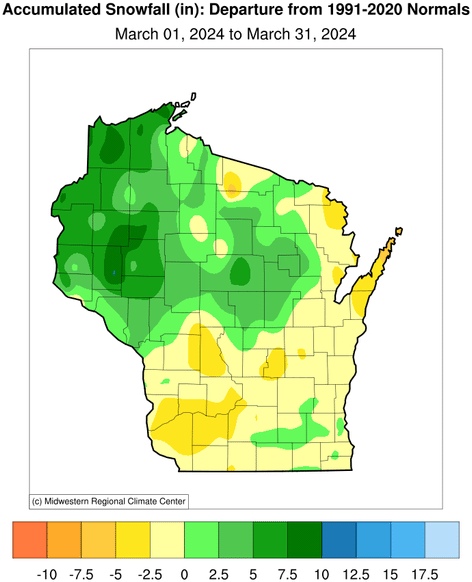
In terms of snowfall, there was a tug-of-war between the generally abundant precipitation and the unusual warmth during March. Between 10 and 20 inches of snow fell in most of northern Wisconsin, with the highest amounts in the northwest (Figure 4). Although this late-season snowfall was a welcome change from the months-long regional snow drought, it was too little, too late for most winter recreation and tourism offerings. The very wet March in southeast Wisconsin featured near-normal snowfall, but virtually all of it came in a single storm on March 21 and 22 and quickly melted a few days later.
Drought Relief and Soil Concerns
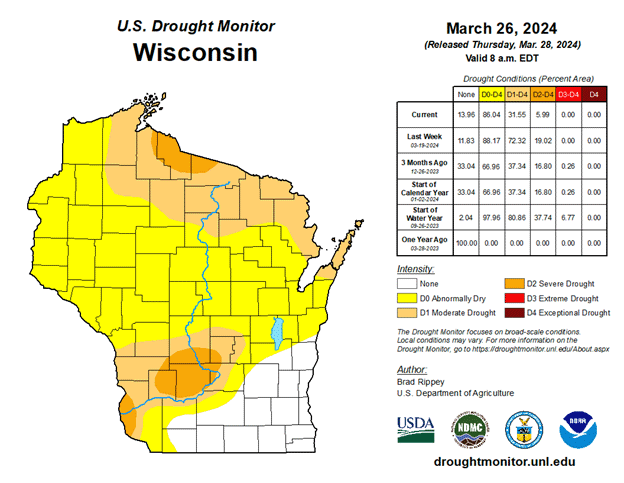
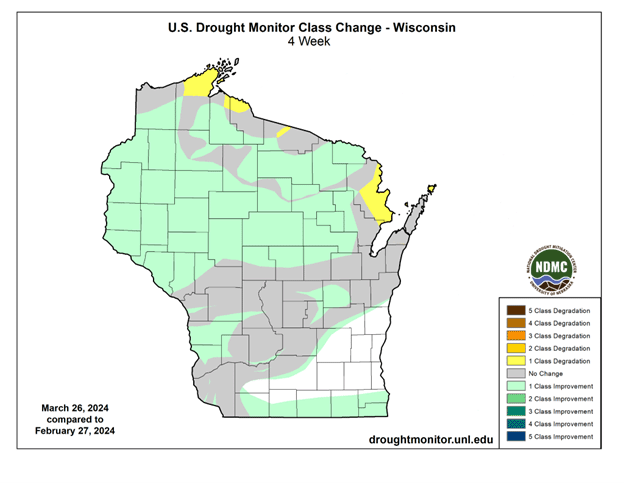
The mid-month flip from warm and dry to cool and wet had significant impacts on the state. Wisconsin saw widespread drought improvements for areas that received the late-month precipitation, namely the northern half of the state (Figure 5). Nonetheless, the Drought Monitor still reflects the snow drought experienced this past winter with moderate to severe drought intensity continuing in the north. In addition, the Driftless Area of southwest Wisconsin remains one of the driest regions of the state due to the combination of the long-term drought and very little recent precipitation to provide some relief.
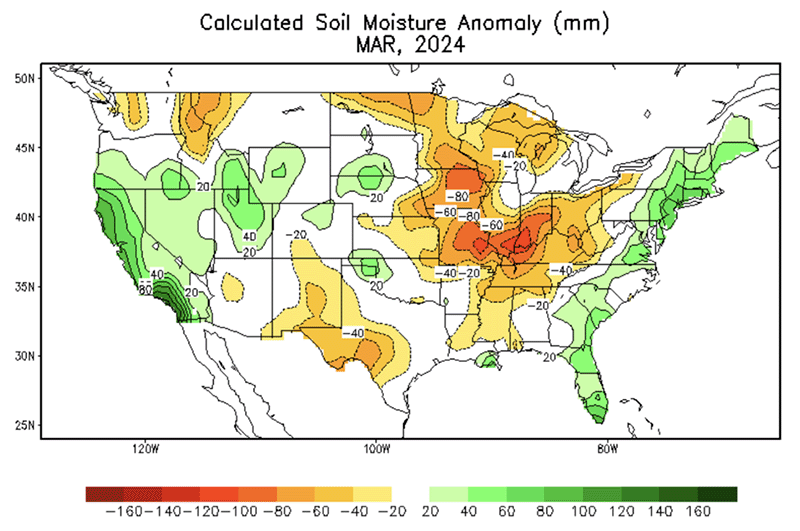
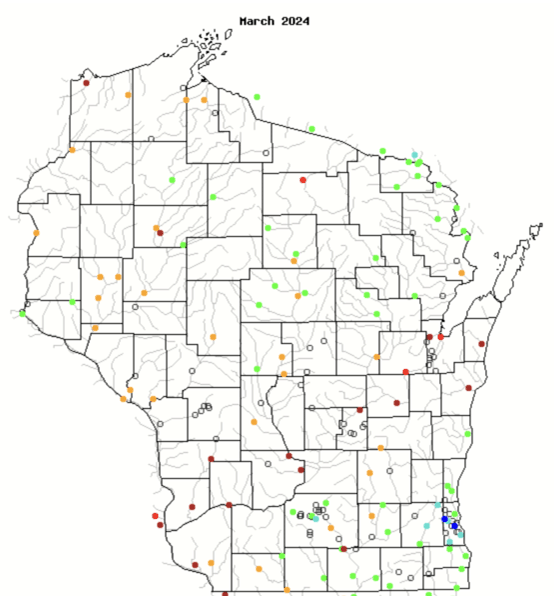
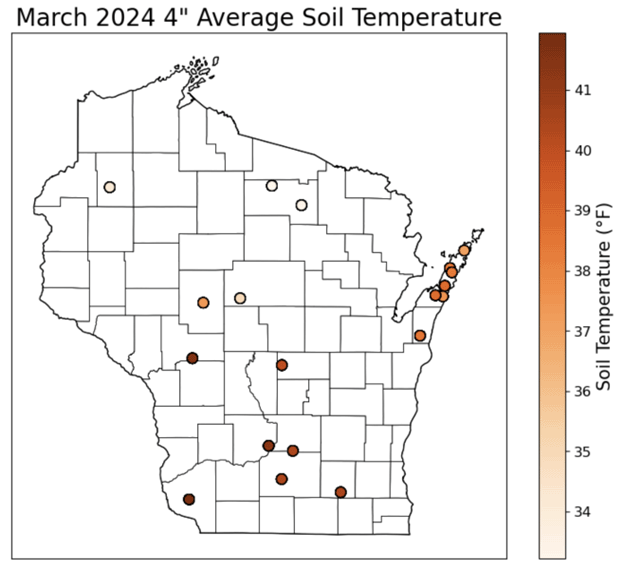
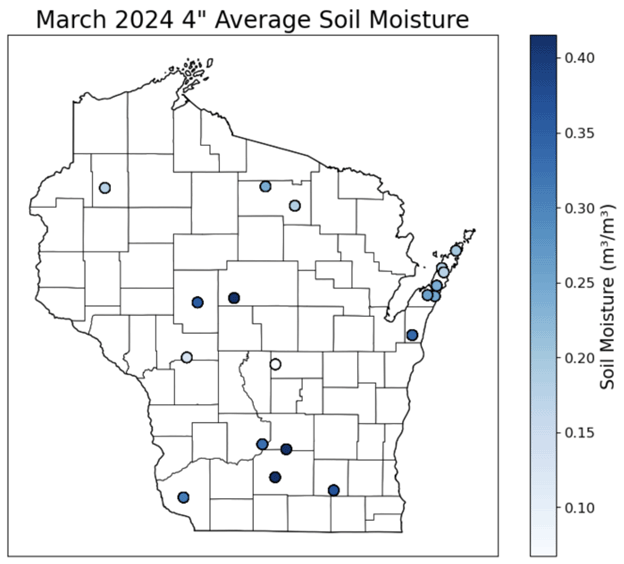
Despite widespread precipitation, soil moisture levels remained drier than normal for the month (Figure 6). The lower soil moisture levels, particularly in deep soils, creates concern that the lingering long-term subsoil moisture deficits may not be replenished if April showers are insufficient. Streamflow, river, and lake levels, largely influenced by last year’s drought, remained near or below normal, minimizing the risk of spring flooding (Figure 7).
However, if the end-of-March precipitation pattern continues, flood risk could increase and pose challenges for agricultural activities. Soil temperatures stayed mostly above freezing throughout the month, aided by the early March warmth (Figure 8). Fortunately, above-freezing soil temperatures allowed for precipitation and snowmelt to infiltrate the soils, particularly the topsoils (Figure 9).
Crop Vulnerability
Despite the early development of plants and crops this year, the hardier ones likely handled the cool end-of-March temperatures. Unfortunately, though, some overwintered, perennial, and spring-planted crops are still at risk for freeze damage, as Wisconsin’s average last hard freeze (28 degrees or colder) occurs in mid-April in southern Wisconsin and early May in northern Wisconsin. The Midwestern Regional Climate Center Freeze Date Tool provides freeze dates by county.
Outlook
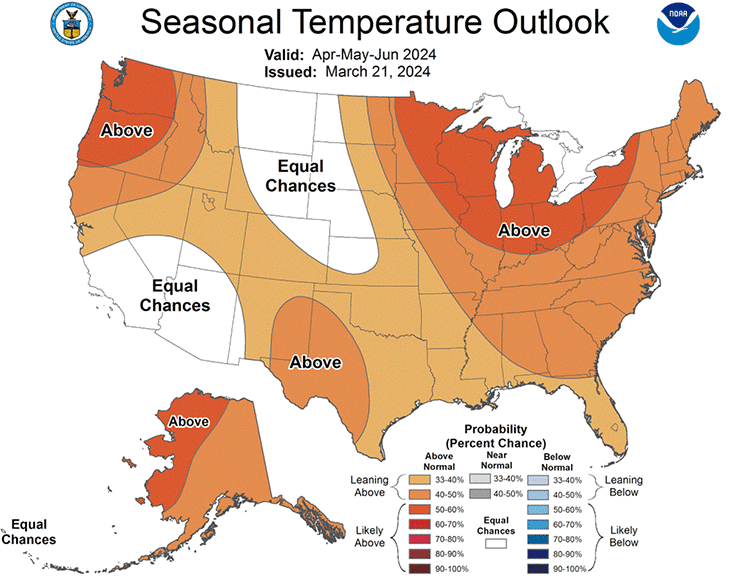
Although April has started on a wintry note, NOAA’s seasonal outlooks indicate that the upcoming April to June is likely to be warmer than normal throughout Wisconsin (50 to 60 percent probability) (Figure 10). If this forecast proves accurate, it would mean a continuation of the remarkably long stretch of warmth experienced recently. Since January 2023, Wisconsin’s average temperature has exceeded normal in all months except July, which was only slightly (0.7 degrees) cooler than average.
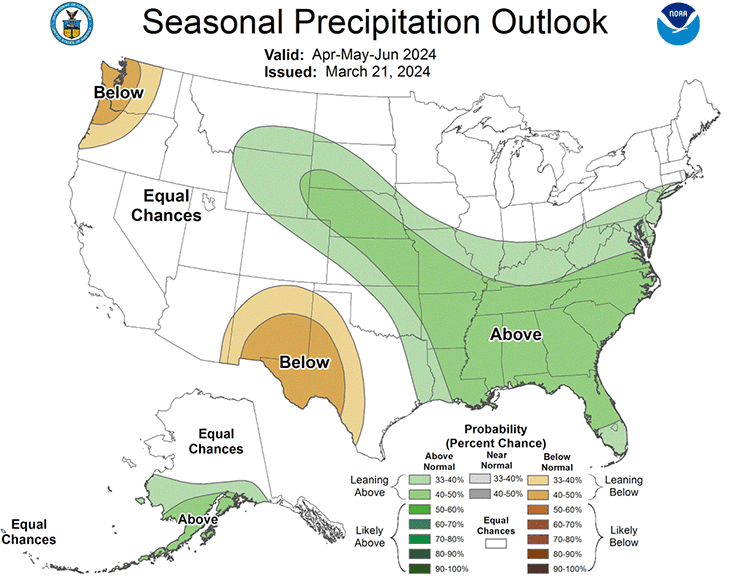
On the other hand, the outlook for precipitation gives no indication of either unusually wet or dry conditions in the coming months in Wisconsin and most of the Upper Midwest. Therefore, we have no evidence to anticipate that our lingering drought will either end or worsen in the foreseeable future.
Climate Corner
Madison’s late-March snowfall this year caused many state residents to recall the commonly held belief that a major snowstorm “always” strikes south-central Wisconsin during the Wisconsin Interscholastic Athletic Association (WIAA) state boys basketball tournament held during mid-March in Madison for more than 105 years.
But the State Climatology Office’s analysis of weather records for Madison since 1950 reveals that slightly less than one-third of the game days had measurable snow (0.1 inches or greater). Only four major snowstorms of four or more inches actually fell in Madison during the three days of past tournaments: in 1970 (4.3 inches), 1971 (14.5 inches), 1992 (5.3 inches) and 2005 (9.3 inches).
Apparently, memories tend to focus upon those years with extraordinary events, such as times when fans were stranded in Madison or elsewhere because of inclement weather conditions, especially due to heavy snow. With warming winters, the number of March snow days in Madison has dropped in half from nearly eight days per decade in 1951–60 to four days per decade in 2011–20. If this trend continues, the “state tournament myth” may be dispelled once and for all.
Steve Vavrus is the Wisconsin state climatologist. Bridgette Mason and Ed Hopkins are the assistant state climatologists.