Our meteorological summer ended as one of the driest on record. The continued drought conditions were accompanied by a short but intense heat wave in August that included temperatures above 100 degrees. The result was a drier-than-normal summer for nearly all of Wisconsin.
Major Drought Continued Across Wisconsin
The persistent drought of 2023 didn’t let up in Wisconsin during August, and even strengthened somewhat due to the late month heat wave. The statewide average precipitation of 2.38 inches during August was fairly meager: 1.52 inches below the 1991-2020 normal and the 19th driest in the 129 years of record-keeping.
But amid the overall dryness statewide, there was great spatial variation. Most of far eastern Wisconsin was actually wetter than normal, whereas the southwest was extremely dry — a swath of that region received only 5 to 10 percent of average August rainfall.


(Click thumbnails to view a larger image)
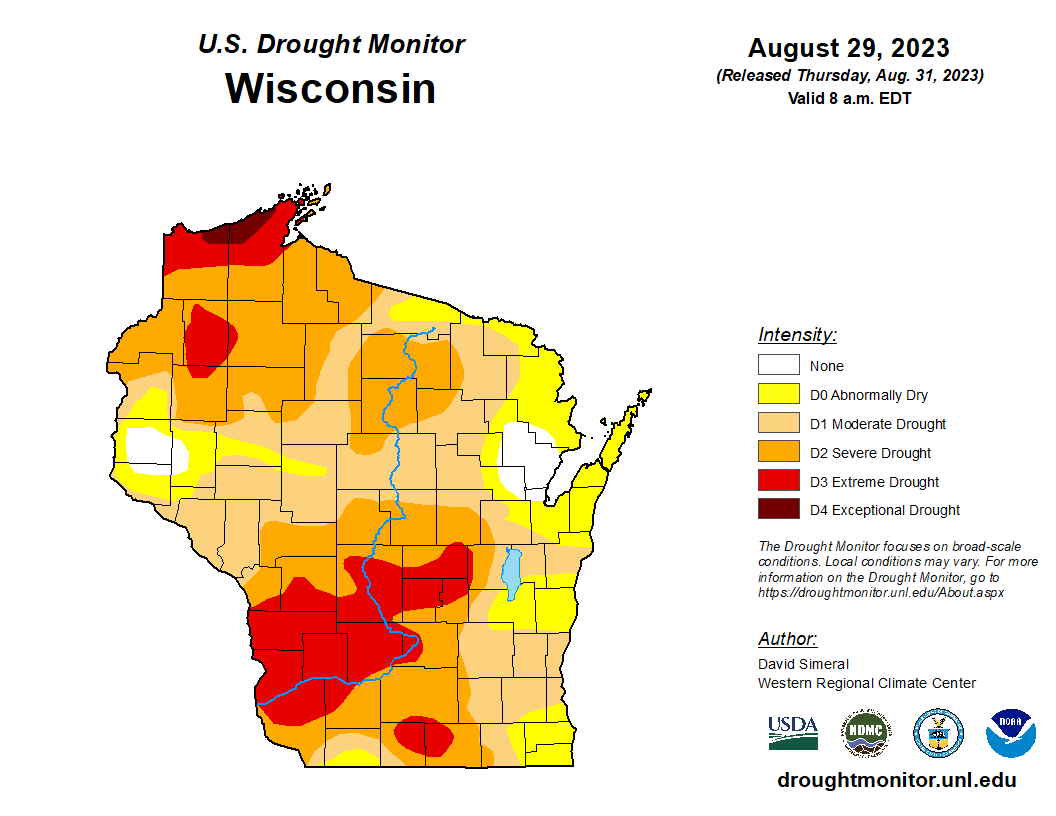
The dry month exacerbated drought conditions across most of Wisconsin. The final August map published by the U.S. Drought Monitor showed “extreme drought” (D3 category) over much of the western two-thirds of the state. The most widespread afflicted area was in southwest Wisconsin, but a few other regions reached this same drought magnitude.
Very notably, the northern part of Douglas and Bayfield Counties near Lake Superior dried out so much that they even topped the scale at “exceptional drought” (D4 category) during early August. This was the first time that any part of Wisconsin reached that level since the Drought Monitor began in 2000.
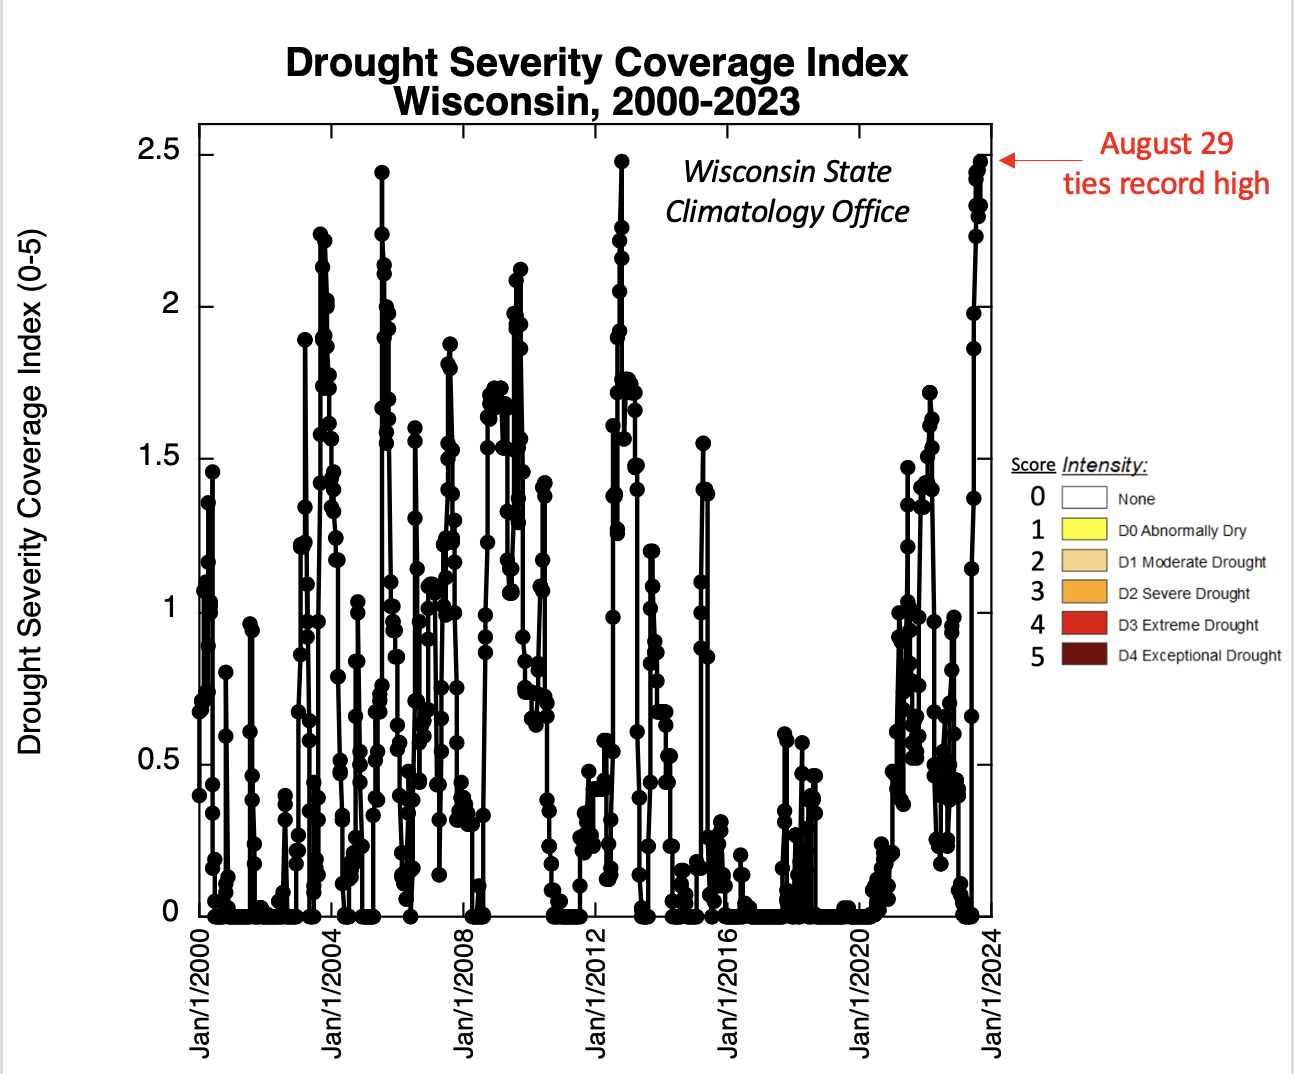
A useful measure of the combined severity and areal extent of a drought is the Drought Severity Coverage Index (DSCI) reported each week by the U.S. Drought Monitor. The DSCI is the weighted spatial average of all five drought categories across the state, after assigning a score to each. The weakest category (D0, “abnormally dry”) receives a score of one, D1 (moderate drought) a two, D2 (severe drought) a three, D3 (extreme drought) a four, and D4 (exceptional drought) a five.
Therefore, Wisconsin’s DSCI can range from as low as 0 in the absence of any drought to as high as 5 if the entire state is in exceptional drought. As illustrated below, the DSCI for the final Drought Monitor map of August tied its record high (2.48) since the maps began in 2000. Only for one week during the infamous 2012 drought did statewide average drought conditions reach this magnitude. The DSCI graph also illustrates that this year’s drought has not only been strong but also very persistent: through the end of August the DSCI has continuously exceeded 2 since the first week of July.
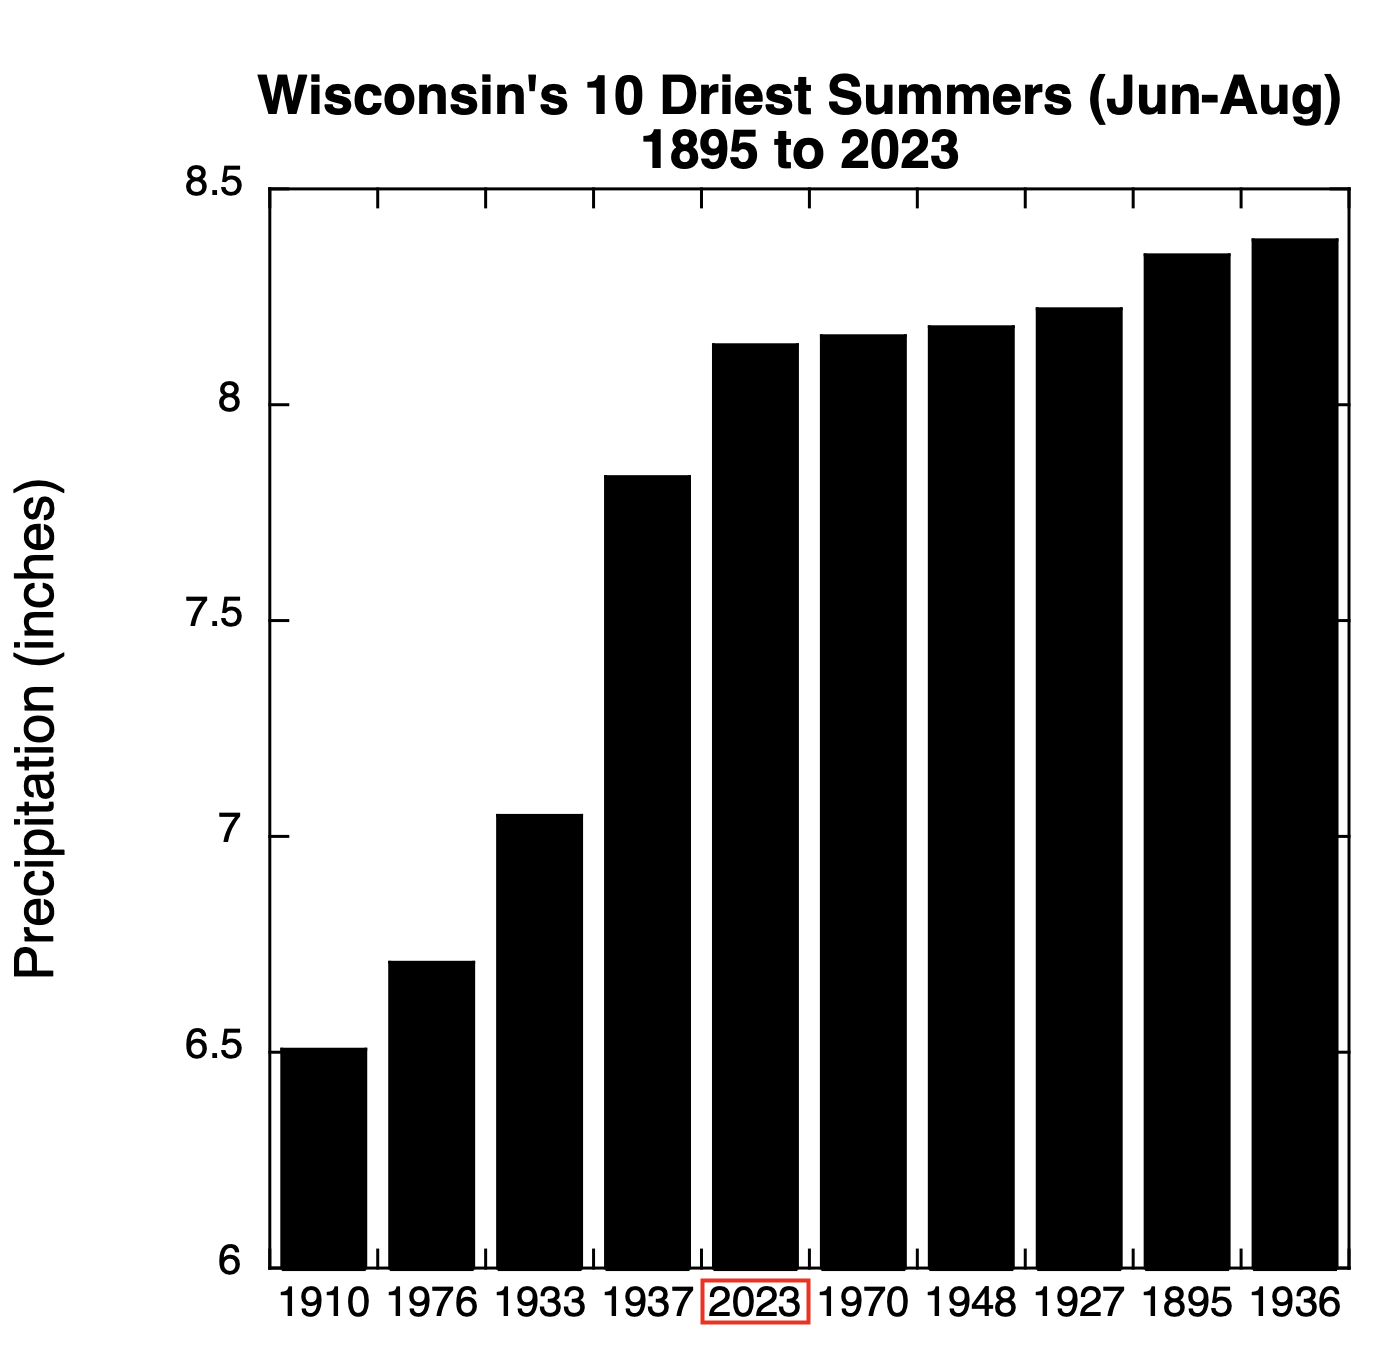
The relentless drought was fueled by an exceptionally dry meteorological summer (June-August) in Wisconsin. Averaged across the state, only 8.14 inches of rain fell during those months, which makes this the 5th driest summer on record (to 1895). Even the severe droughts of 1988 and 2012 had more summer rainfall. In fact, the last time Wisconsin endured such a dry summer was in 1976, nearly 50 years ago, and before that were two summers during the 1930s Dust Bowl (1933 and 1937).
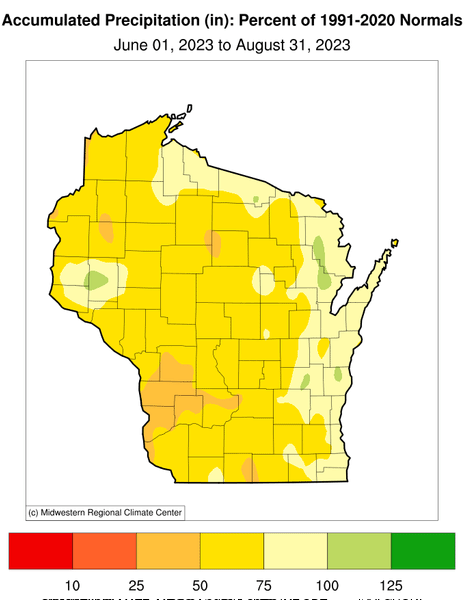
Not surprisingly, the extreme dryness averaged statewide meant that almost all of Wisconsin experienced below-normal summer rainfall. Most places received only 50-75 percent of average, while part of the southwest was even drier at 25-50 percent — overlapping with the “extreme drought” category by the end of August (see above). A few lucky locations scattered around Wisconsin eked out a slightly wetter-than-normal summer, but they were few and far between.
The Heat Was On
A brief but severe heat wave struck Wisconsin in late August, peaking from the 22nd to 24th. An extremely hot air mass containing exceptionally high humidity pushed the heat index — the “feels like” temperature when humidity is factored in — to above 110 degrees in much of the state and even produced a few instances of 120 degrees and above.
New Richmond in St. Croix County recorded the highest heat index of 126 degrees on August 23. Numerous locations reached or exceeded a 100-degree air temperature, as shown in the table below.
The excessive humidity added to the discomfort by limiting overnight cooling and causing daily minimum temperatures no cooler than the middle 70s. Consequently, many locations in Wisconsin and the Upper Midwest set calendar-day records for the hottest high temperature and warmest low temperature during the heat wave (see map below).
| Station | Temperature (F) |
|---|---|
| Boscobel Airport | 105 |
| La Crosse Regional Airport | 104 |
| Prairie du Chien Municipal Airport | 104 |
| Prairie du Chien | 103 |
| Sparta | 103 |
| Gays Mills | 103 |
| Sparta Fort Mccoy | 103 |
| Genoa Dam 8 | 102 |
| Wautoma Municipal Airport | 102 |
| Kenosha WWTP | 101 |
| Steuben 4 SE | 101 |
| Baraboo WWTP | 101 |
| Friendship | 101 |
| Portage WWTP | 101 |
| Trempealeau Dam 6 | 101 |
| Mondovi | 101 |
| Cashton 3NNW | 101 |
| Black River Falls | 101 |
| Milwaukee Mitchell Airport | 101 |
| Lake Mills WWTP | 100 |
| Viroqua | 100 |
| Reedsburg WWTP | 100 |
| Wisconsin Dells WWTP | 100 |
| Montello WWTP | 100 |
| Mauston 1 SE | 100 |
| Alma Dam 4 | 100 |
| Hancock Exp Farm | 100 |
| Fond du Lac 1 SW | 100 |
| Lone Rock Tri County Airport | 100 |
| Kenosha Regional Airport | 100 |
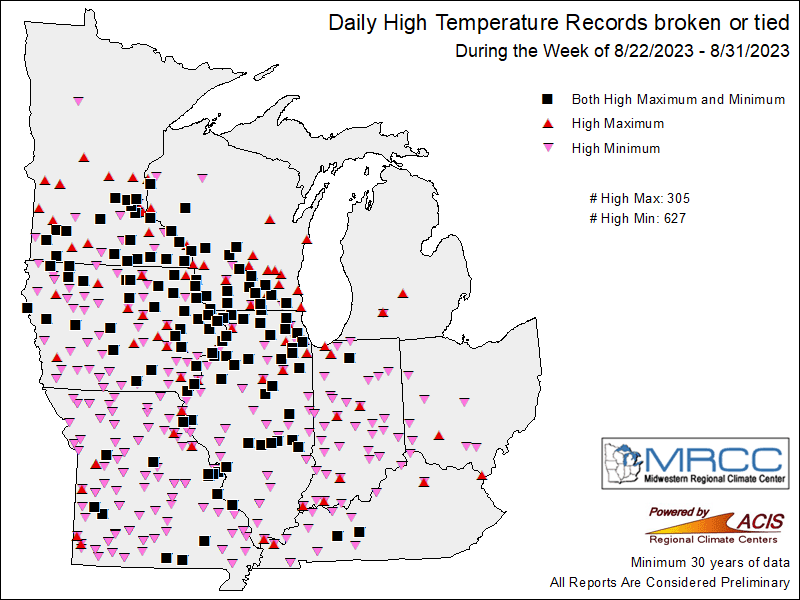
A noteworthy aspect of this extreme heat event is that it was the first time in more than a decade that anywhere in Wisconsin climbed above 100 degrees. Based on weather records dating back to the 1880s, such extreme heat is not unusual around here. In fact, the temperature has broken the century mark in most years, yet curiously, Wisconsin went through a gap between 2013 to 2022 without this happening.
That is the longest such “cool” streak in the records, yet this year’s August heat wave ended that string emphatically, with the highest reported temperature of 105 degrees in Boscobel on August 23.
A Warm August Overall
The late-month heat wave helped to boost the average August temperature above normal, but, overall, the heat was only moderate. Wisconsin’s average temperature last month of 67.7 degrees was 0.9 degrees warmer than the 1991-2020 mean, which places the month as the 43rd warmest out of 129 Augusts since statewide records began in 1895. Another way of looking at it is that last month was warmer than about two-thirds of all Augusts on record in Wisconsin.
However, the overall average is somewhat misleading, because it includes both the daily maximum and daily minimum temperatures. The mostly dry air associated with the drought allowed both effective daytime heating and enhanced nighttime cooling, as shown in the maps below. Although the average daily minimum temperatures across Wisconsin during August were very close to normal, much of the state had average daily maximum temperatures more than one degree warmer than average, with pockets exceeding 3 degrees.


(Click thumbnails to view larger images)
A Warm Summer in Wisconsin
The temperature anomalies during August followed those of the summer as a whole (June-August). Wisconsin experienced a warm but not hot summer overall: 40th warmest out of 129 summers on record and only slightly warmer (0.4 degrees) than the 1991-2020 average.
As in August, the dry air masses that prevailed during the course of the entire summer promoted daytime heat but allowed comfortable overnight cooling. For example, the daily maximum temperature statewide during summer averaged an impressive 1.5 degrees above normal, whereas the daily minimum temperature was actually 0.6 degrees cooler than normal (making for great sleeping weather!).
That is a remarkable difference between conditions during the day and night, and this divergence is illustrated below in the maps of summer temperature anomalies. In terms of the seasonal average temperature, most of the state fell within 1 degree of normal, but the opposing behavior of the daily highs and lows is very apparent. Most of Wisconsin averaged daily highs above 1 degree, and some locations even exceeded 3 degree, whereas daily lows were at least 1 degree cooler than normal across much of the state.
The thermal effect of the drought can be inferred by an interesting pattern of daily high and low anomalies: the most pronounced departures of excessive daytime heat and nighttime cooling occurred in the same region of west-central and southwest Wisconsin, which was the driest part of the state this summer.


(Click thumbnails to view larger images)