The recently concluded 2010s decade set a record for the most precipitation in Wisconsin since statewide data began in 1895, and 2019 was the wettest year of all. Every region of the state has become wetter, and south-central Wisconsin has experienced the largest change of any sector.
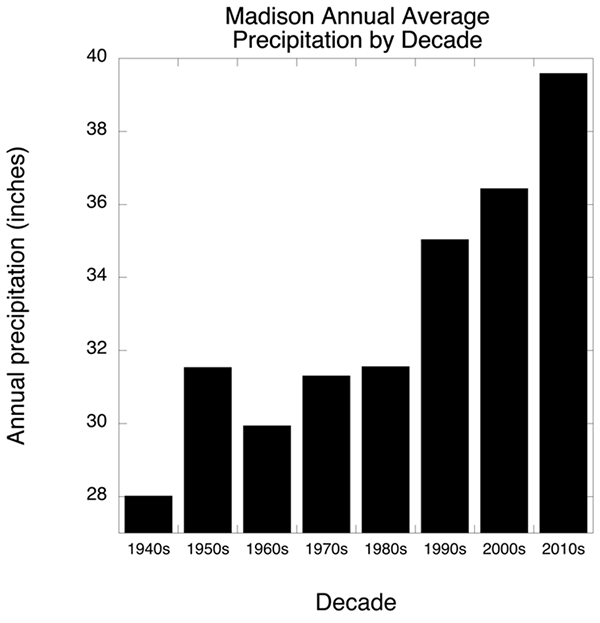
Within this zone, Madison has maintained an official weather station at the Dane County Regional Airport since 1940, during which time the total precipitation amount has gone up almost monotonically. The wet 2010s decade is especially striking, as Madison received nearly a foot more annual precipitation than during the 1940s (about a 40% gain).
We can see how Madison’s precipitation characteristics have changed over time by breaking down the daily amounts into four categories, ranging from lightest to heaviest (less than 1 inch, 1-2 inches, 2-3 inches, and more than 3 inches). The frequency of daily precipitation has been increasing for all intensities, but the largest rise recently has occurred in the middle categories: 1-2 inch events during the 2010s happened about twice as often as in the 1940s (81 times vs. 39), while 2-3 inch events were three times more common (9 vs. 3).
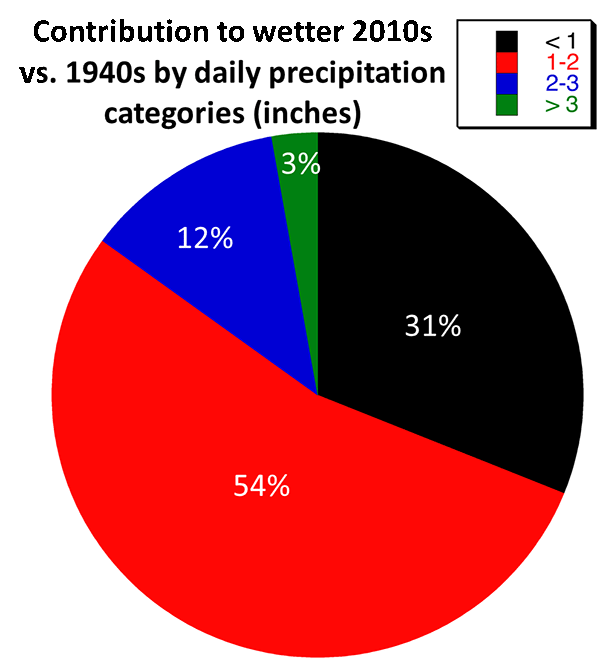
We can also learn how much each category contributed to total precipitation by multiplying within each class the number of events times their average daily precipitation amount. Comparing the driest decade (1940s) to the wettest decade (2010s), we find that the large increase in annual precipitation is mostly (54%) accounted for by contributions from 1-2 inch daily precipitation occurrences, whereas extremely heavy precipitation events of more than 2 inches account for only 15%.
Furthermore, the change in average annual precipitation from decade to decade most commonly resembles the change in the contribution from 1-2 inch events than the change from any other category. Therefore, Madison’s very wet weather in recent years has been caused mainly by moderately heavy events, rather than extreme deluges.
It appears that “moderate extremes” — not the most extreme storms — represent a sweet spot in regulating accumulated precipitation, at least around Madison. That is, they are both heavy and frequent enough that their variations over time strongly affect how much total precipitation falls. By contrast, lighter daily amounts (less than 1 inch) are very common but accumulate too little to have as much effect, whereas very heavy events (more than 3 inches) are so rare that they also don’t influence the total as much, despite their dramatic short-term impacts.
If these past precipitation trends continue, then adaptation strategies should be tailored toward not only wetter conditions but also with an eye on the nuances of how precipitation extremes evolve in a changing climate.