The first few days of June have featured intense smokiness from Canadian wildfires, seasonal temperatures, and periods of rain showers. Let’s dive into what the rest of the month could look like:
Temperatures
The Outlook: Trending Mild
Based on forecasts from NOAA’s Climate Prediction Center, Wisconsin has an elevated chance of experiencing warmer-than-average temperatures in June (Figure 1).
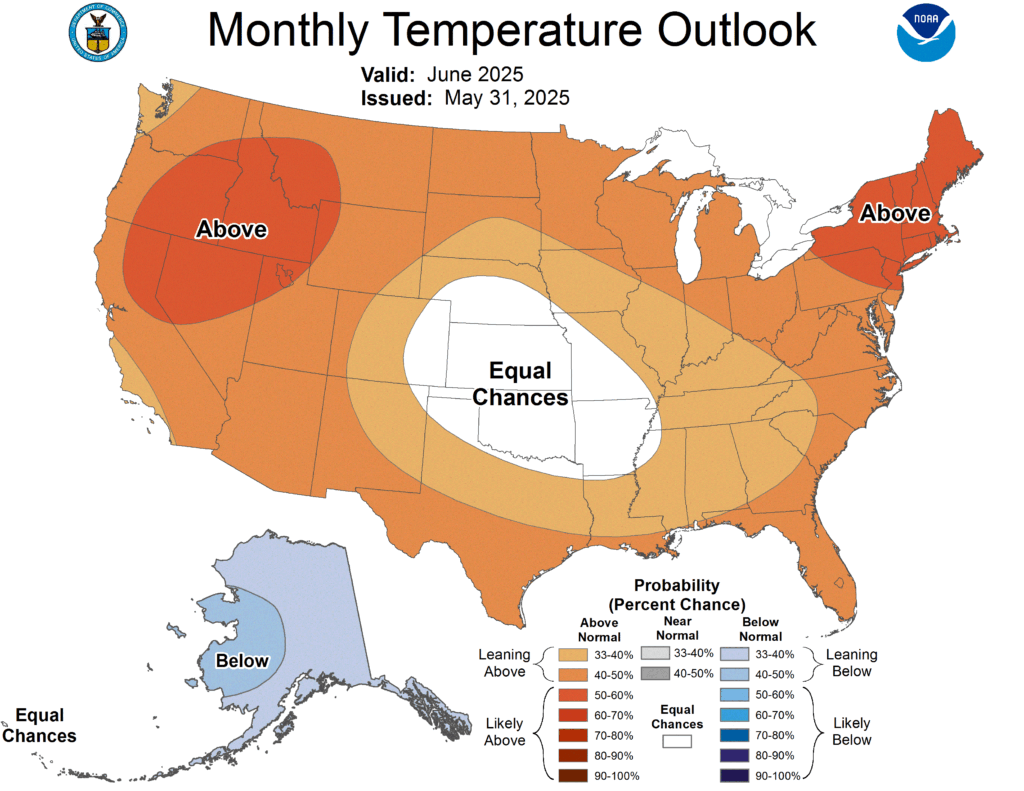
Note that the colors of the above map indicate the probability of above or below average temperatures, not the intensity of the expected warmth or cold. For June, Wisconsin is highlighted as having about a 40 to 50 percent chance of warmer-than-typical temperatures. Check out this blog for more information on deciphering climate probabilities.
The Averages:
Wisconsin’s average temperature in June is 65.1°F with an average high of 76.4°F. The hottest June was during the Dust Bowl in 1933, when the average high across the state was 85.2°F! The chilliest June came 36 years later in 1969, with an average high temperature of only 67.7°F (Figure 2).
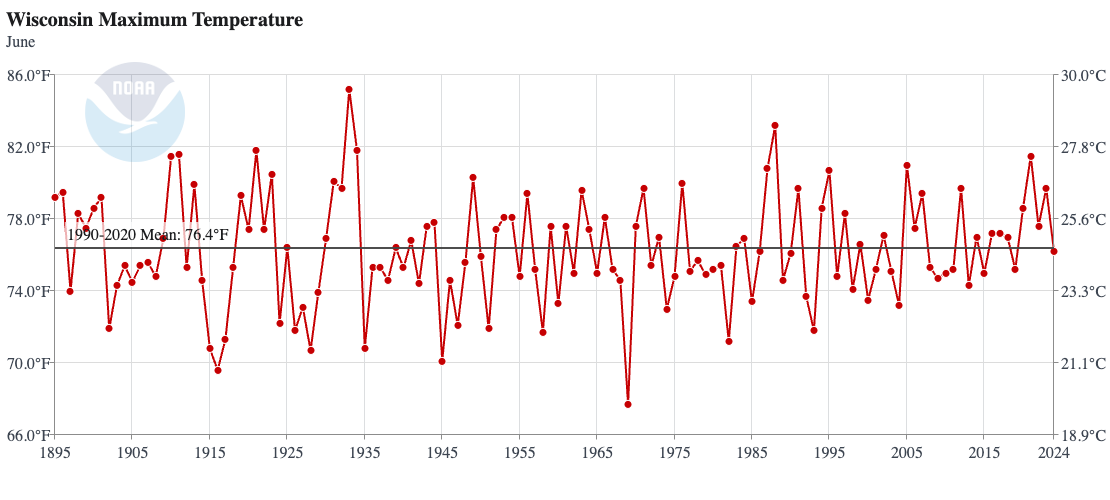
In 2024, the state’s mean high temperature in June fell just below the 30-year average. Many locations typically experience their first 90° days of the season during the month of June, and though uncommon, some can reach the triple digits (Table 1).
| Location | Hottest June Temperature | Year |
|---|---|---|
| Madison | 101° | 1988 |
| Milwaukee | 101° | 1988 |
| Green Bay | 101° | 1934 |
| Wausau | 97° | 1987 |
| Eau Claire | 100° | 2011 |
| La Crosse | 102° | 1988 |
Precipitation
The Outlook: To Be Determined
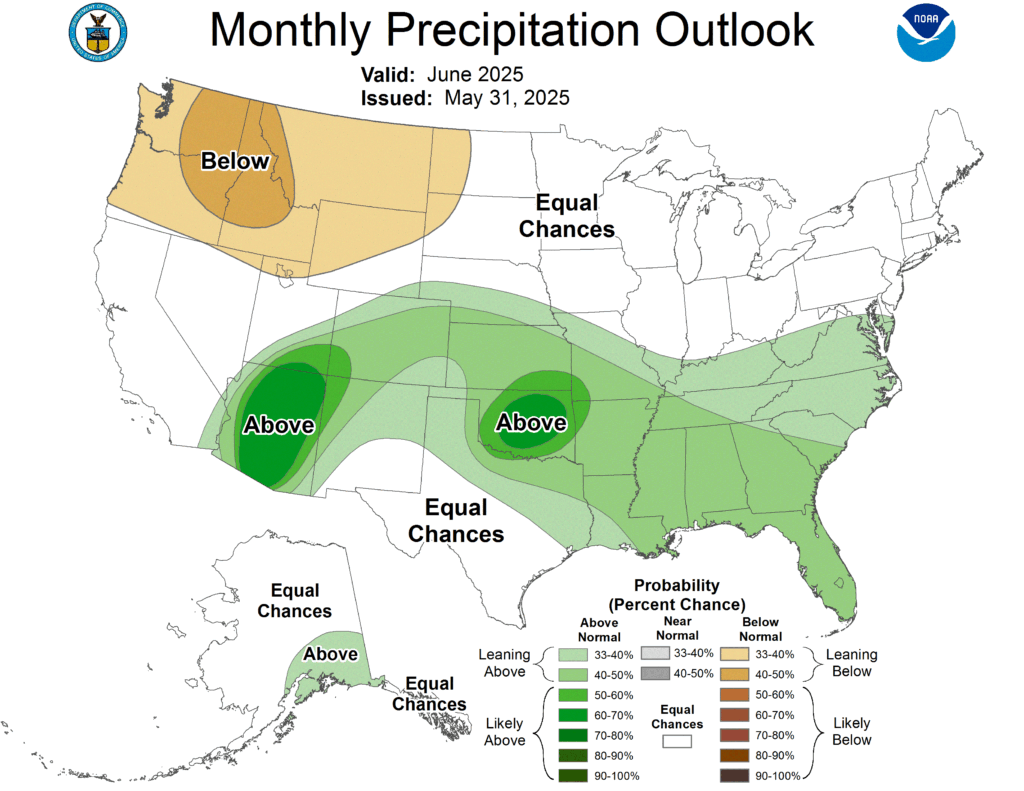
There is no strong signal towards an especially wet or especially dry month; the Climate Prediction Center is forecasting equal chances of above, below, or near average precipitation in the state in June (Figure 3).
While this forecast includes some uncertainty, you may be relieved to find the outlook not swaying toward either extreme. If you recall the extremely dry June of 2023 that plunged much of the state into severe drought, followed by the soggy June of 2024, which was in the top 10 wettest Junes on record in many locations! Last June, the statewide average rainfall exceeded seven inches, while the average of the previous June was under two inches.
The Averages:
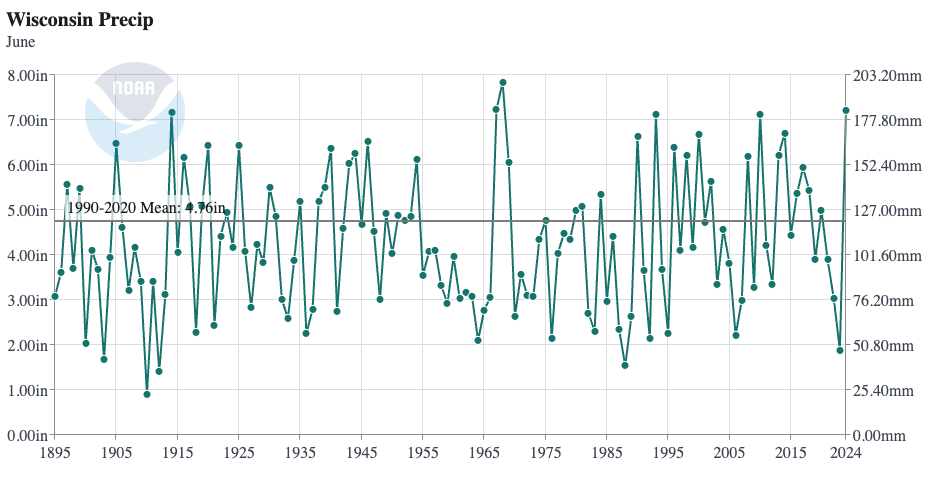
Wisconsin receives an average of 4.76 inches of rainfall during the month of June, typically making it the state’s wettest month of the year! Rain is especially crucial during this time of year in the state, as crops need the extra moisture to sprout and mature as warmer temperatures increase evapotranspiration rates.
The driest June on record in Wisconsin occurred in 1910 when the statewide average was 0.90 inches — about 19% of normal (Figure 4). Rhinelander only received a half-inch of rain that month! By comparison, the wettest June on record was in 1968 with a statewide average of 7.84 inches (Table 2).
| Location | Wettest June | Year |
|---|---|---|
| Madison | 10.93″ | 2008 |
| Milwaukee | 12.27″ | 2008 |
| Green Bay | 10.29″ | 1990 |
| Wausau | 9.61″ | 1930 |
| Eau Claire | 10.42″ | 1990 |
| La Crosse | 11.56″ | 1899 |
This is a product of the Wisconsin State Climatology Office. For questions and comments, please contact us by email (stclim@aos.wisc.edu) or phone (608-263-2374).