Although the data from meteorological spring 2023 show near-normal temperatures and precipitation, that doesn’t tell the full story. The season featured wild variability, punctuated by a May that saw above-average temperatures and exceptionally dry conditions.
Weather Whiplash Strikes Wisconsin
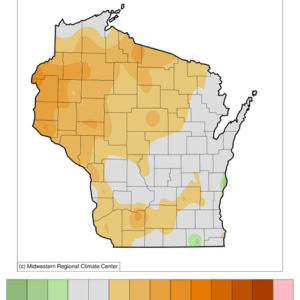
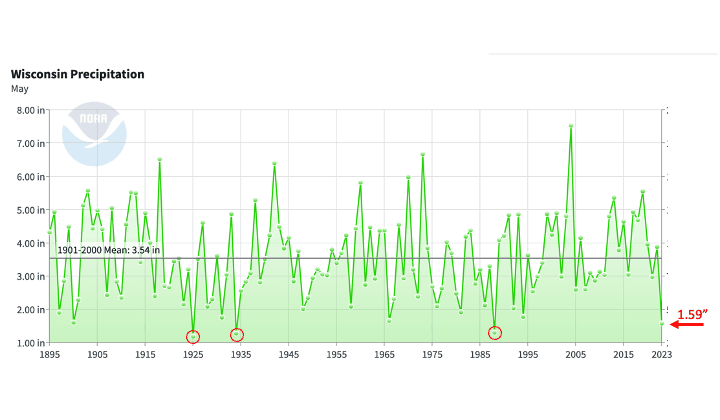
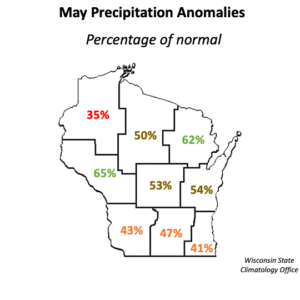
May was historically dry in Wisconsin, becoming the 4th driest on record (since 1895) with only 1.59 inches of precipitation averaged statewide. The last May that was this dry occurred back in 1988 and before that in May 1934 during our Dust Bowl era! Notably, the entire state experienced exceptionally dry conditions. The far northwest was the most extreme at only 35% of normal May precipitation, while the far south had the most widespread band of dryness, with all three climate divisions across southern Wisconsin receiving less than half of normal precipitation. After six consecutive months of abnormally wet conditions in Wisconsin, the flip to a historically dry May represents “weather whiplash,” at least for precipitation.
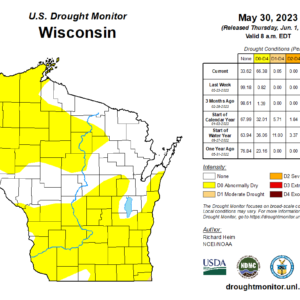
The recent shift caused the emergence of officially “abnormally dry” conditions by the end of the month across 2/3 of Wisconsin, according to the U.S. Drought Monitor, which uses a scale of five categories to classify drought. The designation of “Abnormally Dry (D0)” is the precursor of full-blown drought conditions. Only 1% of Wisconsin was in this category when the weekly Drought Monitor map was issued on May 23, but that number swelled to 66% a week later.
(Click thumbnails to view larger versions)
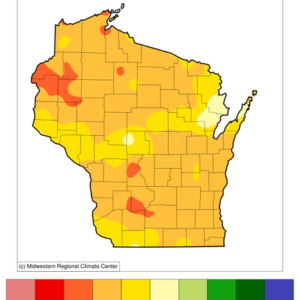
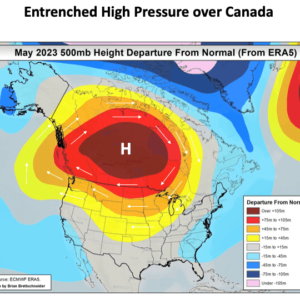
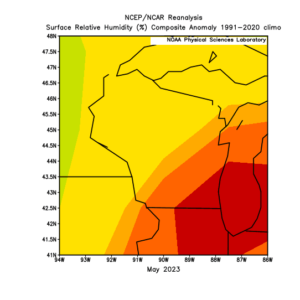
The rapid transition toward drought was caused not only by meager rainfall but also the exceptionally dry air masses that prevailed during May. The culprit was a persistent dome of high pressure (or relatively warm air) in the upper atmosphere over central Canada, whose outflow brought frequent winds from the northeast (sometimes transporting wildfire smoke) and blocked the usual influx of moist air masses from the Gulf of Mexico. Consequently, the moisture content of the air was extremely low, with the average monthly relative humidity more than 5% below normal over the entire state and greater than 10% below normal across roughly the southeastern third.
(Click thumbnails to view larger versions)
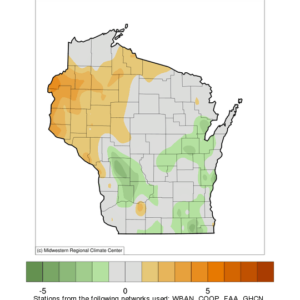
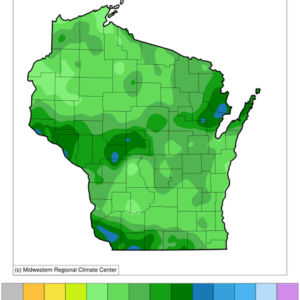
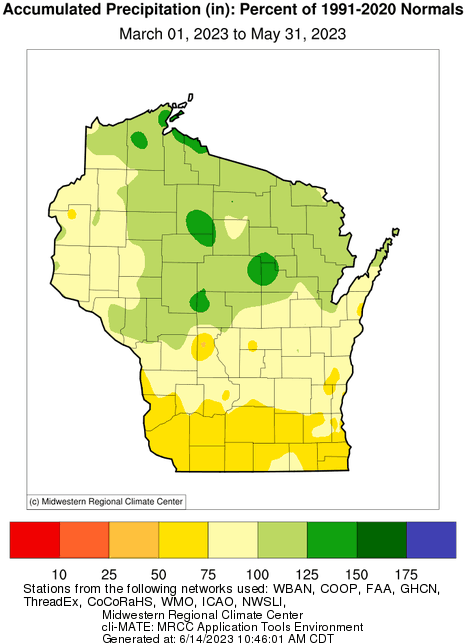
Following a wet March and April, the exceptionally dry May led to the spring (March to May) precipitation total in Wisconsin falling close to the 30-year normal (1991-2020). However, there was a split between somewhat wetter than average in the north and drier to substantially drier than average in the south. Statewide, this spring registered 90% of normal precipitation, placing it as the 68th wettest in the 129-year record and therefore fairly typical. But the real story was the remarkable variability during the past season, which featured heavy rains and snowfalls quickly followed by near-record precipitation deficits.
A Warm May
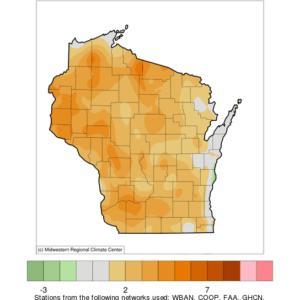
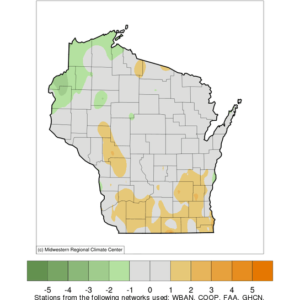
The statewide average temperature in May 2023 of 56.9°F was 1.5 Fahrenheit degrees warmer than normal. The month ranked 38th among all Mays in the 129-year record, so it was not especially unusual in terms of temperature. However, very dry air favors strong daytime heating and nighttime cooling, and the extremely arid air masses during May bear this out.
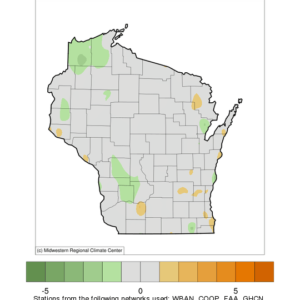
The average monthly daytime high temperature was a more impressive 2.6 Fahrenheit degrees above normal, whereas the average nighttime low temperature anomaly of 0.3 Fahrenheit degrees was barely above normal, and many parts of the state were actually below average. Northwest Wisconsin was the most anomalously warm (and dry) region, although the vast majority of the state experienced warmer-than-normal daytime highs during May.
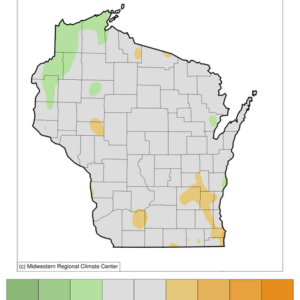
For the entire spring (March to May), the average temperature in Wisconsin exactly matched the 1991-2020 normal (43.0°F). Furthermore, few regions fell outside 1 Fahrenheit degree of normal for daily average temperature or daily minimum temperature, although much of the southern third of the state experienced average daily maximum temperatures that ranged from 1 to 2 Fahrenheit degrees warmer than normal.
(Click thumbnails to view larger versions)