Wisconsin experienced one of its most climatically eventful Februaries, with record-setting warmth and the first recorded February tornadoes in state history.
Record-Breaking Warmth
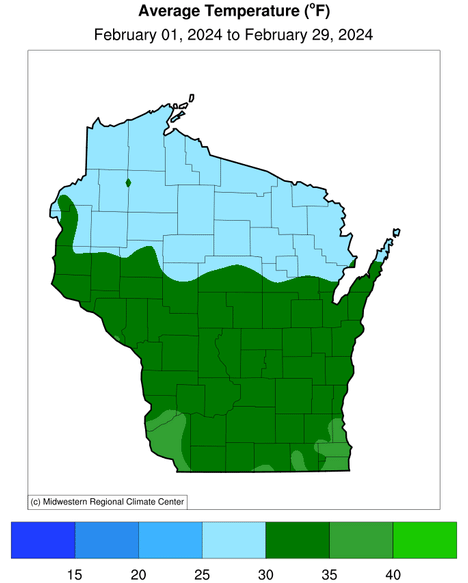
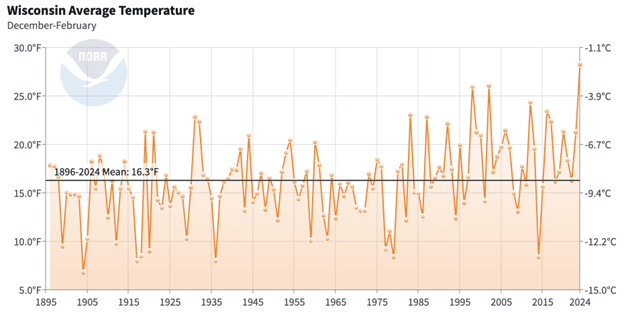
Wisconsin experienced its warmest February on record. The statewide average temperature was 31.8 degrees Fahrenheit, a remarkable 12.6 degrees warmer than the 1991–2020 normal (Figure 1). This warmth extended through the entire winter season, making it the warmest winter (December to February) since record-keeping began in 1895 (Figure 2). The statewide average temperature for the winter was 28.3 degrees, surpassing the previous record by a full 2 degrees (26.1 degrees in the winter of 2001-2002).
This winter’s record-breaking warmth was likely caused by the one-two punch of an exceptionally strong El Niño and the long-term warming trend, which has been more pronounced in Wisconsin during winter than any other season. El Niños feature unusually high ocean temperatures in the central and eastern tropical Pacific, and they often distort the typical location and strength of atmospheric jet streams in much of the world. Wisconsin often experiences mild winters during strong El Niños, due to a northward displacement of the jet stream that causes Arctic air masses to mostly remain in Canada.
Aiding the warmth was the unprecedented all-time February and winter high temperature of 77 degrees observed on February 27 at the Kenosha Airport. This temperature exceeded the former February and winter high temperature record of 72 degrees set in Fort Atkinson on February 23, 2017. In addition to Kenosha’s all-time high, more than 100 weather observation stations across Wisconsin also saw record high temperatures of their own on February 27, and 21 exceeded the previous statewide record of 72 degrees.
However, the fickle nature of Wisconsin weather was evident as temperatures plummeted the following morning, dropping into the teens and bringing a light dusting of snow. In fact, that dramatic temperature plunge set records for the largest 24-hour temperature fall at multiple locations, including Milwaukee, from 74 to 23 degrees.
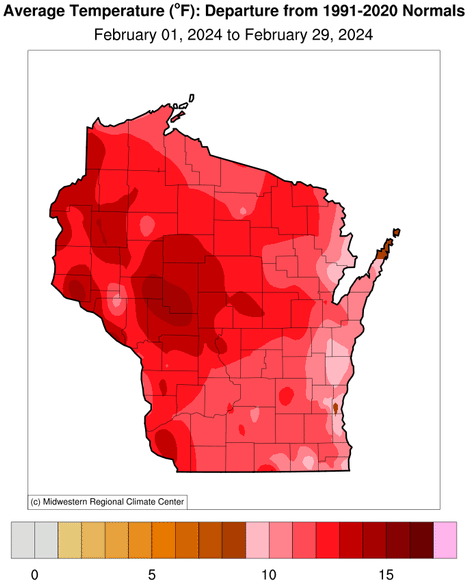
All parts of Wisconsin were exceptionally warm during February, especially the western part of the state, likely aided by its distance from the tempering influence of Lake Michigan (Figure 1). Parts of the west-central region had the largest temperature anomalies (departures from average) in excess of 14 degrees. Even the smallest regional temperature anomalies, over the tip of Door County, were still an impressive 8 to 9 degrees.
Record-Breaking Tornadoes
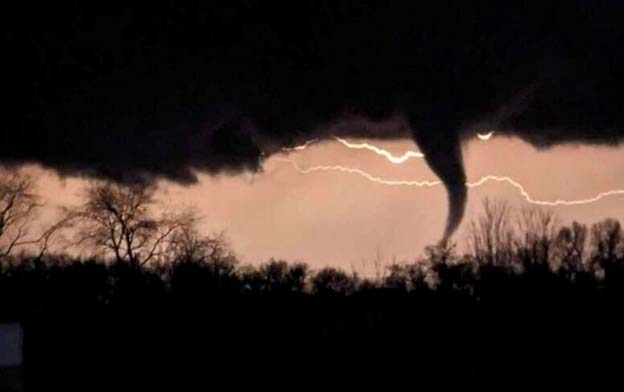
Continuing the theme of breaking records, Wisconsin saw its first (and second) February tornado on the eighth of the month (Figure 3). Unseasonably warm, humid, and unstable air, coupled with sufficient wind shear to create rotation, were responsible for these unprecedented February tornadoes. Both tornadoes, an Enhanced Fujita (EF) 1 and an EF2 on an intensity scale of zero to 5, struck the south-central region near Albany and Evansville, causing approximately 2.4 million dollars in damages. The impact on agriculture, not included in this cost, included silos, barns, and equipment.
The EF scale is used to assign a tornado a rating based on estimated wind speeds and related damage, where trained National Weather Service personnel will identify the appropriate damage indicators and degrees of damage. Surveyed damage helps estimate the range of wind speeds the tornado likely produced, where EF1 and EF2 tornadoes have three-second wind gusts of 86 to 110 and 111 to 135 miles per hour, respectively. You can view the National Weather Service’s website for more information on tornado ratings.
Dry Conditions Persist
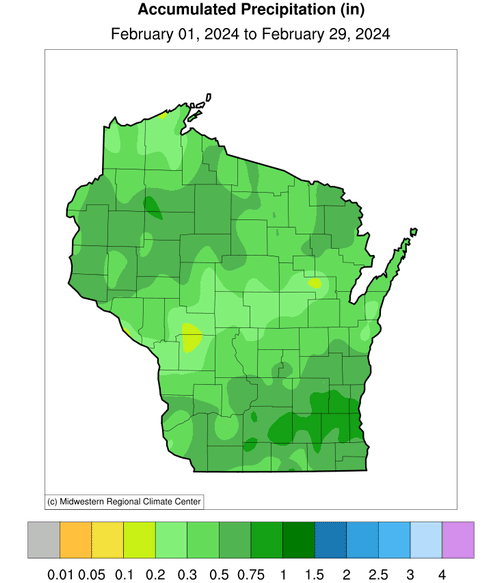
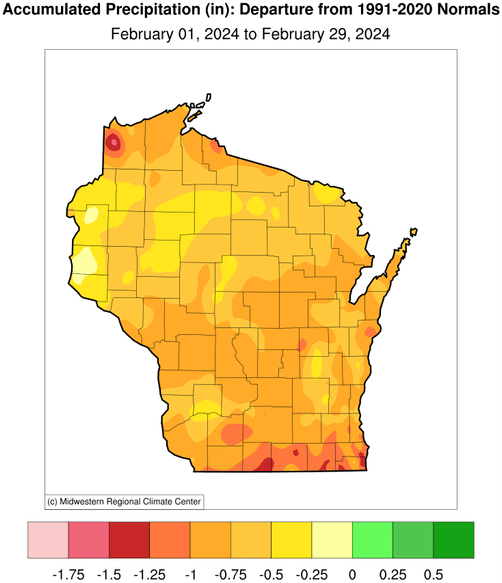
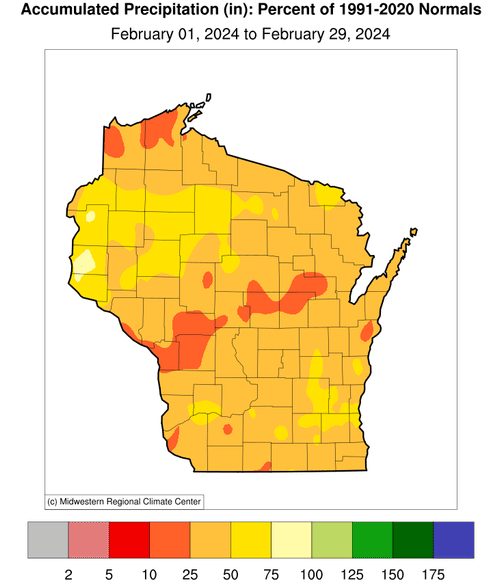
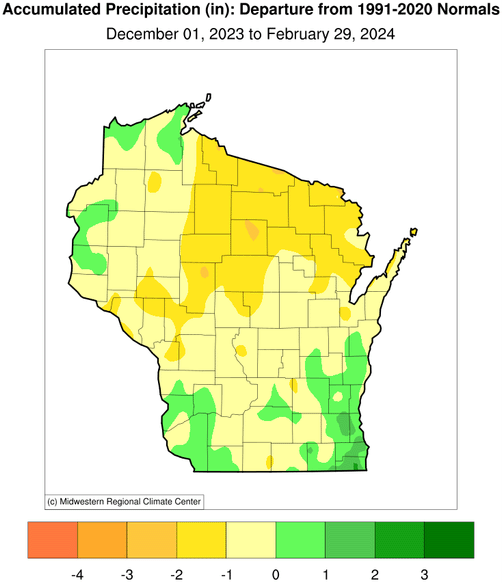
While precipitation did not make as much news as temperature during February, the past month came in as the 16th driest February, with a statewide average of only 0.44 inches of precipitation, which was 0.59 inches below normal (Figure 4). The dryness was very widespread, as virtually all of Wisconsin picked up less than 75 percent of normal monthly precipitation, and most of the state received less than half. Some regions even registered less than 25 percent of normal, especially a narrow band across central Wisconsin.
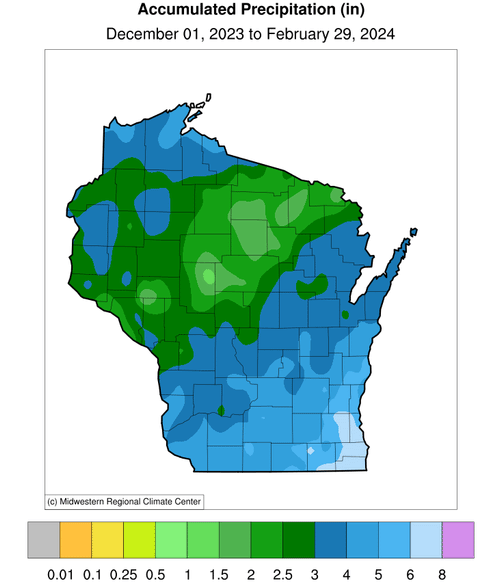
Unfortunately, dryness was a common theme throughout the winter. Although winter is typically Wisconsin’s driest season, much of Wisconsin received even less than its normal liquid-equivalent precipitation, with a statewide average of 3.10 inches (Figure 5). Unlike the uniformly dry conditions that prevailed across the state during February, the winterlong precipitation varied substantially by region. Much of southern Wisconsin enjoyed a slightly wetter than normal winter overall, due to a relatively wet January, while most of northern Wisconsin was unusually dry (less than 75 percent of average precipitation).

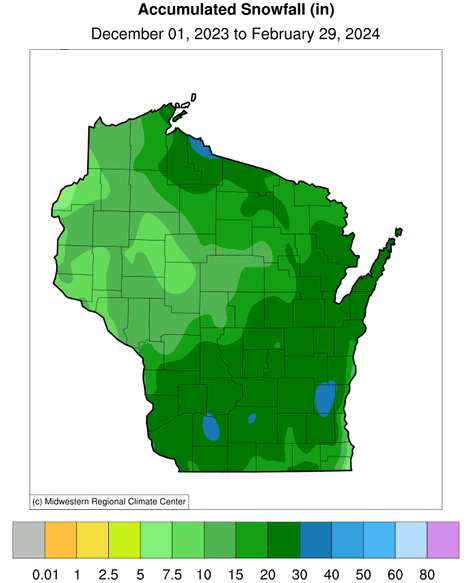
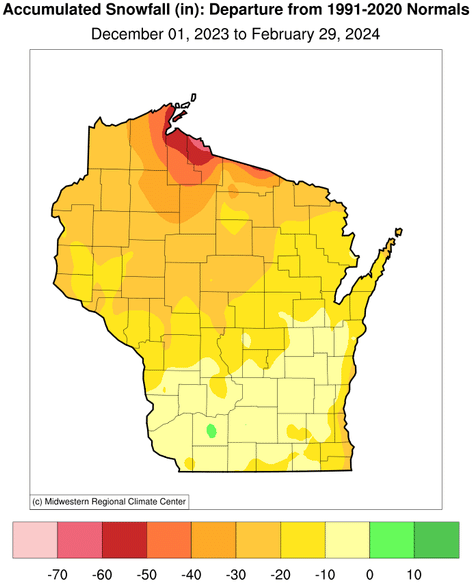
The combination of low precipitation and above freezing temperatures meant a major seasonal snowfall deficit, particularly in northern Wisconsin, where accumulations were 20 to 60 inches below normal. Shortfalls were especially pronounced along the Lake Superior snowbelt, where the near absence of Arctic air masses prevented lake effect snowfall, despite a mostly ice-free lake. Curiously, the southern part of the state was generally snowier than northern Wisconsin, thanks to two significant snowstorms that struck southern and eastern regions in mid-January (Figure 6).
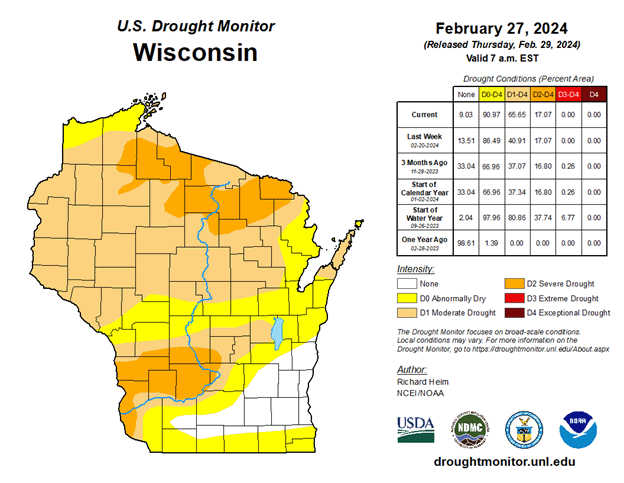
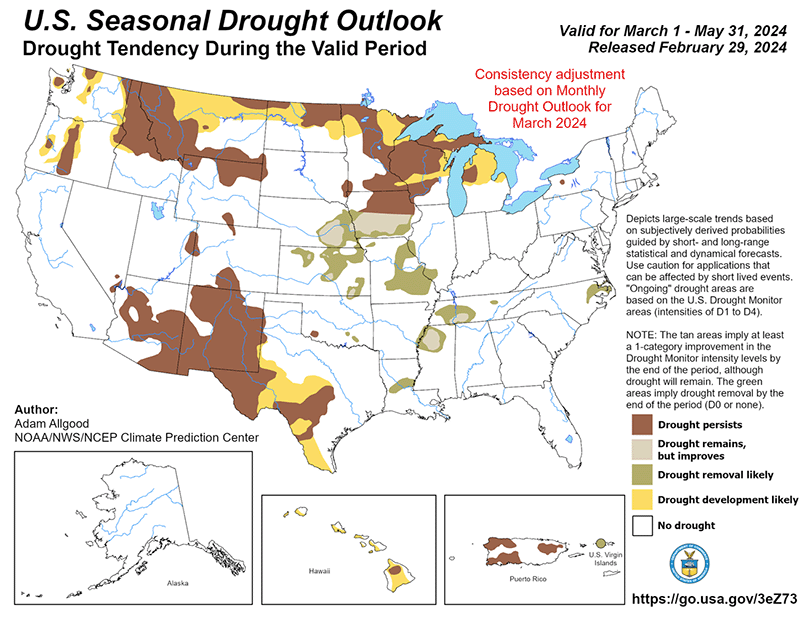
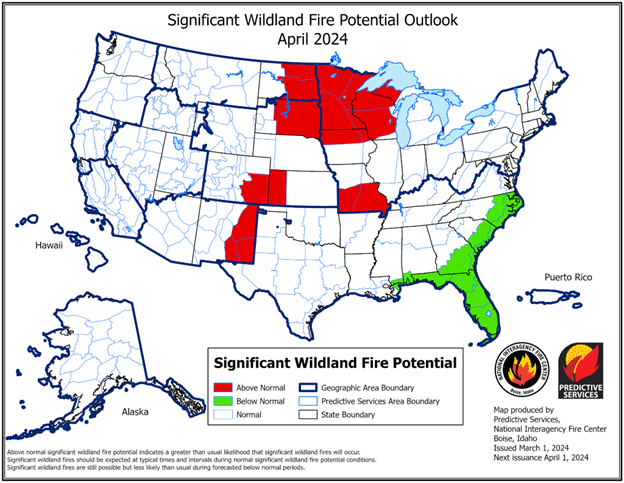
Prolonged warm and dry conditions during February exacerbated drought conditions across the state. By the end of the winter, 17 percent of Wisconsin was categorized as experiencing severe drought (D2) and 65 percent was under moderate drought (D1) (Figure 7). Unfortunately, drought conditions throughout northern, central, and southwestern Wisconsin may continue to persist throughout the spring (Figure 8). In fact, almost all of Wisconsin has above normal wildfire risk this spring, according to the National Interagency Fire Center (Figure 9).
Consequences of a Warm, Dry Winter
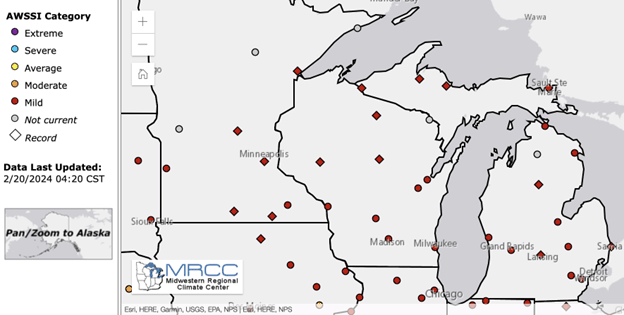
The Accumulated Winter Season Severity Index (AWSSI) measures the combined effects of temperature, snowfall, and snow depth over the course of a winter season. A low AWSSI value indicates a mild winter, while a high AWSSI value indicates a severe winter. The index is therefore a useful way to approximate the prolonged impacts of a warm, dry winter such as the one Wisconsin just experienced. Not surprisingly, the index was very low by late February across all of Wisconsin and the Upper Midwest (Figure 10). Record-low index values (since 1950) occurred over northern Wisconsin (Eau Claire, Wausau, and Minocqua), where the snowpack was the most abnormally low and temperature anomalies were the most positive in the state.
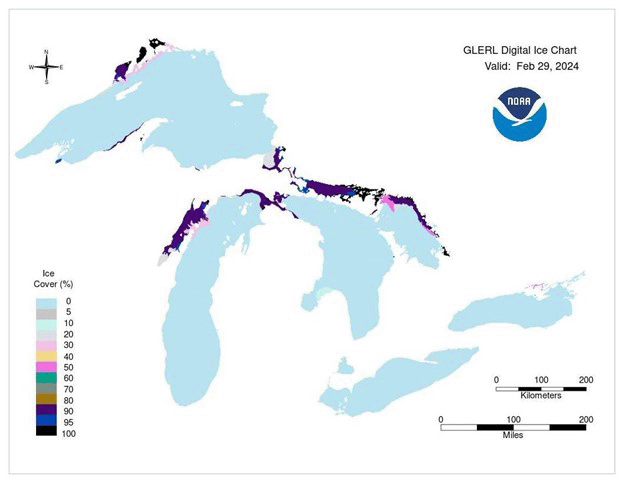
Unfortunately, these mild winter conditions had adverse effects on Wisconsin’s winter tourism industry, with snowmobile trails closed, unsafe ice conditions for fishing, and canceled winter festivals. Ice on Lakes Mendota and Monona in Madison lasted only about six weeks (January 15 to February 28), which is the second shortest period of ice coverage for Lake Mendota and the all-time shortest for Lake Monona. This meager ice coverage was likely the case for inland lakes statewide. Similarly, ice cover on the Great Lakes was mostly restricted to shorelines and bays at the end of February (Figure 11), even though the ice pack typically reaches its peak extent in late February or early March.
The unseasonably warm weather triggered early maple tree tapping, affecting syrup production schedules. Additionally, early bud break in trees, tree fruits, grape vines, and flowers was observed across the state. Given how quickly weather patterns can change in the Midwest, the possibility of a false spring this year poses a major threat to certain plants. Although it is tempting to assume that a mild winter will be followed by a warm spring, our recent analysis of weather stations around Wisconsin reveals that no significant relationship exists between average winter temperature and the timing of the final hard freeze of the cold season.
Outlook
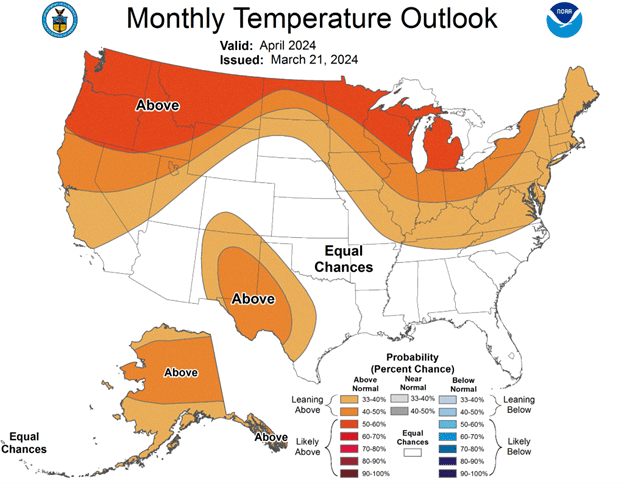
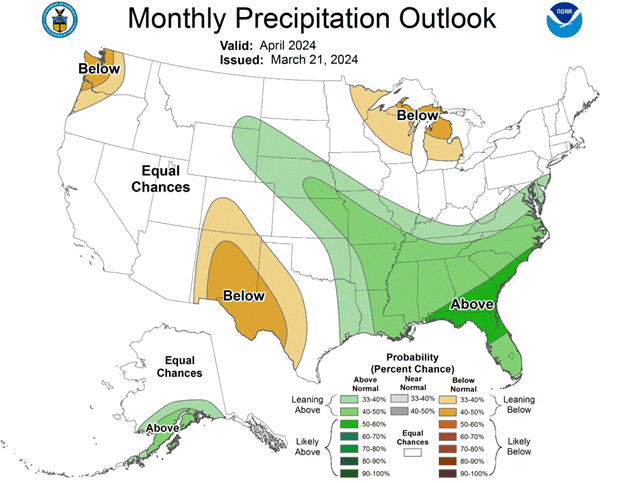
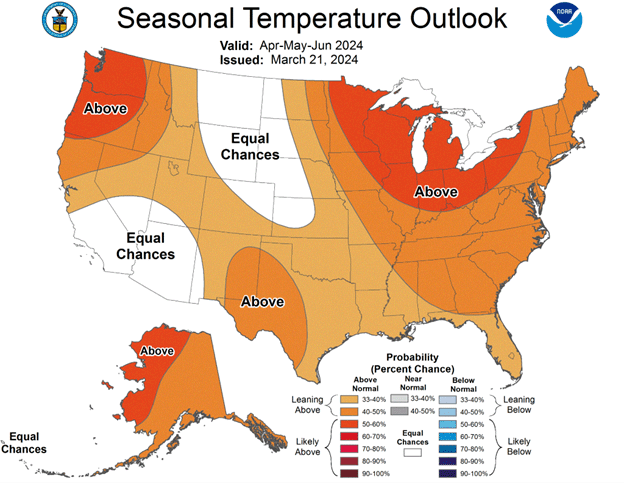
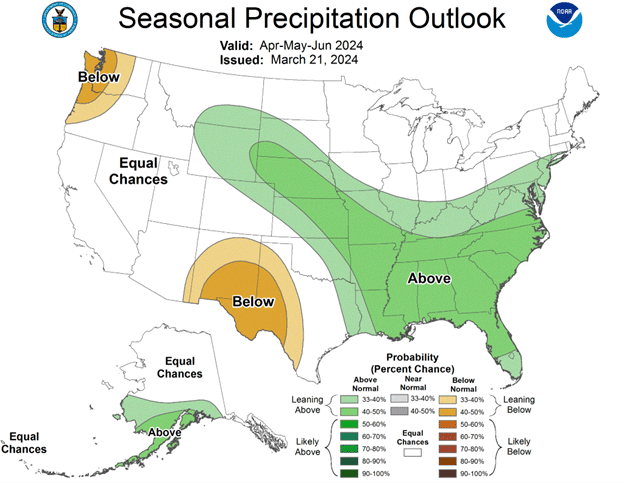
For the upcoming spring, warmer-than-normal temperatures continue to be favored over near or below normal temperatures across the state (Figure 12). While forecasted precipitation patterns in April show a slight lean toward below-normal conditions, the spring season in Wisconsin is equally likely to be wet, dry, or near-normal conditions. A transition from El Niño to neutral is likely by April to June 2024 (79 percent chance), with increasing odds of La Niña developing in June to August 2024 (55 percent chance).
Climate Corner
Q: Was the warm winter due to El Niño or a warming climate?
A: Other mild winters have also coincided with powerful El Niños, including recent instances during 2015–16, 1997–98, and 1982–83, but these cases and this winter were probably aided by the warming climate. By contrast, a very strong historical El Niño may have taken charge on its own in the winter of 1877–78, during a much colder climatic period, although we lack complete statewide records to thoroughly document this extreme season. It was dubbed “the Year without a Winter” in Minnesota; and western Wisconsin, La Crosse and Madison recorded their warmest winters on record.
The ice duration on Madison’s Lake Mendota was only 62 days in the winter of 1877–78, the lowest on record until 1982–83. Lake Pepin, located along the Mississippi River, lost its ice on March 9, 1878, the earliest ice-out date until the year 2000. Some newspapers in Minnesota reported that farmers were working their fields into December 1877. Growers then got a big head start in the spring, as the last frost in Milwaukee and Madison occurred on March 29, 1878, the earliest beginning to a growing season in either city.