January ended as Wisconsin’s 10th warmest January on record, but not before a mid-month visit from Old Man Winter, coupled with frigid temperatures and heavy snowfall in much of the state.
January’s Temperature Tango
The first 12 days of the new year mirrored the end of 2023 with Wisconsin’s temperatures averaging seven to 13 degrees (Fahrenheit) above normal, but that was quickly replaced with frigid temperatures as two rounds of winter storms swept across southern Wisconsin. During this time, average daily temperatures were 10 to 25 degrees below normal across the state, with southern Wisconsin experiencing the coldest conditions compared to normal (Figure 1).
Actual air temperatures plummeted well below zero, with an absolute minimum in the state of minus 23 degrees on January 20 in Sparta. The very strong (30 to 50 mph) north-northwesterly winds brought painfully cold wind chills down to 20 to 40 degrees below zero.
Various impacts resulted from the cold, including school closures, structural problems, and reports of several deaths. One consequence of this Arctic blast was that most, if not all, lakes across the state finally froze. Lake Mendota hit this mark on January 15, making it the third latest freeze in that lake’s 170-year ice record.
However, with above-freezing daytime temperatures the rest of January, the lake ice slowly thinned, making it a relatively short season for fishing, skating, and other ice-dependent activities. In addition, the Great Lakes ice cover remained meager throughout the month, hitting a record (since observations began in 1973) of only 0.4 percent coverage across all five lakes to start the year.
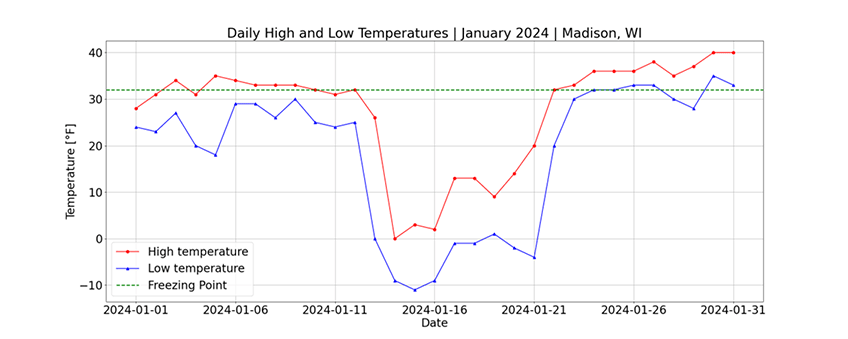
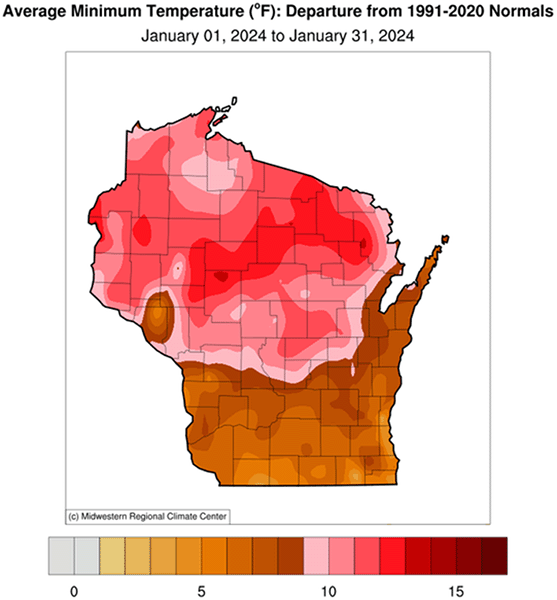
Despite the mid-month cold-air outbreak, this ended up being Wisconsin’s 10th warmest January on record since 1895, with a statewide average of 20.9 degrees. Amid the record warmth were a notable number of days when not even the daily low temperature fell below freezing, such as six days in Madison (Figure 1).
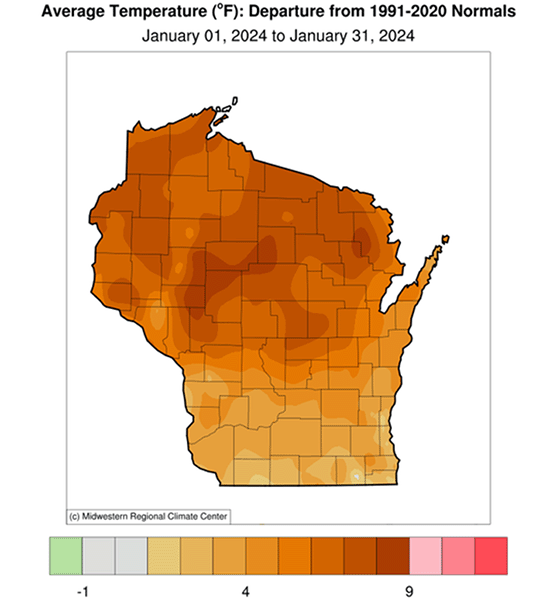
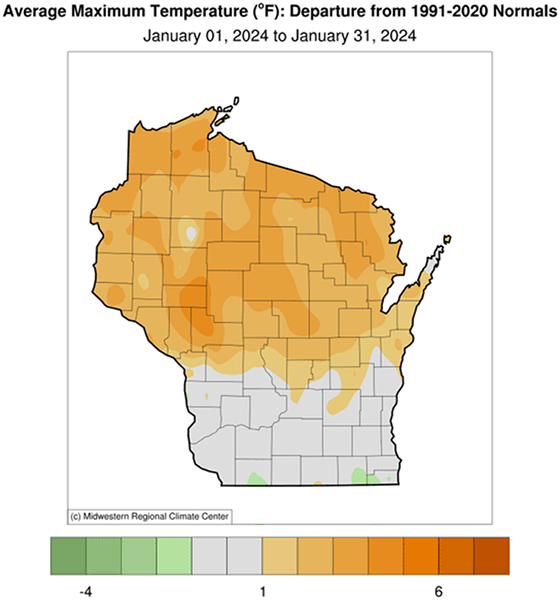
Additionally, there were 16 days in January when the low temperature was as warm or warmer than the normal daily high temperature in Madison. The northern half of the state felt the anomalous warmth the most, much like in December, with daily January average temperatures more than 7 degrees above normal for the month and daily minimum temperatures exceeding 10 degrees warmer-than-normal over most of the north (Figure 2). Because of the unseasonably warm conditions, maple sap was already flowing by the end of January.
A Flip-Flop in the Snow Pattern
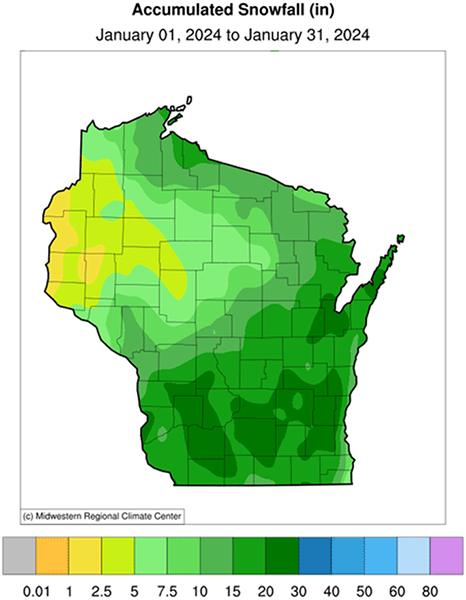
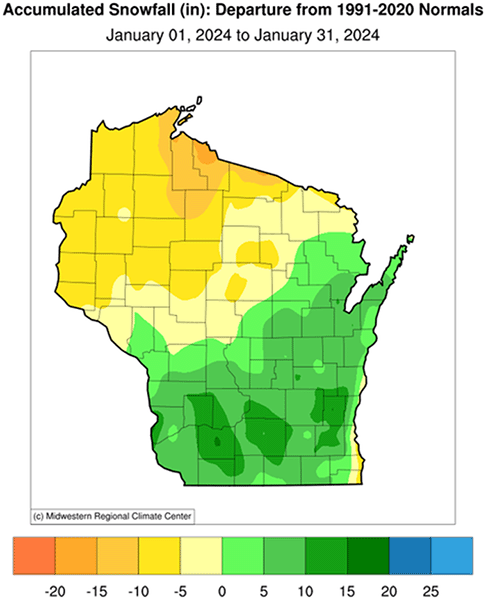
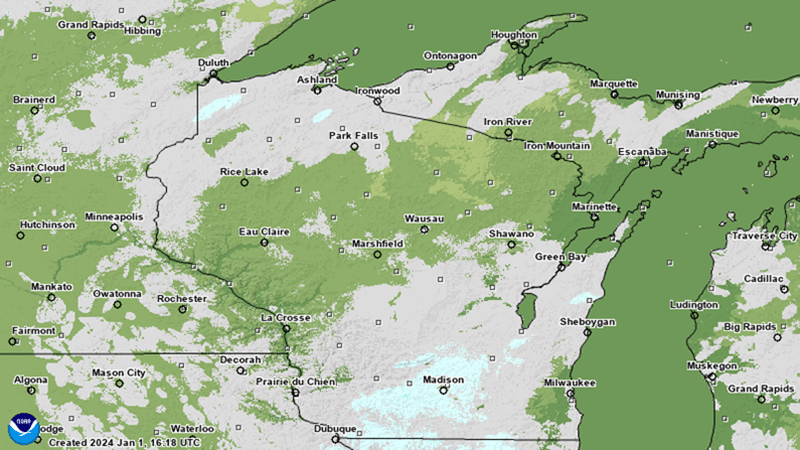
In a normal January, one expects the northern half of the state to receive more snow than the southern half. However, as noted previously, this January was far from normal. The shortage of precipitation combined with the warm temperatures meant that northern Wisconsin was down 5–15 inches of normal January snowfall, for a monthly total of only 1–15 inches (Figure 3).
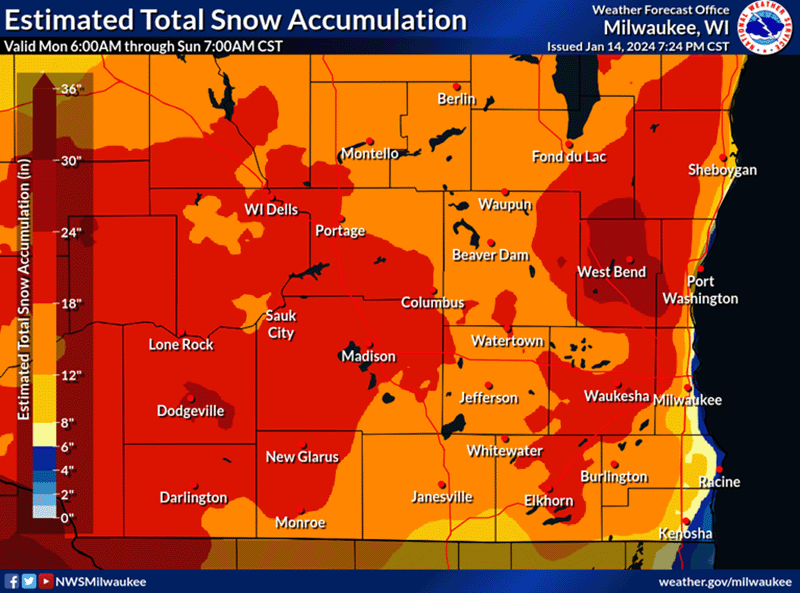
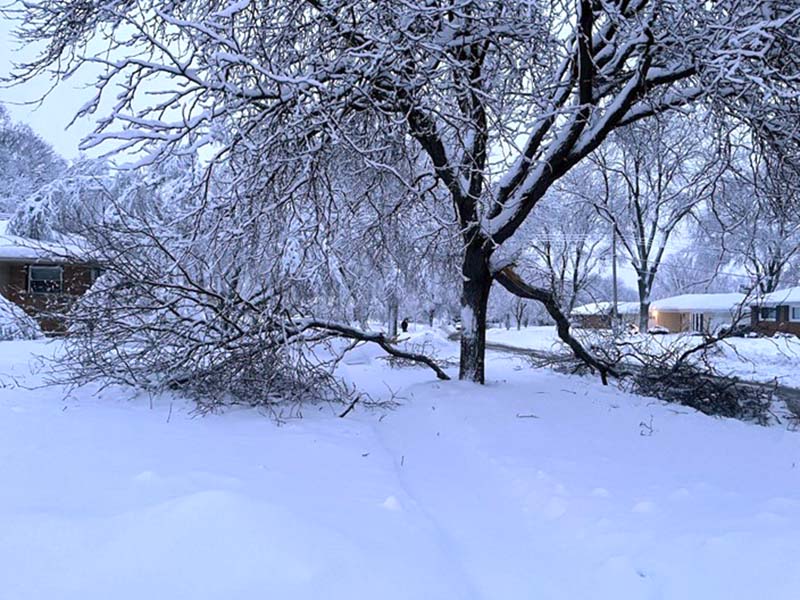
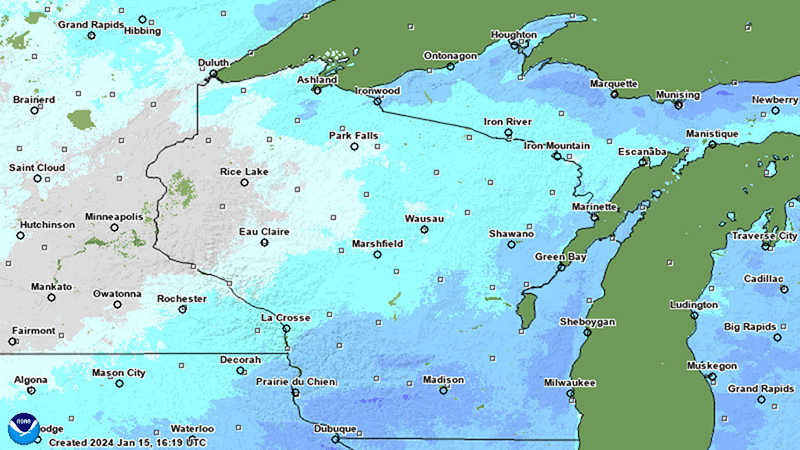
Meanwhile, upwards of 18 inches fell from January 9 to 13 throughout southern Wisconsin as a result of two major winter storms that tracked across the region (Figure 4). Due to the sheer amount of wet, heavy snow combined with the Arctic air mass that followed, infrastructure, trees, and powerlines were affected for several days (Figure 5). However, as the month went on, much of the snow had disappeared with the mostly above-freezing high and low temperatures (Figure 6).
Unfortunately, the overall lack of winter in January adversely affected Wisconsin’s tourism industry. In addition to unsafe ice, snowmobile trails have remained closed for much of the winter, and winter festivals have been canceled. Furthermore, with the exception of the snowmelt, there’s been very little opportunity for soils to recharge after extensive drought in 2023.
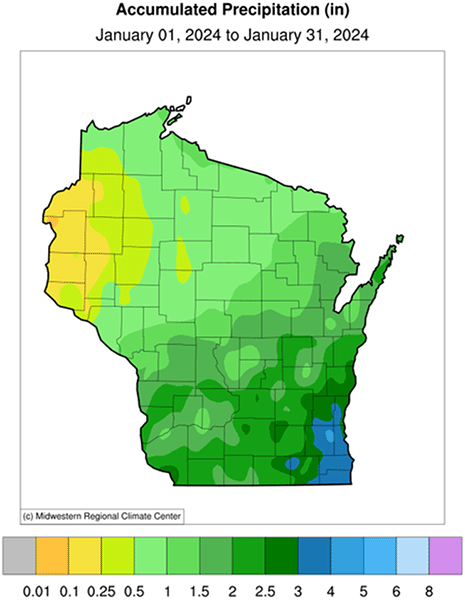
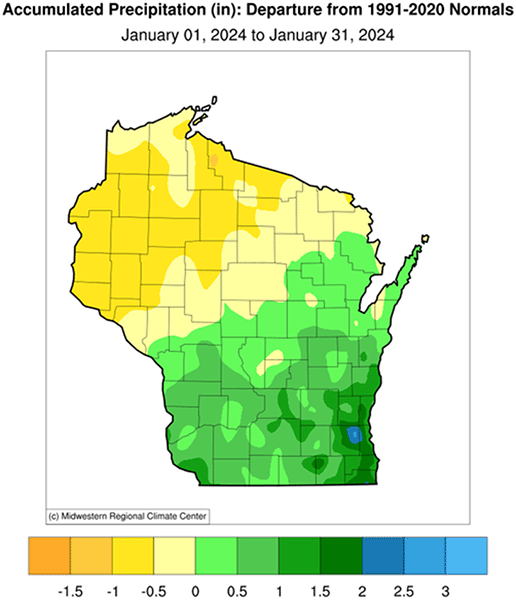
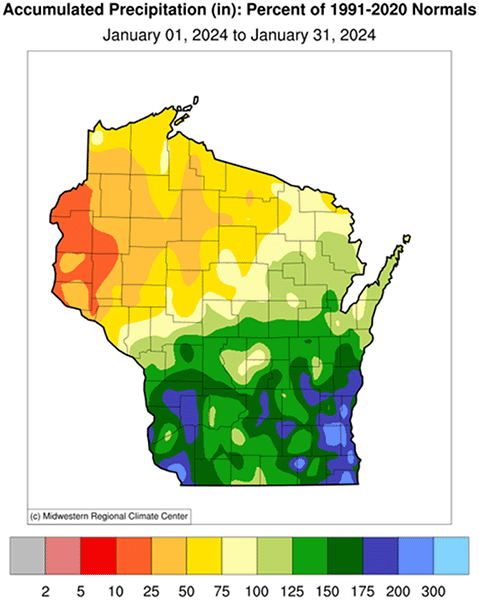
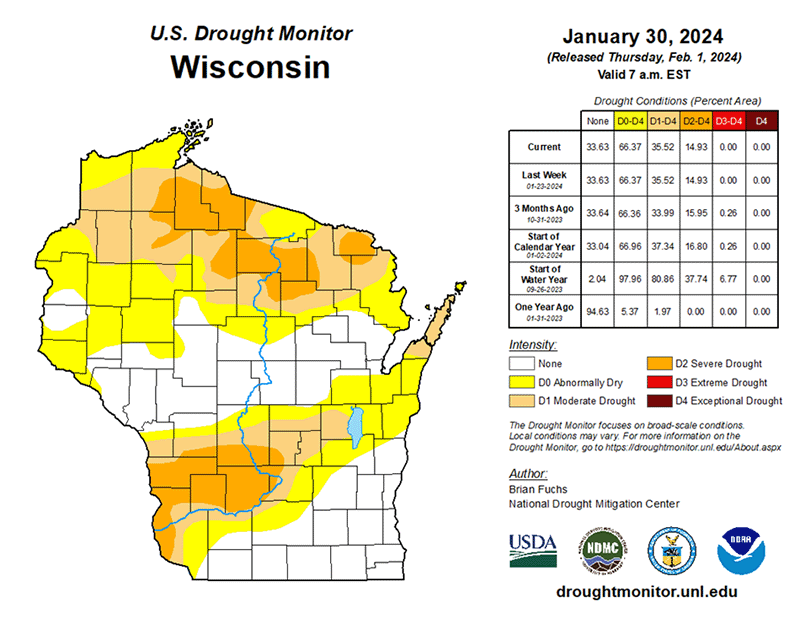
Even though much of southern Wisconsin received at least 25 percent more precipitation than normal for the month, that translates to a surplus of no more than an inch in a lot of the region. A portion of northwest Wisconsin saw as little as 0.1 to 0.25 inches of accumulated January precipitation, which is 10 to 25 percent of normal precipitation (Figure 7). Farmers may need to consider whether there will be enough soil moisture for proper seed germination come springtime planting, especially as northern and southwestern Wisconsin remain under moderate or severe drought (Figure 8).
Winter Blues
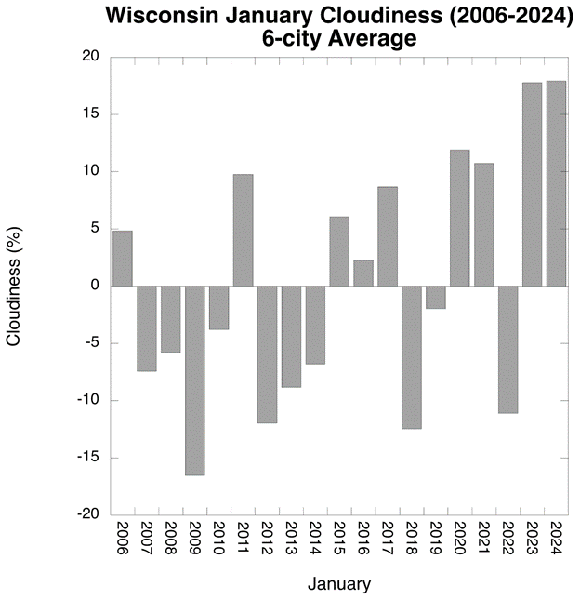
January was relentlessly cloudy, virtually repeating the gloominess of January 2023 (Figure 9). All six “first-order” weather stations across Wisconsin (Eau Claire, Green Bay, La Crosse, Milwaukee, Madison, and Wausau) averaged more than 70 percent daily sky cover, with Wausau, Madison, and Milwaukee exceeding 80 percent. Out of the 31 days last month, these locations saw 15 to 19 days with complete (100 percent) sky cover. Adding to the dreariness was persistent fog, ranging from 13 days with reported fog in La Crosse to 20 days in Madison.
Outlook
According to the Climate Prediction Center at the time of this writing, we will continue to see the effects of El Niño through the spring as warm temperatures are slightly more likely across the state this spring than near or below normal temperatures (Figure 10). On the other hand, there is no strong signal in terms of precipitation, so Wisconsin has equal chances of a wet, dry, or near-normal spring season.
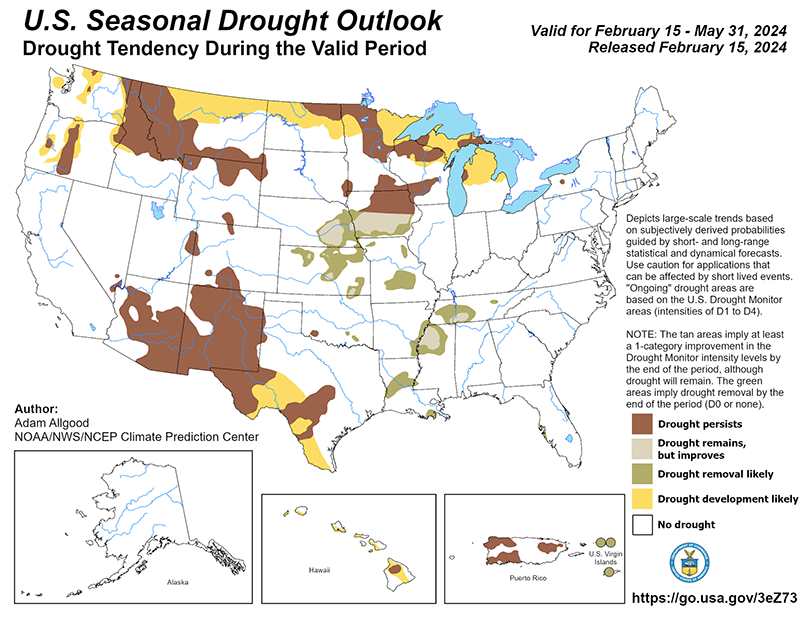
In terms of drought, it seems that areas across western, central, and northern Wisconsin could continue to experience drought through the spring, with a possible expansion of drought in the north (Figure 11). As this year progresses, we are expected to transition from El Niño (unusually warm tropical Pacific Ocean) to La Niña (unusually cool tropical Pacific Ocean) by autumn (Figure 12). You can check NOAA’s Climate Prediction Center for updated outlooks.