March delivered exactly what Wisconsinites might expect from early spring: a little bit of everything.
- Warmer than normal despite a temperature rollercoaster.
- Seventh snowiest March on record.
- Weather whiplash created agricultural challenges.
Temperature Swings
Swings between summerlike warmth and winter chill defined March as temperatures bounced sharply throughout the month (Figure 1).
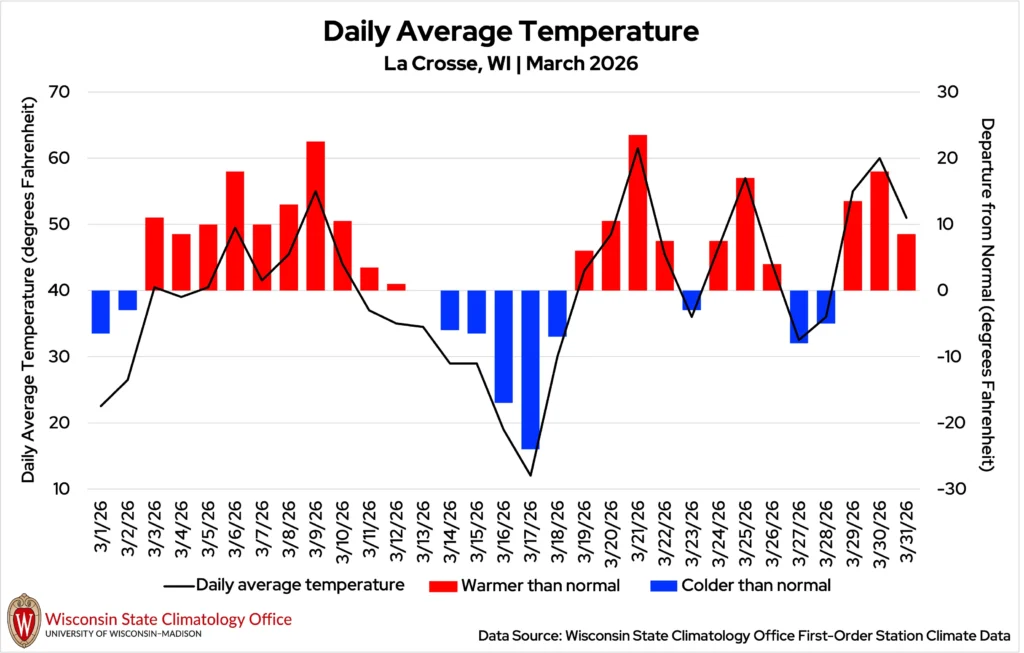
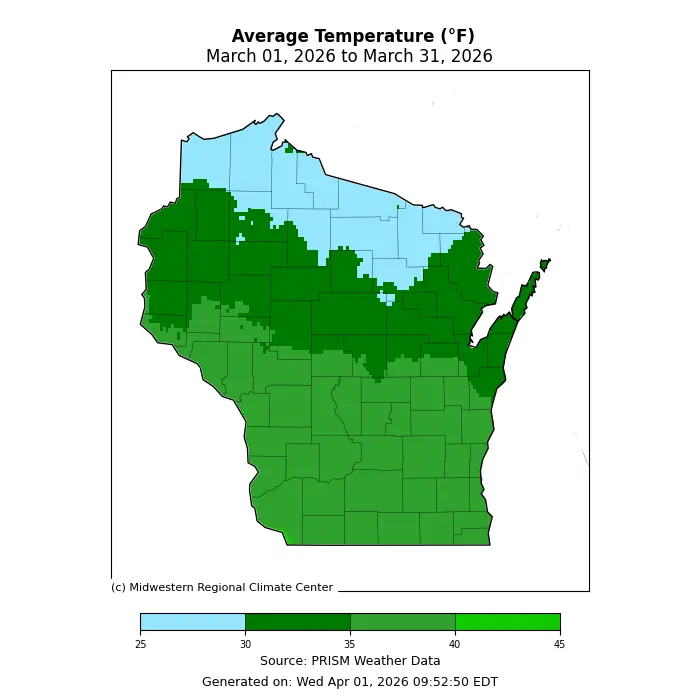
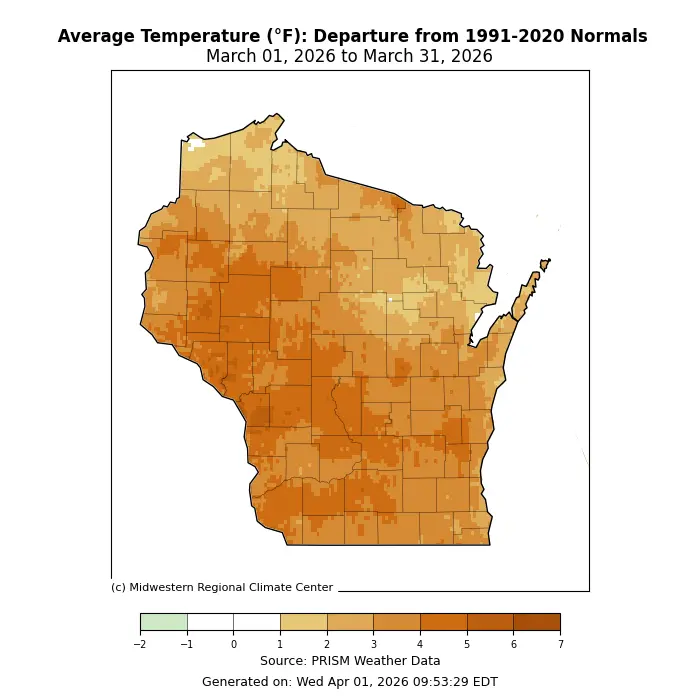
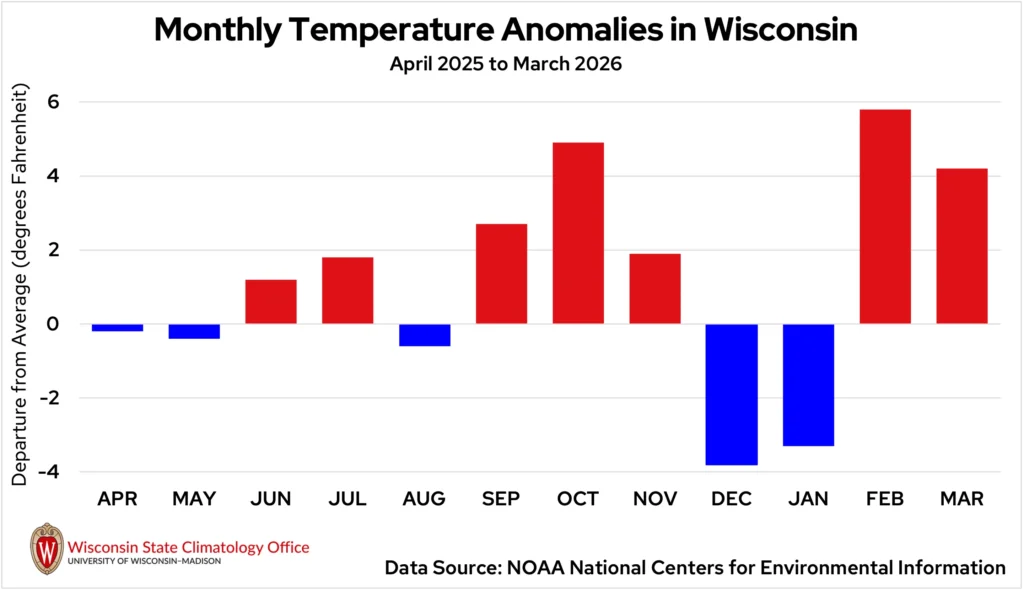
Even with those ups and downs, Wisconsin averaged 34.7 degrees, a notable 4.2 degrees above normal, marking the second warmer-than-normal month in a row (Figures 2 and 3).
The first major warm surge arrived early in the month, bringing temperatures more typical of early April than early March. On March 9, much of southern Wisconsin climbed into the 70s for the first time since November, weeks ahead of schedule.
Milwaukee saw 72 degrees on this day, even though its typical first 70-degree day is April 2, and Madison hit 70 degrees, also ahead of its usual April 4 milestone.
But March quickly reminded us that winter had not fully let go. By mid-month, temperatures plunged well below normal, with some places seeing daytime highs colder than their typical overnight lows.
The coldest readings of the month dropped to 16 degrees below zero, reported in Couderay (Sawyer County) on March 17 and Clam Lake (Bayfield County) on March 18.
Then came another dramatic reversal. On March 21 and 22, over a dozen locations across southwestern Wisconsin reached 80 degrees or hotter, the first such readings in the state since October.
La Crosse soared to 83 degrees on March 21 — an astonishing 35 degrees warmer than the normal high temperature — shattering its previous daily record of 75 degrees, set in 1911 and 2022. This tied with Sparta (Monroe County) and Prairie du Chien (Crawford County) for the warmest temperature observed anywhere in the state this month.
A final burst of summerlike warmth arrived on March 30, when 70s stretched from southeastern to west-central Wisconsin. Madison tied its daily record high of 78 degrees, first set in 1967 — a temperature more typical of mid-June than late March.
A few locations even pushed back into the 80s, highlighting the month’s dramatic swings between winter cold and early-summer warmth.
The final day of March added another twist: lingering warmth from the day prior caused some locations to hit — or nearly hit — their daily highs before dawn. Temperatures then swung 15 to 20 degrees several times throughout the day as cold fronts and brief warm spells passed, underscoring the extreme variability that closed out the month.
Even with the mid-month winter conditions, the longer-term trend continues to point toward less time spent below freezing during March. Since 1951, the number of March hours below freezing has declined substantially statewide. Most of the state has lost roughly two to three percent of sub-freezing hours per decade (Figure 4). That translates to losing about one sub-freezing hour every March.
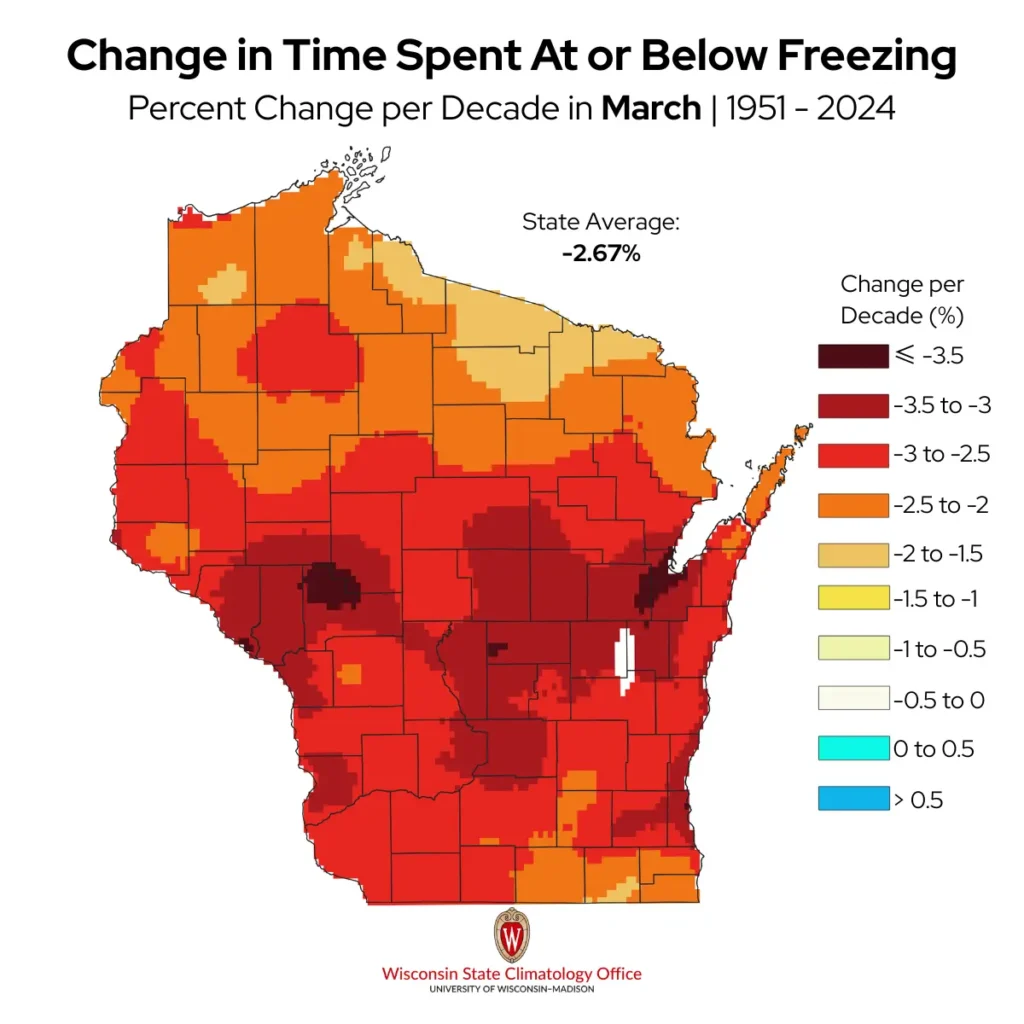
Madison’s conditions this March reflected this broader statewide trend. The city spent 212 hours (28.5 percent of the month) with sub-freezing temperatures, well below the 1951 to 2024 average of 346 hours (46.5 percent). This decline in sub-freezing weather fits within a broader warming spring pattern, with Madison now experiencing about 10 additional warm spring days than in 1970.
From Thunderstorms to Snow
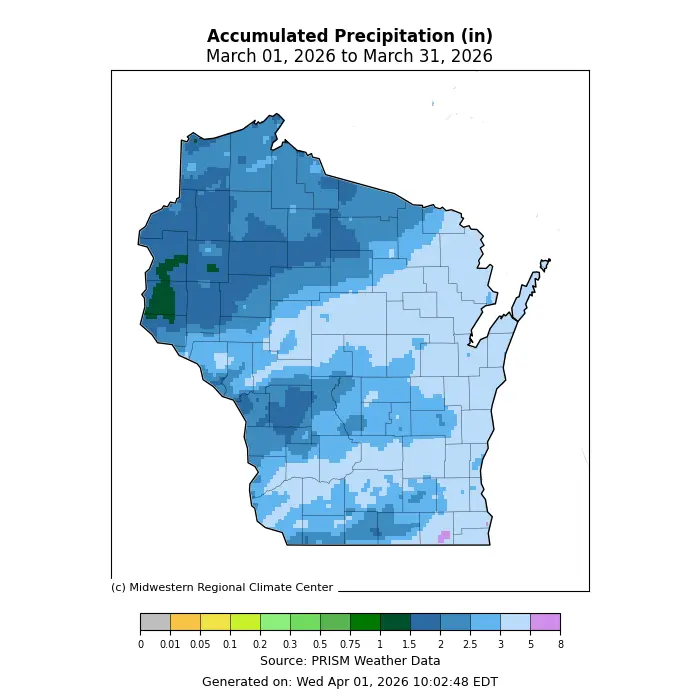
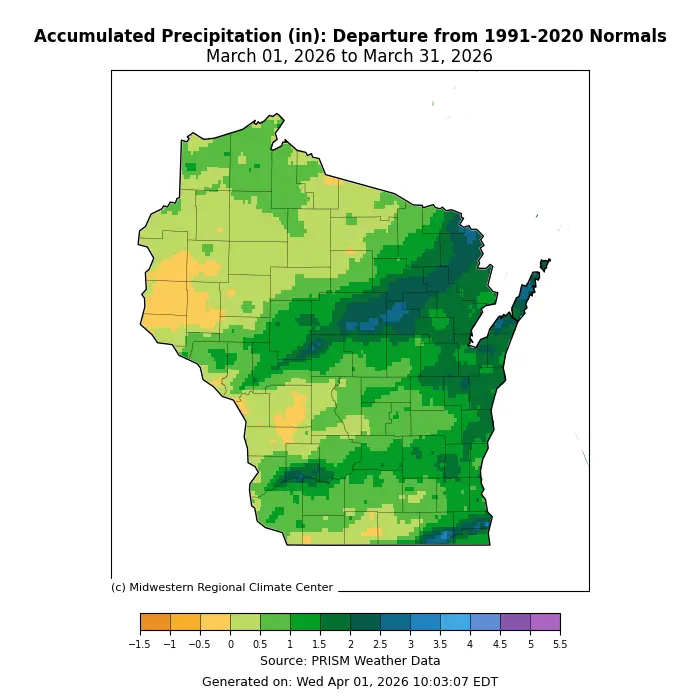
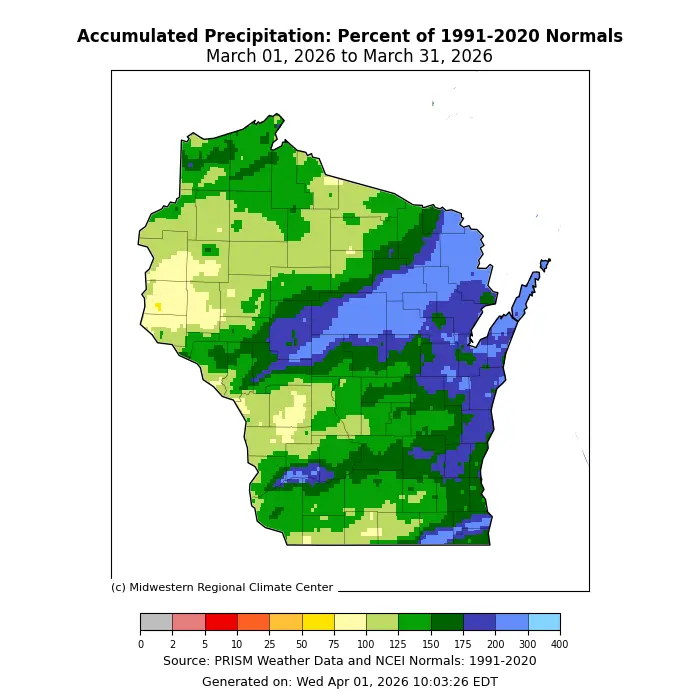
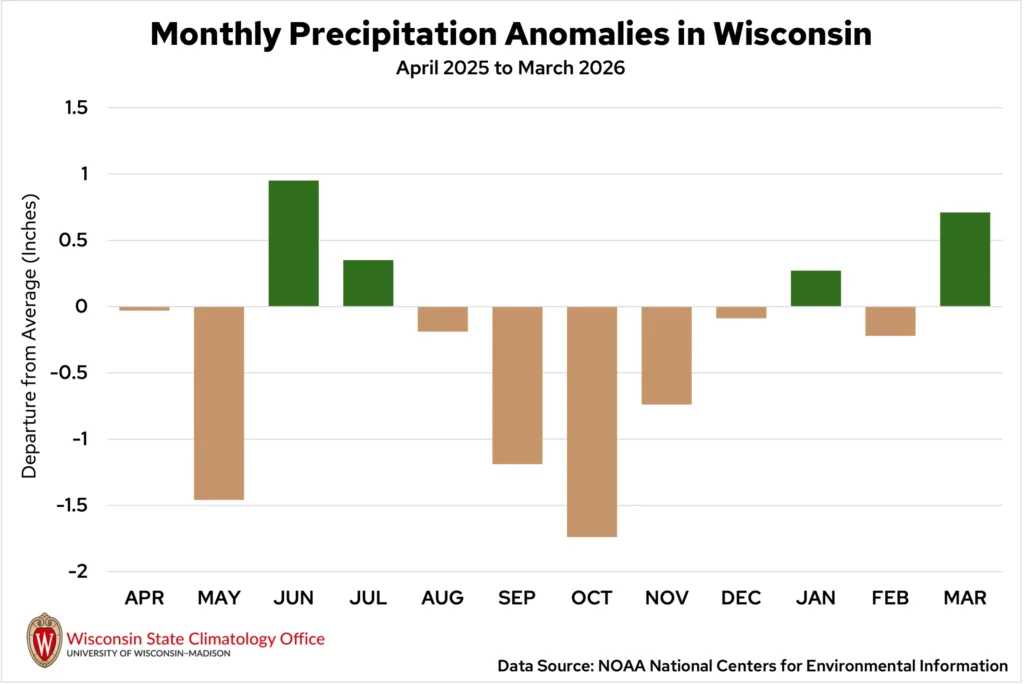
Similar to Wisconsin’s temperatures through the month, March precipitation was caught between spring and winter. Both thunderstorms and heavy snow added to the state’s above-average precipitation total of 2.53 inches, which is 0.71 inches wetter than typical (Figures 5 and 6).
March 6 and 7 brought heavy downpours and some rumbles of thunder across the state. Green Bay set a new daily precipitation record for March 7 with a total of 0.52 inches, nearly doubling the previous record from 1973. More impressive rain totals over an inch were reported throughout southern Wisconsin. With totals over two inches, parts of Grant and Richland counties received more than 100 percent of their average monthly precipitation in just two days.
Heavy downpours on March 10 left parts of southeast Wisconsin underwater, flooding fields and streets in Racine County. The highest reports of one to two inches of rain were concentrated in Walworth and Racine counties.
The calendar flipped back to winter by the middle of the month as an Alberta Clipper brought a half-foot of snow to Wisconsin’s northern and central counties on March 13. Isolated totals of 10 inches were seen north of Wausau and Green Bay.
This was just the appetizer to the major storm that arrived two days later.
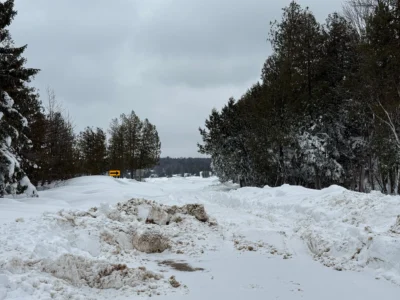
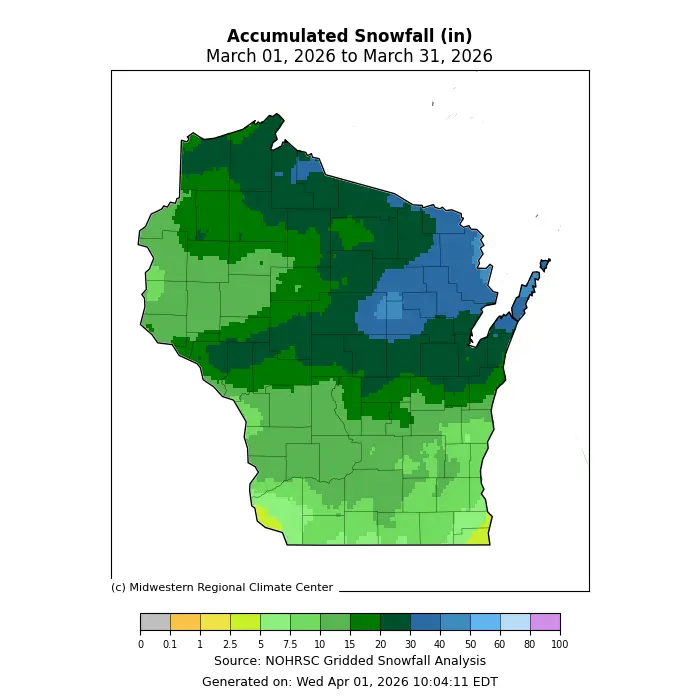
From March 15 to 16, a historic blizzard brought more than a foot of snow and whiteout conditions to the Badger State. Totals exceeded two feet in many northeastern counties, and gusty winds created large snow drifts that made roads impassable for days (Image 1). Wausau recorded both the city’s snowiest day and largest snowstorm on record. The month as a whole was Wausau’s snowiest March on record, and the third snowiest for Green Bay.
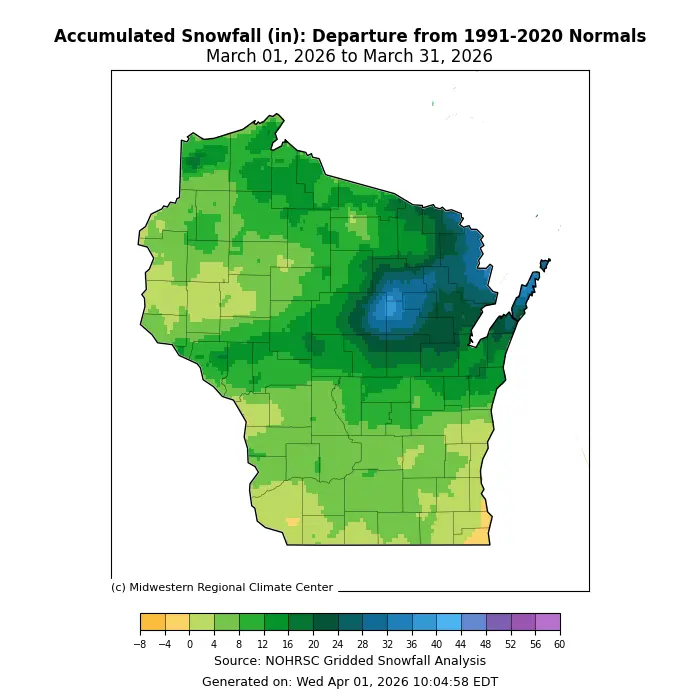
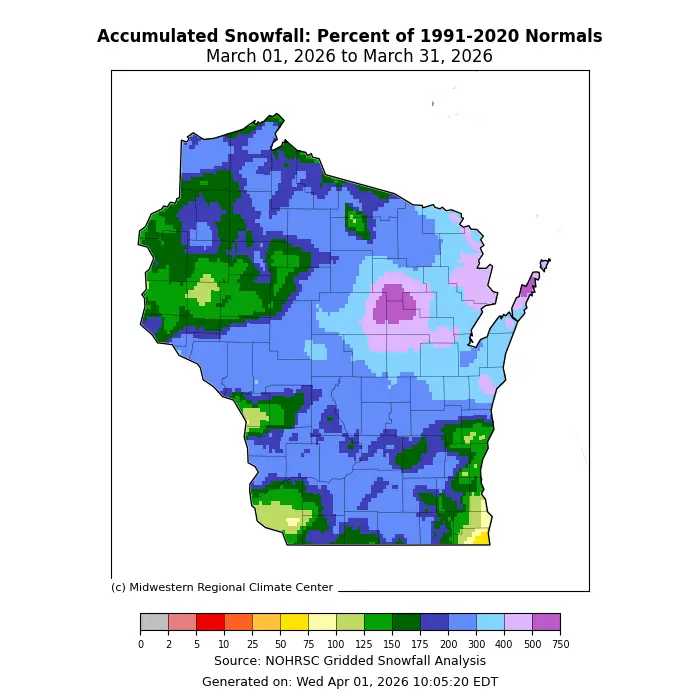
Statewide, March was snowier than normal by 10.1 inches, with a statewide average of 18.2 inches (Figure 7). This makes 2026 Wisconsin’s seventh snowiest March on record.
Severe Weather Returns
The state’s first severe thunderstorms of the season arrived in southern Wisconsin on the evening of March 10. Along with flooding in Racine County, quarter-sized hail (one-inch in diameter) was reported in parts of Rock and Kenosha counties.
Though not accompanied by thunderstorms, gusty winds over 50 miles per hour on March 13 brought down tree branches and caused thousands of power outages across the state’s southern counties.
Thunderstorms returned at the end of the month, this time to central Wisconsin. Scattered severe storms dropped golfball-sized hail (1.75 inches in diameter) across Marathon, Brown, and Calumet counties.
By the end of the month, the National Weather Service had issued 20 severe thunderstorm warnings in Wisconsin, nearly triple the 30-year average for March.
Reduced Drought
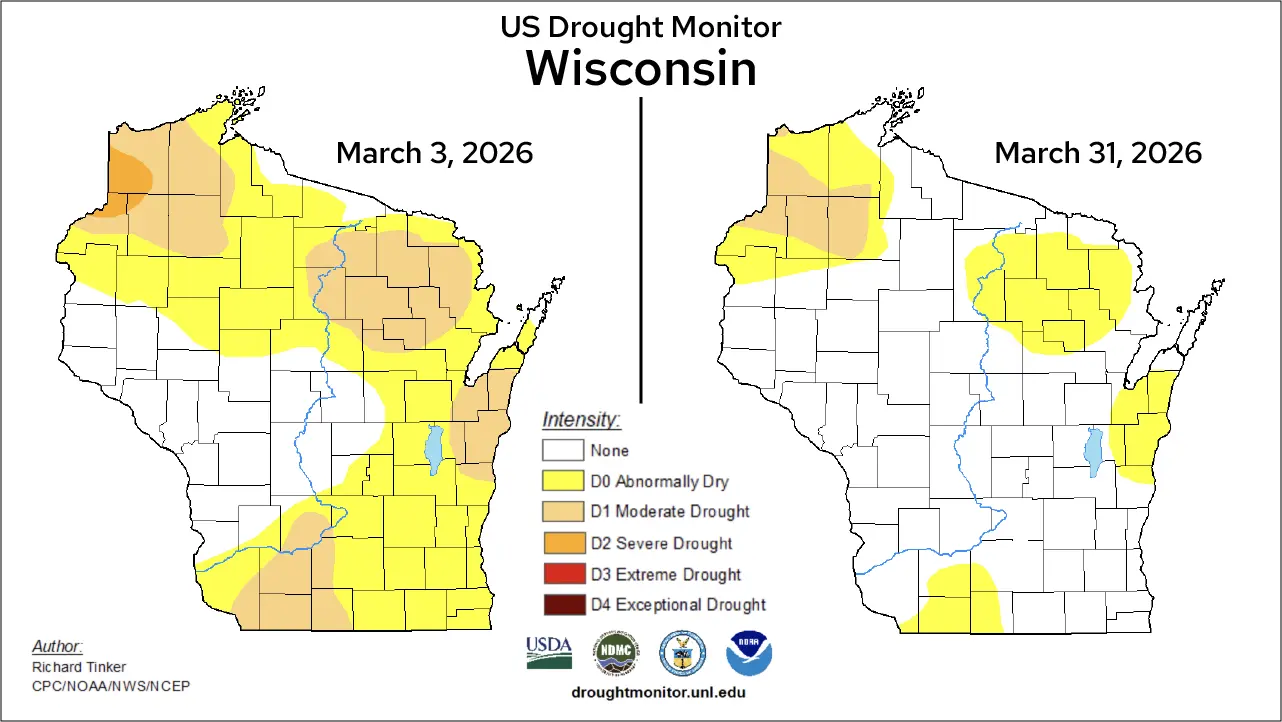
March’s soggy weather helped greatly reduce drought conditions across the Badger State. Following early-month downpours and the mid-month blizzard, the Drought Severity and Coverage Index decreased significantly (Figure 8).
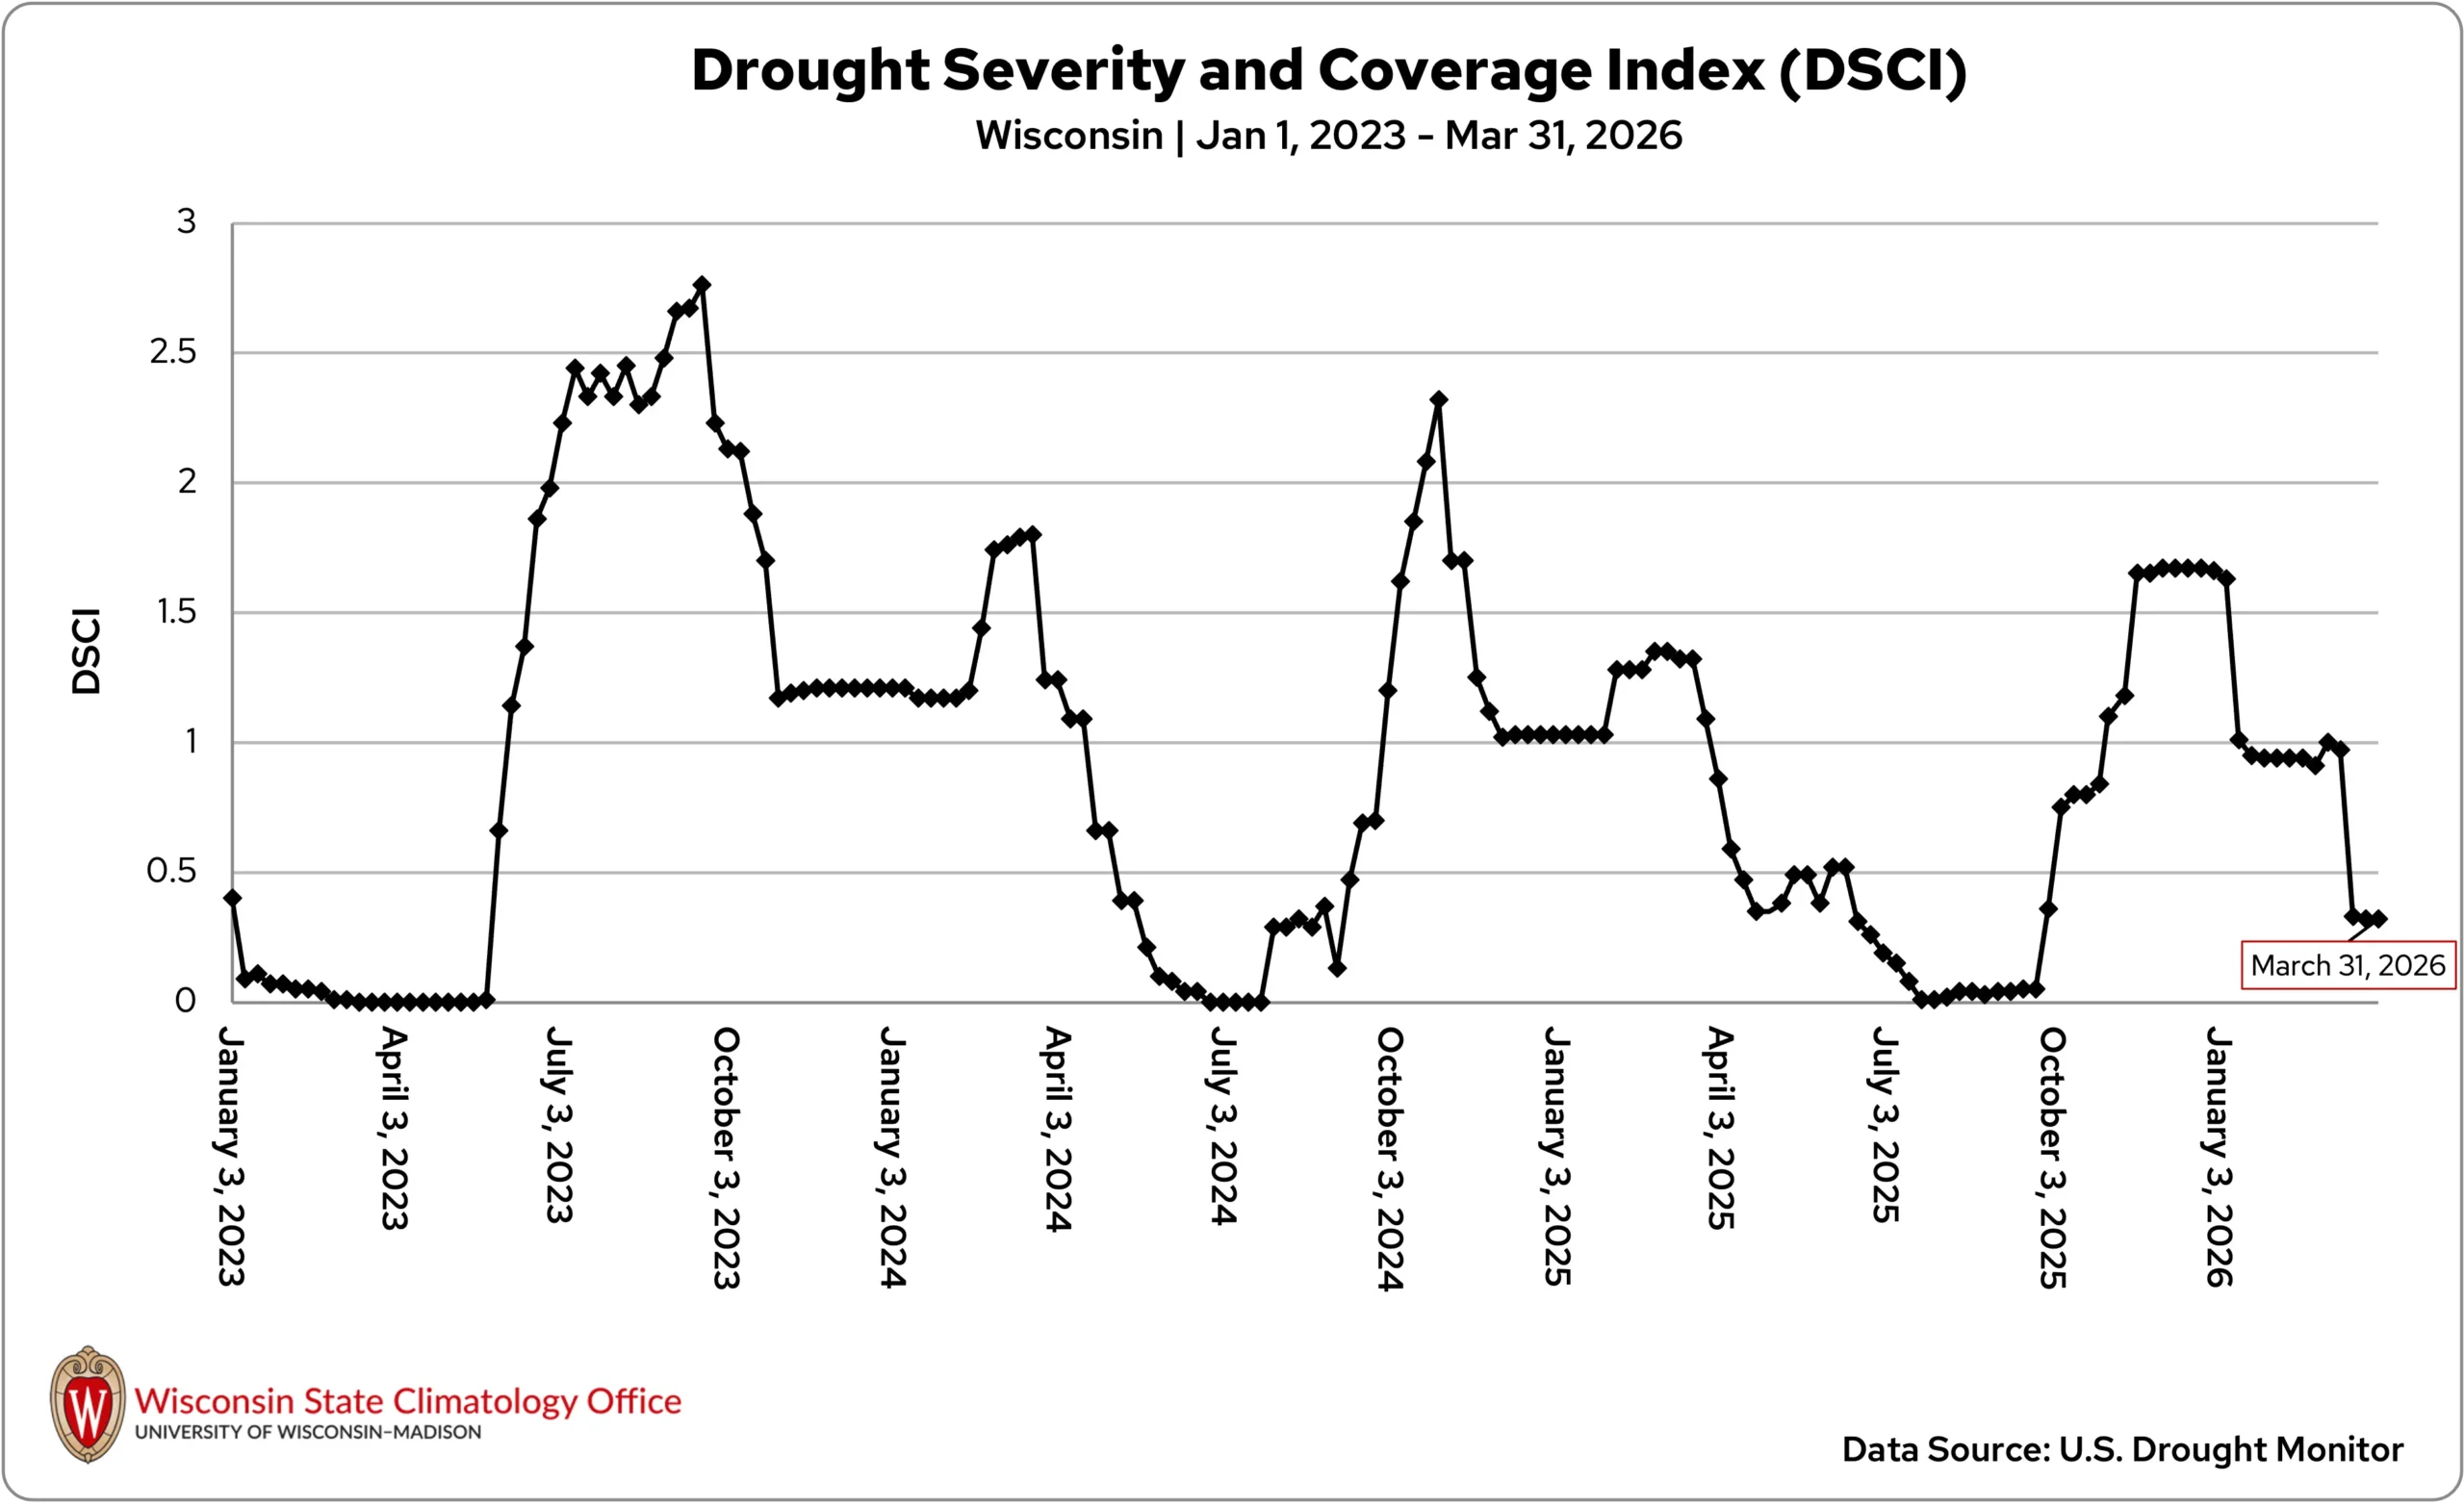
Severe drought (D2) had receded from the state by mid-month, along with nearly all areas of moderate drought (D1). By March 31, only a sliver of northwestern Wisconsin remained in moderate drought (Figure 9). Wisconsin ended the month with 73 percent of the state reporting normal soil conditions.
Lake Ice Season Ends
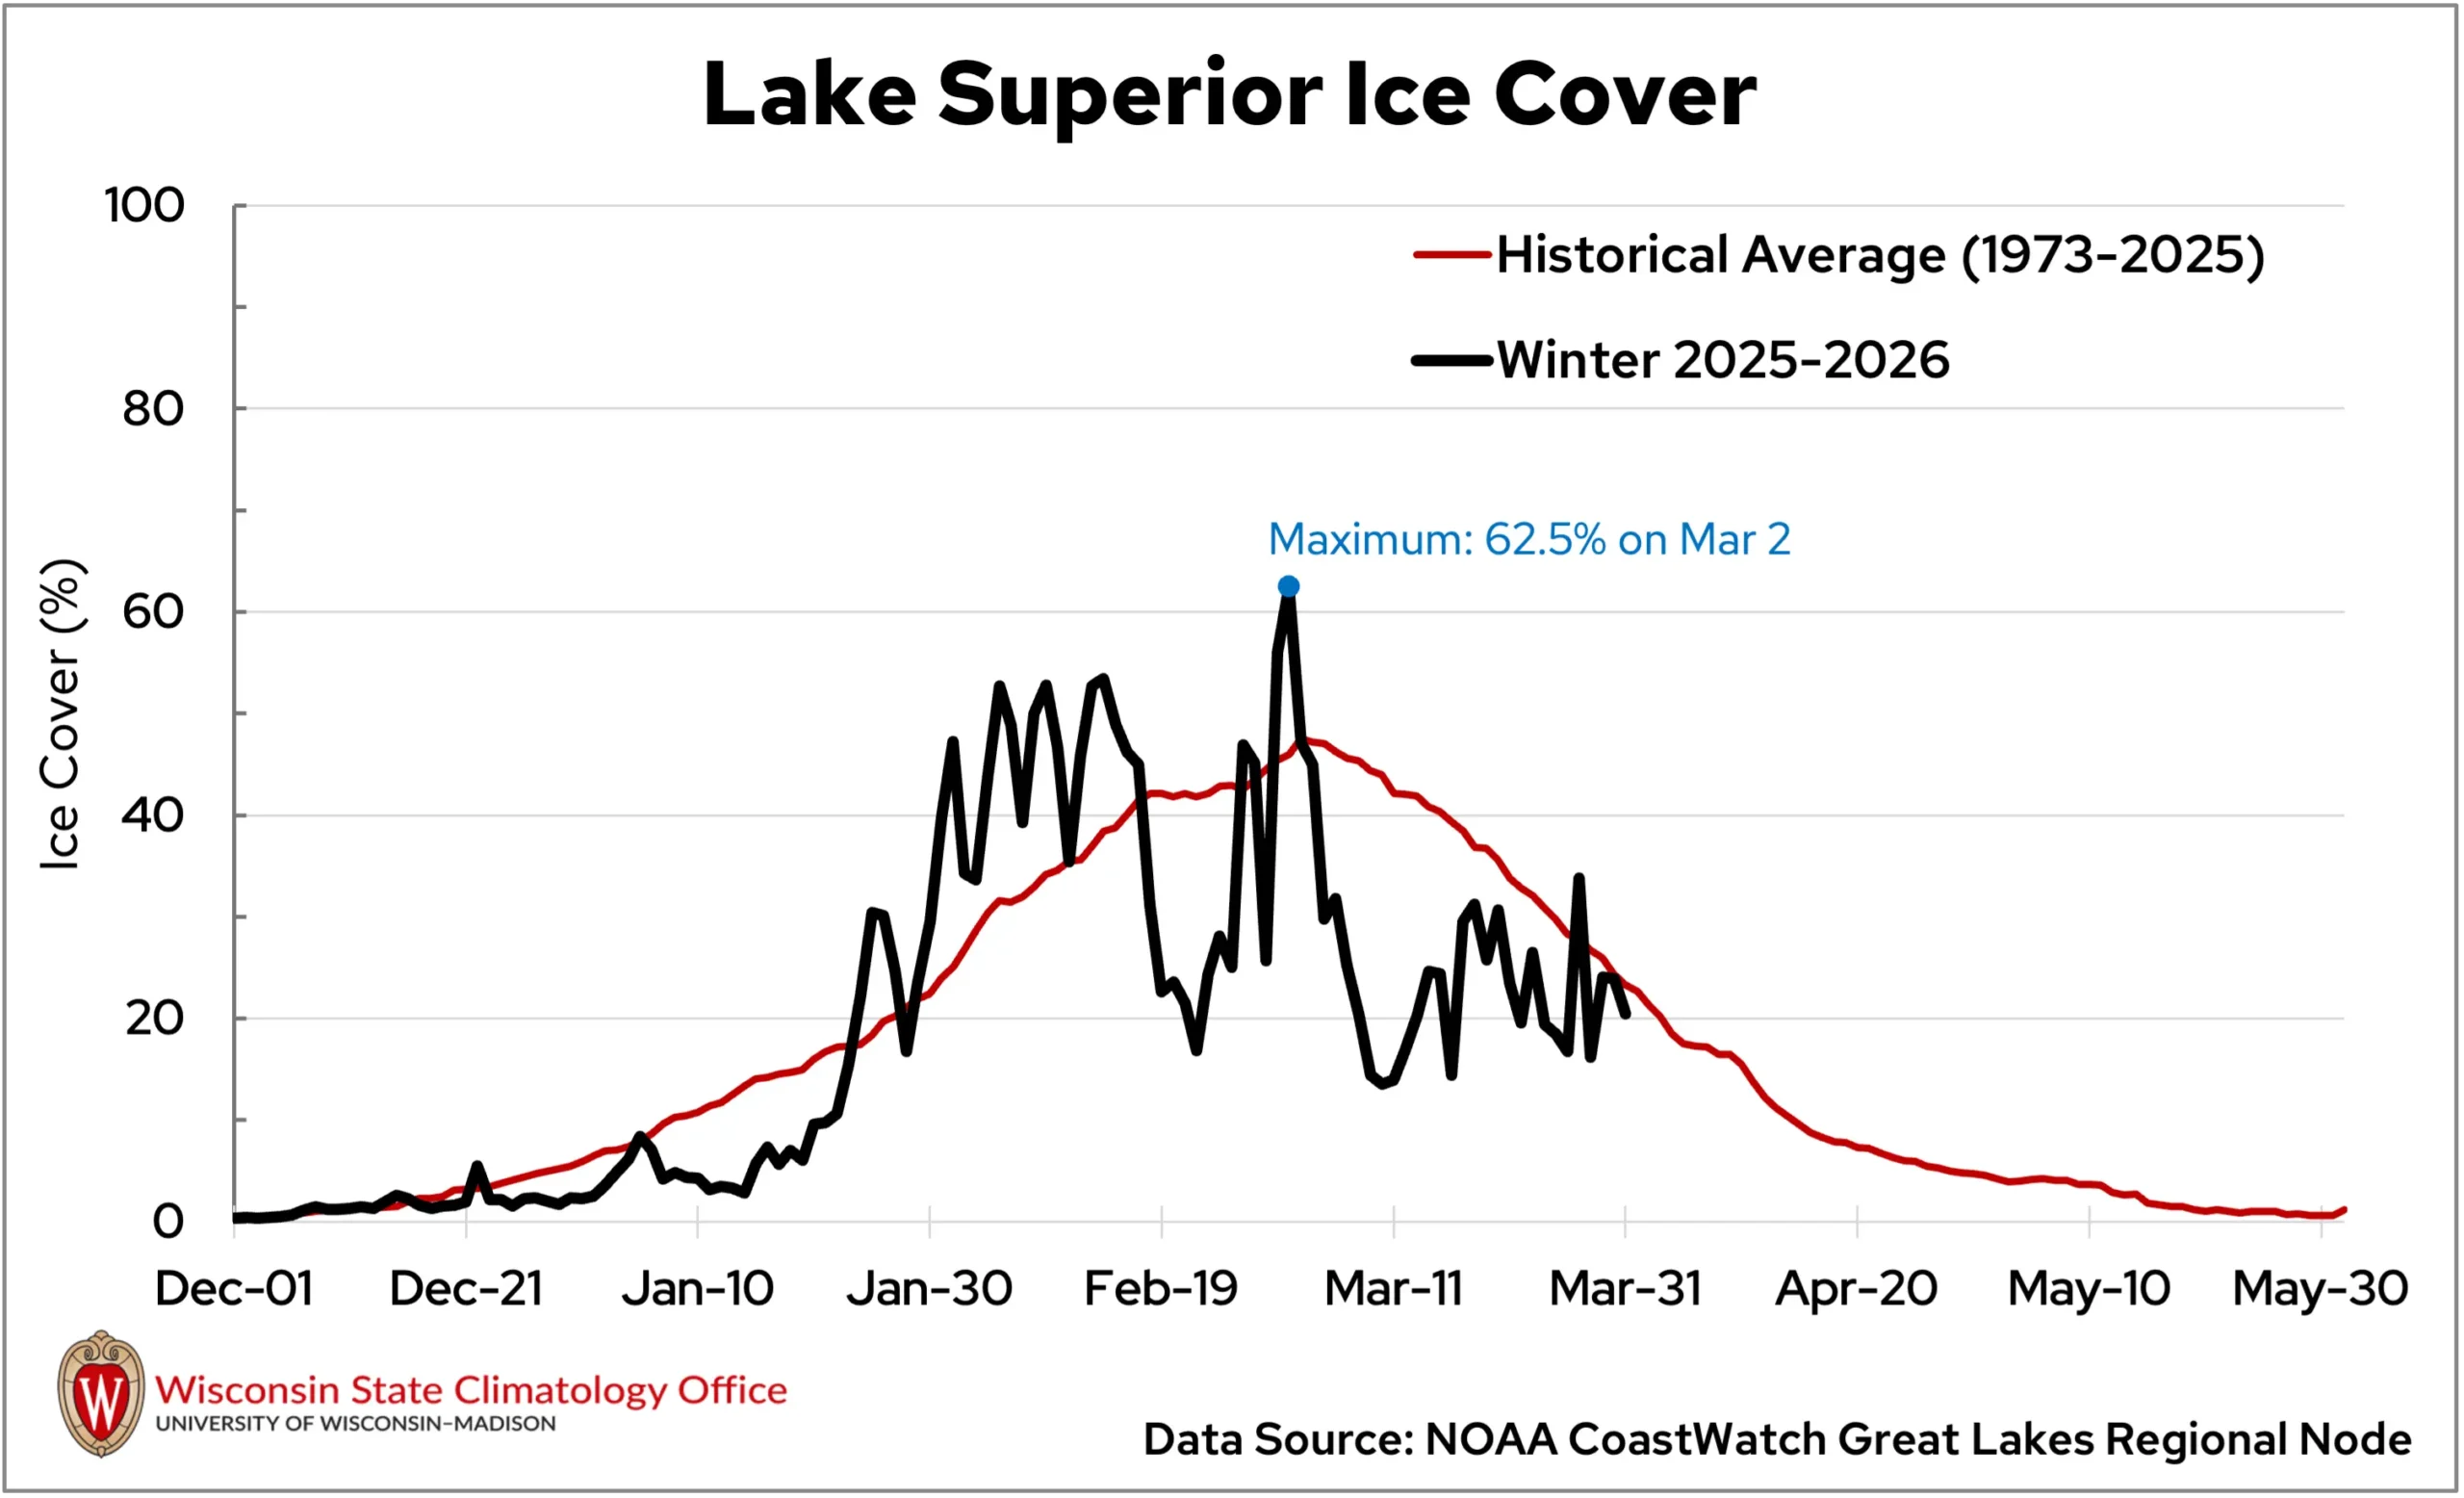
March brought a rapid transition from winter ice to open water. A brief cooldown around the start of the month allowed ice to hang on a little longer, even helping Lake Superior reach its seasonal ice peak of 63 percent on March 2. But persistent warmth quickly took over, reducing Lake Superior ice cover to 14 percent by March 10, the lowest extent since January 22 (Figure 10).
In southern Wisconsin, Lake Wingra opened on March 7, Lake Monona on March 11, and Lake Mendota on March 13. All Madison-area lakes ended their lake-ice season earlier than average, with Wingra among one of its shortest ice seasons on record (Table 1).
| Lake | Ice-Off Date | 2025-26 Ice Duration | Comparison |
|---|---|---|---|
| Wingra | March 7 | 96 days | 11th shortest of 75 seasons |
| Monona | March 11 | 89 days | Tied 37th shortest of 171 seasons |
| Mendota | March 13 | 71 days | 15th shortest of 171 seasons |
The mid-month cold snap briefly rebuilt ice across parts of the state and Great Lakes before late-month warmth resumed the seasonal decline.
Wild Ride for Agriculture
March proved to be a wild ride for Wisconsin agriculture.
Early in the month, warming temperatures thawed the deep soil frost left by January’s brutal cold, fueling tremendous early-month maple sap flow.
However, the warm spell around March 9 slowed production, only to be followed by the mid-month blizzard, which brought sub-zero nights and deep snow that froze some tap lines, insulated soils, and made reaching taps difficult.
Just days later, the ideal combination of daytime warmth and nighttime freezes revived sap flow, keeping producers busy.
The blizzard also made peak calving season challenging, with newborn livestock at risk of hypothermia and ranchers struggling to locate calves in the whiteout conditions.
Wisconsin’s dairy sector faced added strain as storm impacts disrupted animal health, feed supplies, transportation, and daily milk production, prompting USDA recovery assistance for affected producers.
Row crop planting plans were halted by the blizzard and slowed by scattered showers and thunderstorms, but a few warm, dry breaks still allowed farmers to prep fields. Some producers even experimented with early soybean planting. The precipitation also provided some much-needed soil moisture.
For perennial fruit crops, the combination of early warmth, a sharp mid-month cold snap, and strong blizzard winds likely increased stress on vulnerable buds and branches. Even so, chilling hour totals surpassed one thousand hours by the end of the month, meaning many fruit crops met the temperature thresholds needed to signal the end of winter dormancy. Early flowers also began emerging, offering the first visible hints of spring.
Climate Corner
As spring arrives with longer daylight hours, milder temperatures, and less snow on the ground, gardeners and farmers across Wisconsin are itching to get planting.
The growing season is the time of year when plants tend to thrive; however, recent changes in the growing season have created new challenges. Read more in this month’s Climate Ed-ucation blog, “How Longer Growing Seasons Are Reshaping Wisconsin’s Gardens and Farms.”
Climate Stats by Division
Temperature (degrees Fahrenheit)
Color Key
-
Dark blue: Record coolest
-
Royal blue: Bottom ⅒
-
Light blue: Bottom ⅓
-
White: Normal
-
Light orange: Top ⅓
-
Orange: Top ⅒
-
Red: Record warmest
| Division | Avg | Dept |
|---|---|---|
| Northwest | 32.4Top ⅓ | 4.1Top ⅓ |
| North Central | 31.1 :Top ⅓ | 3.6 :Top ⅓ |
| Northeast | 31.7 :Top ⅓ | 3.2:Top ⅓ |
| West Central | 36.6 :Top ⅓ | 5.0:Top ⅓ |
| Central | 36.5 :Top ⅓ | 4.8:Top ⅓ |
| East Central | 35.5 :Top ⅓ | 3.9:Top ⅓ |
| Southwest | 38.5 :Top ⅓ | 4.4:Top ⅓ |
| South Central | 38.8 :NTop ⅓ | 4.7:Top ⅓ |
| Southeast | 38.2 :Top ⅓ | 3.9:Top ⅓ |
| State | 34.7 :Top ⅓ | 4.2:Top ⅓ |
Snowfall (inches)
Color Key
-
Purple: Below Normal
-
White: Normal
-
Beige: Above Normal
| Division | Avg | Dept |
|---|---|---|
| Northwest | 17.1Above Normal | 7.6Above Normal |
| North Central | 24.8:Above Normal | 13.7:Above Normal |
| Northeast | 32.9:Above Normal | 23.6:Above Normal |
| West Central | 12.1:Above Normal | 4.3:Above Normal |
| Central | 18.1:Above Normal | 10.9:Above Normal |
| East Central | 19.2:Above Normal | 12.5:Above Normal |
| Southwest | 9.0:AboveNormal | 3.4:Above Normal |
| South Central | 9.6:AboveNormal | 4.4:Above Normal |
| Southeast | 7.1:Above Normal | 1.8:Above Normal |
| State | 18.2:Above Normal | 10.1:Above Normal |
Liquid-Equivalent Precipitation (Inches)
Color Key
-
Dark brown: Record driest
-
Light brown: Bottom ⅒
-
Beige: Bottom ⅓
-
White: Normal
-
Light green: Top ⅓
-
Green: Top ⅒
-
Dark green: Record wettest
| March 2026 | Since Nov. 1, 2025 | |||
|---|---|---|---|---|
| Division | Avg | Dept | Avg | Dept |
| Northwest | 1.61: Normal | -0.02: Normal | 6.12: Normal | -0.56: Normal |
| North Central | 2.35: Top ⅓ | 0.63: Top ⅓ | 8.40: Top ⅓ | 0.92: Top ⅓ |
| Northeast | 3.27: Top ⅒ | 1.55: Top ⅒ | 9.67: Top ⅓ | 2.12: Top ⅓ |
| West Central | 2.27 : Top ⅓ | 0.44: Top ⅓ | 6.91: Normal | -0.21: Normal |
| Central | 2.70: Top ⅓ | 0.81: Top ⅓ | 8.25: Top ⅓ | 0.63: Top ⅓ |
| East Central | 2.97: Top ⅓ | 1.11: Top ⅓ | 8.50: Normal | 0.23: Normal |
| Southwest | 2.67: Top ⅓ | 0.59: Top ⅓ | 7.31: Normal | -1.07: Normal |
| South Central | 2.83:Top ⅓ | 0.76: Top ⅓ | 7.27: Normal | -1.64: Normal |
| Southeast | 3.53: Top ⅓ | 1.48: Top ⅓ | 8.73 Normal | -0.66 Normal |
| State | 2.53: Top ⅓ | 0.71 Top ⅓ | 7.77 Normal | 0.09 Normal |
Monthly, seasonal, and annual temperature and precipitation values and rankings published in this report are from NOAA’s National Centers for Environmental Information at the time of posting this climate summary. Values and rankings can change after publishing our climate summaries. To check the most recent values and rankings, visit NOAA’s National Centers for Environmental Information Climate at a Glance Tool.
This report is a product of the Wisconsin State Climatology Office. For questions and comments, please contact us by email (stclim@aos.wisc.edu) or phone (608-263-2374).