April was an active and impactful month across Wisconsin, featuring temperature extremes, record precipitation, severe weather outbreaks, and agricultural disruption.
- Sub-freezing lows to 80-degree highs
- Wettest April on record
- Completely drought-free by month’s end
From Parkas to T-Shirts
From frosty mornings to summerlike afternoons, April delivered another month of dramatic temperature swings in typical Wisconsin spring fashion (Figure 1).
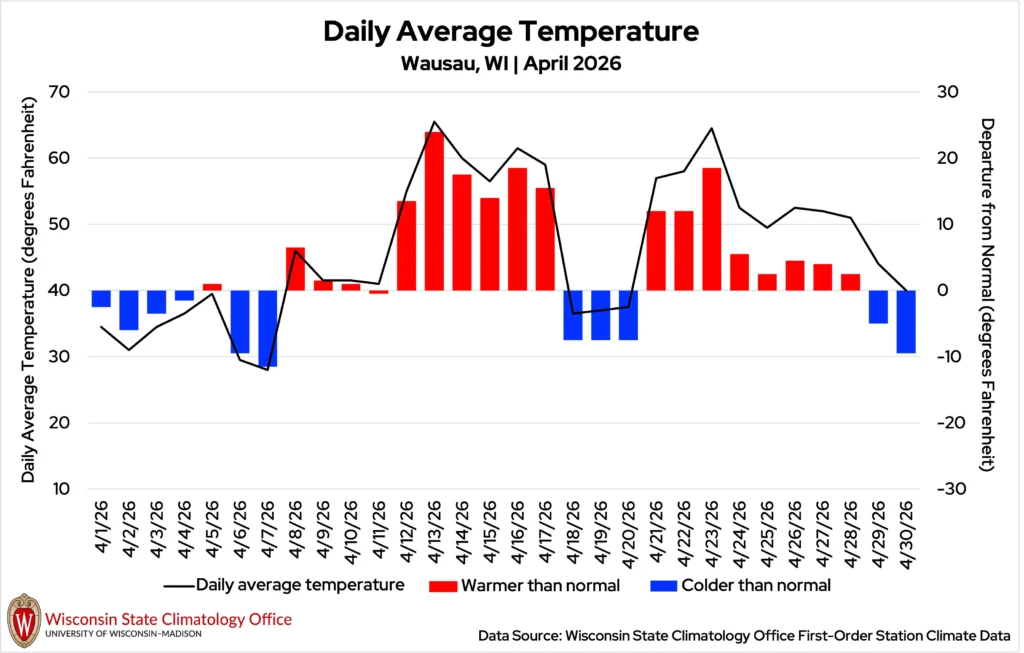
The month began on a chilly note, with the coldest air arriving on April 7. Temperatures dropped into the single digits across parts of north-central Wisconsin and into the teens across much of northern and central Wisconsin.
The coldest temperature of the month was a shocking 0.7 degrees at the Knight Wisconet station (Iron County), recorded on the 7th. Madison fell to 21 degrees that morning (12 degrees colder than the city’s normal low temperature for April 7), and Blanchardville (Lafayette and Iowa counties) dropped to 18 degrees.
Just days later, Wisconsin experienced a significant warm-up. Unseasonably warm and humid air spread across the state, helping fuel severe weather. Nearly two dozen stations recorded temperatures of 80 degrees or warmer. Eau Claire reached its first 80-degree day of the year on April 13. Milwaukee hit 80 degrees on April 14, which is 26 degrees warmer than the normal high for that date and more than two months ahead of when Brew City typically begins seeing 80-degree highs.
The warmth disappeared quickly, though, as temperatures once again dropped sharply. In Wausau, for example, the high temperature fell from 78 degrees on April 17 to a low of 32 degrees on April 18. Across much of the state, overnight lows dropped into the teens and 20s.
While the rapid cooldown felt dramatic after the summerlike warmth, the sub-freezing temperatures were not unusual. Wisconsin’s average last spring freeze typically occurs in late April across many southern counties and late May in the north.
Another warm spell returned during the final week of April. Nearly 100 occurrences of 80 degrees or warmer were recorded across much of central and southern Wisconsin. The warmest temperature of the month was 84 degrees in Sparta (Monroe County) on April 23.
Cooler-than-normal temperatures then returned during the final days of the month, ending the month as it started: on a chilly note.
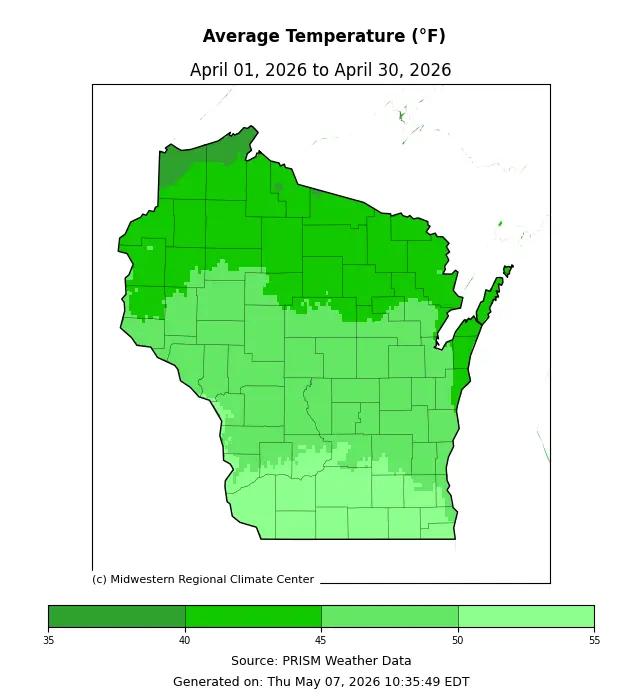
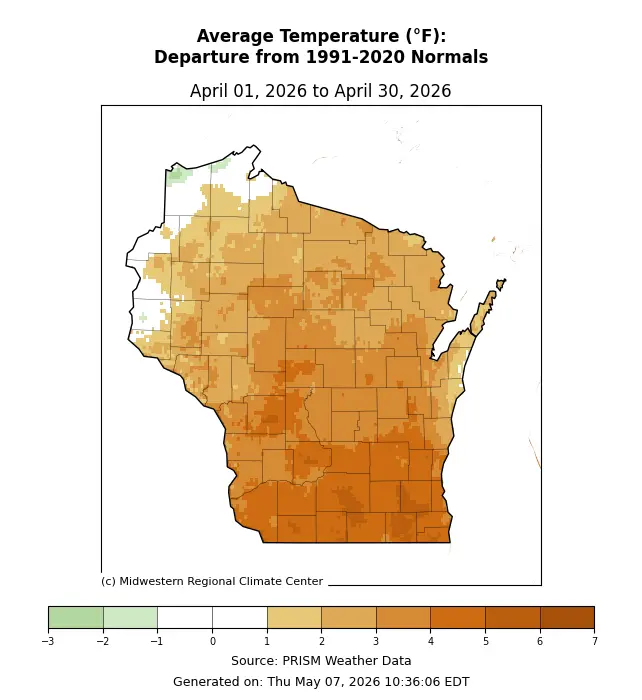
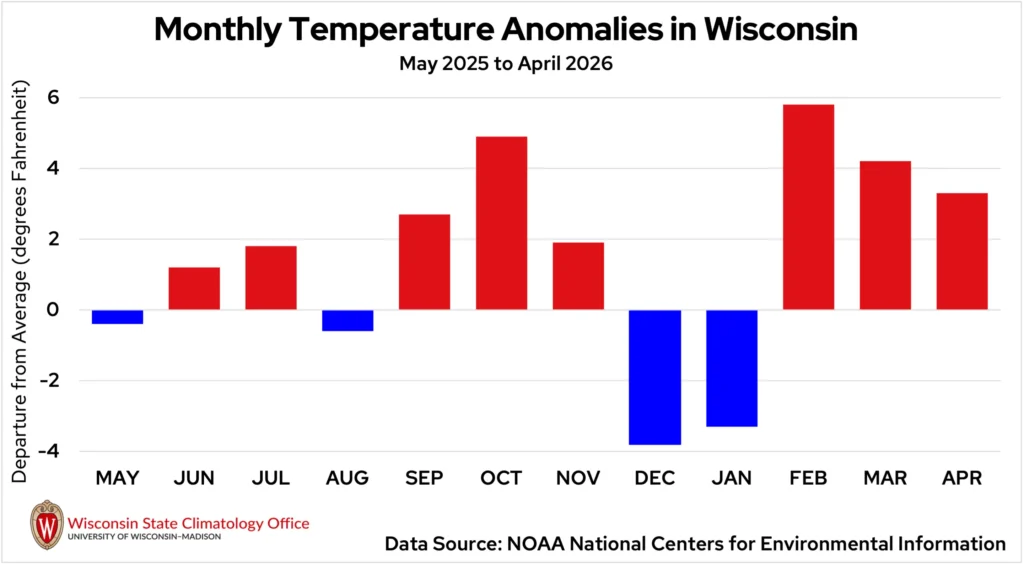
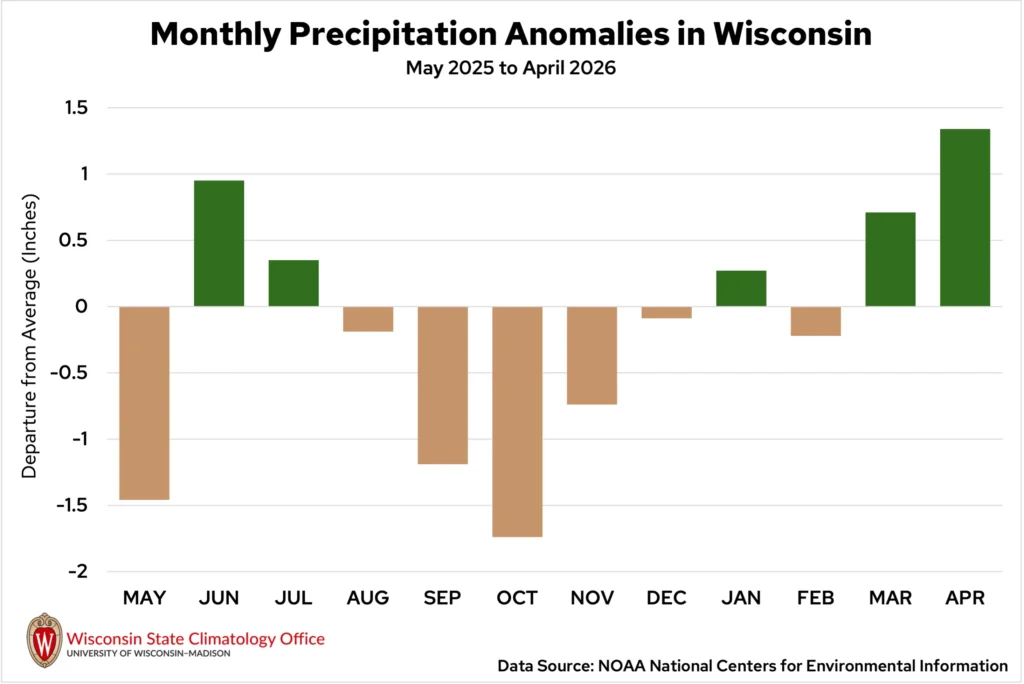
Overall, April averaged 46.4 degrees, 3.3 degrees warmer than normal, marking Wisconsin’s third month in a row that has been warmer-than-normal (Figures 2 and 3).
Wisconsin’s Wettest April
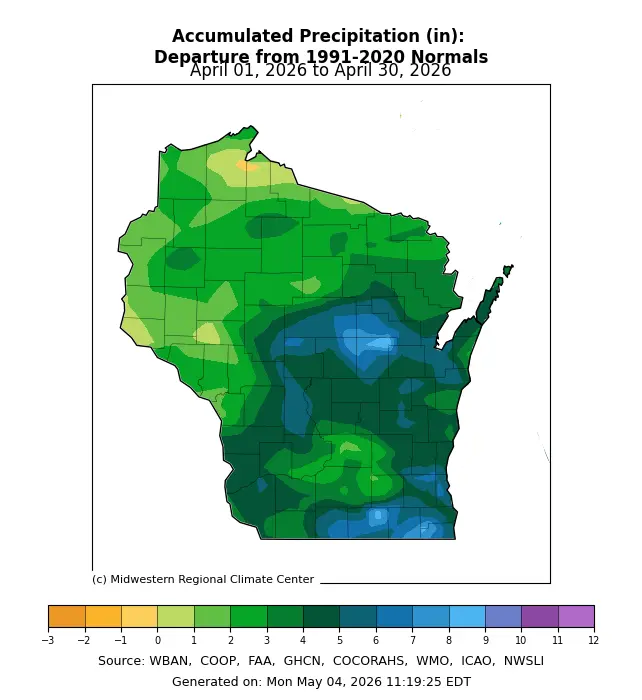
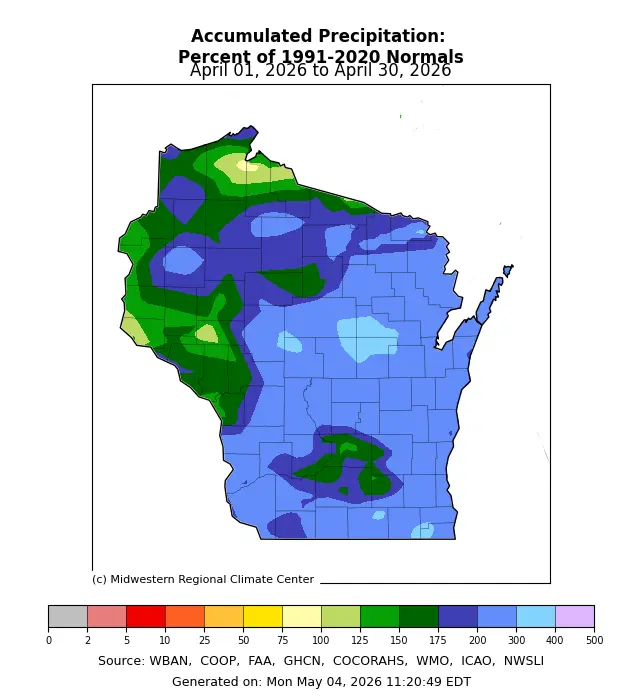
April 2026 will be remembered for its abundance of showers, though deluges may be a more accurate description. Downpour after downpour brought the statewide average precipitation total to a whopping 6.53 inches (Figures 4 and 5).
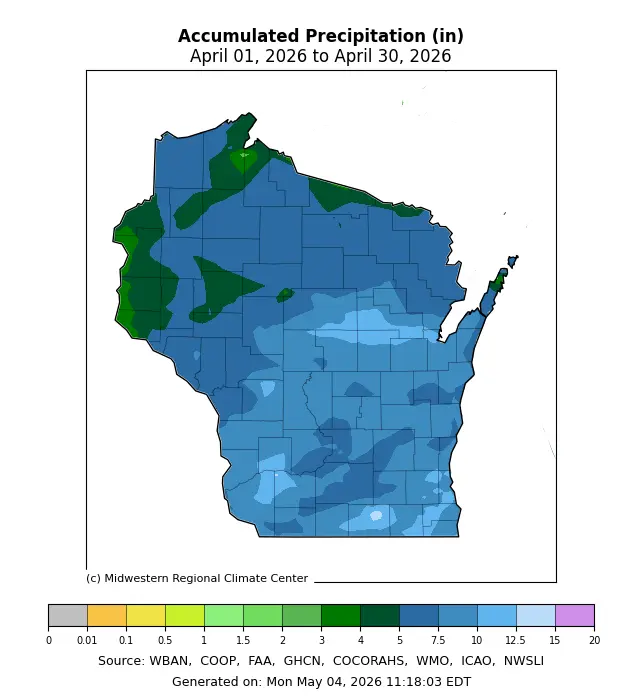
Previously, Wisconsin’s wettest April had an average total of 5.19 inches — 1.34 inches below the 2026 total. Reaching new state records is always significant, but surpassing a record by more than an inch is rare (Table 1).
| Wisconsin’s Wettest Aprils (Year) |
|---|
| 6.53 inches (2026) |
| 5.19 inches (2008) |
| 5.18 inches (1954) |
| 5.04 inches (2014) |
| 4.86 inches (2001) |
April’s warmth kept most of Wisconsin’s precipitation as rain rather than snow. The state’s sole April snowstorm arrived early in the month, dropping about a half-foot of snow in the far northern counties, and leaving a coating of ice through the western and central regions of the state.
Flooding concerns began on April 4, after multiple rounds of heavy rain brought two to three inches of water to western and east-central Wisconsin. Vehicles became stranded as streets flooded in parts of Brown County, and there were reports of overflowing creeks and water seeping into basements in Winnebago County. The Kickapoo River reached its major flood stage, forcing road closures in Vernon County.
Dry weather only lasted for a week before the firehose was pointed back at central Wisconsin.
Rounds of thunderstorms on April 12, 13, and 14 poured more than five inches of rain on parts of central Wisconsin, with some three-day totals exceeding six inches. A stationary front parked over the state was responsible for the relentless stretch of rainfall and storms.
As the rain fell, already high rivers continued to rise. In Waupaca County, many residents along the Pigeon River were forced to evacuate as water encroached on their homes. Residents along the Little Wolf River breathed a sigh of relief after emergency reinforcements prevented the Big Falls Dam from failing. In Brown County, floodwaters trapped vehicles and even washed out roadways.
As water flowed downstream, the Wolf River reached major flood stage on April 17, leading to severe flooding and prompting evacuations in New London (Outagamie and Waupaca counties).
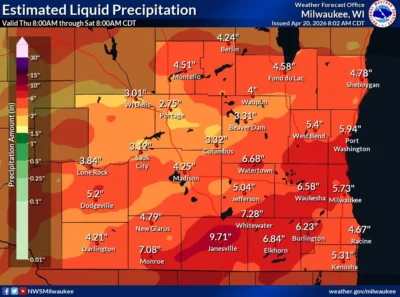
Attention shifted to southern Wisconsin on the evening of April 17, as potent thunderstorms flooded Rock County (Figure 6). Janesville was significantly impacted as areawide rain estimates neared 10 inches — easily surpassing the area’s two-day threshold for a 100-year rainfall of 7.44 inches. Roadways and train tracks were washed out in the city, and damage to an elementary school forced its closure for the remainder of the school year.
In addition to being the state’s wettest April, many cities also recorded their wettest April on record and set numerous daily rainfall records (Table 2). Wausau received 8.74 inches of precipitation through the month, breaking the city’s previous April record from 1954 by more than two inches. Milwaukee surpassed its April 2013 record by more than two inches with a monthly total of 9.49 inches, also making it the city’s sixth wettest month overall. At 8.56 inches, Green Bay topped 1929 to become both the city’s wettest April and the seventh wettest month on record. Madison’s monthly total of 7.26 inches broke the capital city’s April 1909 record of 7.19 inches.
| Location | Date | 2026 Daily Precipitation | Previous Record (Year) |
|---|---|---|---|
| Green Bay | April 2 | 1.61 inches | 0.96 inches (2024) |
| Madison | April 2 | 1.34 inches | 1.31 inches (2024) |
| La Crosse | April 2 | 1.12 inches | 1.09 inches (1940) |
| Green Bay | April 12 | 1.03 inches | 0.85 inches (1900) |
| Wausau | April 13 | 2.13 inches | 0.80 inches (1955) |
| Green Bay | April 13 | 1.82 inches | 1.53 inches (2018) |
| Madison | April 14 | 1.53 inches | 0.97 inches (1974) |
| La Crosse | April 14 | 0.85 inches | 0.77 inches (1896) |
Slew of Destructive Storms
Strong thunderstorms accompanied the heavy rain that fell across the state during April. The National Weather Service offices issued 281 tornado and severe thunderstorm warnings in Wisconsin during April. This is not only the most issued during April, but the most in a single month in the state since records of warnings began in 1986.
The majority of the month’s severe weather hit the state in one week.
On the evening of April 13, severe storms brought damaging winds to Wisconsin’s southern counties and large hail to central counties. The worst wind damage was reported between Dane and Milwaukee County. The roof of a church was torn off, trees were toppled, and many homes were damaged. One tornado touched down in Taylor County.
The next day, another round of storms pummeled southern Wisconsin. Nine tornadoes tore roofs from homes, snapped trees, and destroyed barns and sheds. The strongest tornado, ranked an EF3, began near Hillsboro in Vernon County and spun through the village of Union Center in Juneau County. Numerous homes were significantly damaged, including one that was completely flattened by the storm. This was the first EF3 tornado to occur in Wisconsin since 2021.

Meanwhile, farther south, baseball-sized hail (three inches in diameter) battered Madison, smashing cars and denting house siding. A four-inch hailstone (softball-sized) that fell in the nearby village of Maple Bluff was the largest hailstone to be reported in Dane County since July 1960.
Storms returned on April 15, once again targeting southern Wisconsin. One man was struck and killed by lightning near Waukesha. One tornado touched down in Elkhorn (Walworth County).
Severe storm activity peaked on April 17 as a strong cold front sparked severe storms across both central and southern Wisconsin. There were 46 tornado warnings issued across the state — the most that Wisconsin’s National Weather Service offices have issued in a single day. Sixteen tornadoes ripped through the state, two of them producing estimated winds of 140 miles per hour. The most extensive damage was seen in the town of Ringle (Marathon County), where at least 75 homes were damaged, many of them flattened (Table 3).
April 2026 Tornadoes in Wisconsin
| Location | Date | Enhanced Fujita (EF) Rating | Estimated Maximum Winds | Damage Reported |
|---|---|---|---|---|
| Gilman (Taylor Co.) | April 13 | EF0 | 80 MPH | Trees broken and minor damage to outbuildings |
| Kansasville (Racine Co.) | April 14 | EF0 | 80 MPH | Tree damage, minor damage to outbuildings |
| Beaver Dam (Dodge Co.) | April 14 | EF0 | 85 MPH | |
| East Troy (Walworth Co.) | April 14 | EF1 | 100 MPH | Significant damage to barns, outbuildings, and trees |
| Waterford (Racine Co.) | April 14 | EF1 | 100 MPH | Trees damaged and thrown, barn lifted off its foundation |
| Somers (Kenosha Co.) | April 14 | EF1 | 105 MPH | |
| Rockdale (Dane Co.) | April 14 | EF1 | 105 MPH | Cement silo lifted, metal barns destroyed |
| Endeavor (Marquette Co.) | April 14 | EF1 | 109 MPH | |
| Sussex (Waukesha Co.) | April 14 | EF2 | 120 MPH | Significant damage to buildings |
| Union Center (Juneau Co.) | April 14 | EF3 | 140 MPH | Significant damage to a home, damage to trees and outbuildings |
| Elkhorn (Walworth Co.) | April 15 | EF1 | 100 MPH | Damage to barns |
| Waterford (Racine Co.) | April 17 | EF0 | 70 MPH | Some tree damage |
| Wind Lake (Racine Co.) | April 17 | EF0 | 70 MPH | Some tree damage |
| Honey Lake (Walworth & Racine Co.) | April 17 | EF0 | 75 MPH | Uprooted trees and minor damage to roofs |
| Raymond (Racine Co.) | April 17 | EF0 | 80 MPH | |
| La Prairie (Rock Co.) | April 17 | EF1 | 90 MPH | |
| Osseo (Trempeleau Co.) | April 17 | EF1 | 100 MPH | Widespread tree damage |
| Hatfield (Jackson Co.) | April 17 | EF1 | 100 MPH | Widespread tree damage |
| Emerald Grove (Rock Co.) | April 17 | EF1 | 100 MPH | Damage to trees and agricultural equipment |
| Richmond (Rock Co.) | April 17 | EF1 | 100 MPH | Damage to sheet metal sheds |
| Delavan (Walworth Co.) | April 17 | EF1 | 100 MPH | Widespread tree damage and silo blown over |
| Delavan (Walworth Co.) | April 17 | EF1 | 100 MPH | Damage to barns and a home |
| Kneeland (Racine Co.) | April 17 | EF1 | 100 MPH | |
| Blair (Trempeleau Co.) | April 17 | EF1 | 110 MPH | |
| Glandon (Marathon Co.) | April 17 | EF1 | 110 MPH | Significant damage to a barn and outbuilding |
| Cream (Buffalo Co.) | April 17 | EF3 | 140 MPH | Significant damage to a home, widespread damage to trees, and outbuildings |
| Ringle (Marathon Co.) | April 17 | EF3 | 145 MPH | Extensive damage to numerous homes |
A total of 27 tornadoes occurred in Wisconsin during April. Based on the 30-year average, only one tornado typically touches down in the Badger State in April. This makes 2026 by far the most tornadic April in the state since records began in 1950.
The month also tied as the state’s second-most-tornadic month overall, falling behind June 2005, when 30 tornadoes occurred. Based on the 30-year average, 23 tornadoes typically touch down in Wisconsin in a year.
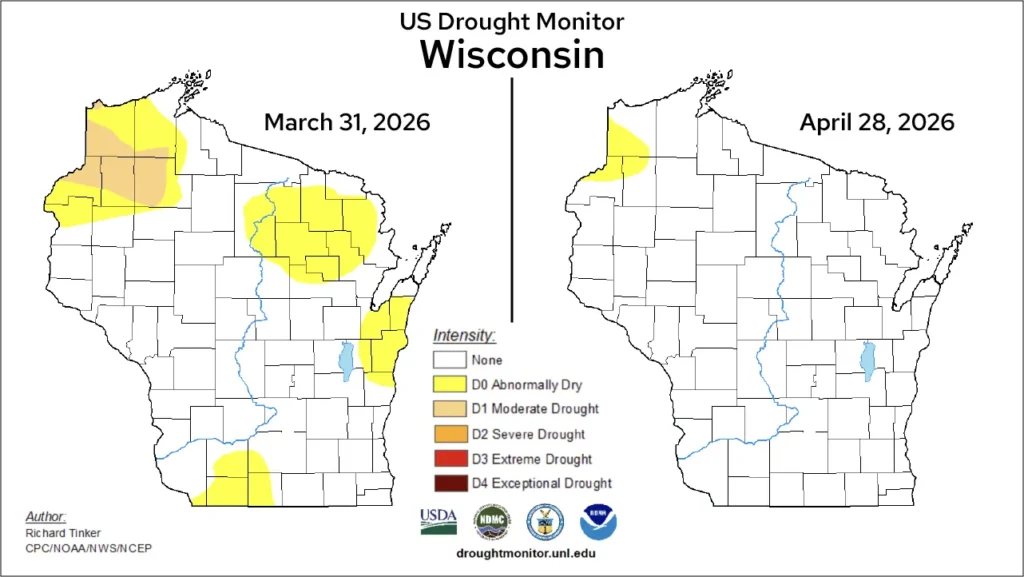
Drought Erased
It’s no surprise that April’s abundance of rain alleviated all drought conditions in Wisconsin. The month began with some areas of abnormal dryness in parts of southern and eastern counties, along with a small area of moderate drought (D1) in the northwest. By the end of the month, only a sliver of abnormally dry conditions remained in parts of Douglas, Burnett, and Washburn counties (Figure 7).
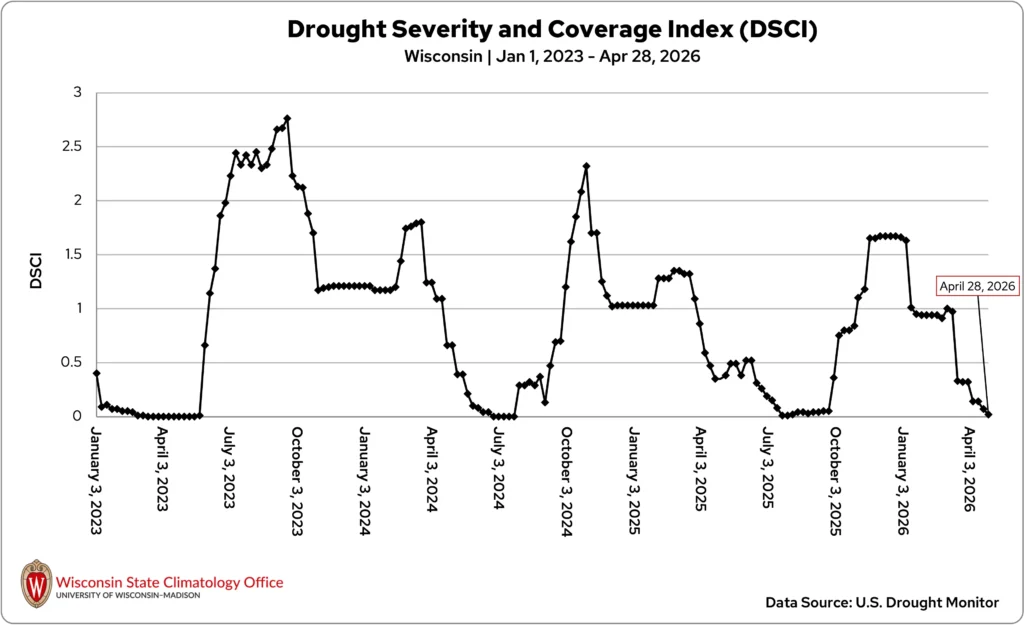
The state’s Drought Severity and Coverage Index was nearly zero by the end of the month — a low not seen since Wisconsin was last drought-free in September 2025 (Figure 8). This comes amid the most expansive spring drought on record for the Lower 48 states. As of April 28, Wisconsin was one of just four states that were completely drought-free.
Flooded Fields & Frost Concerns
Highly variable weather throughout April created several challenges for Wisconsin agriculture.
Early in the month, an ice storm brought freezing rain to parts of western Wisconsin, coating tree limbs — some with newly emerging buds — and downing branches.
Mid-month severe storms damaged farm infrastructure, including barns, silos, and outbuildings, and strong winds flattened some hay, alfalfa, and cover crop fields. Heavy rain also led to waterlogged soils and areas of erosion, delaying spring fieldwork and planting. However, the rain helped replenish soil moisture and relieve the state from drought, which is a huge relief for farmers heading into the growing season.
By late April, warm, dry, and windy conditions allowed farmers across southern Wisconsin to make progress in fieldwork and planting. Farther north, however, colder conditions kept most farmers from planting by month’s end.
The month’s rapid temperature swings also raised concerns for fruit growers and perennial crops. Unseasonably warm weather throughout most of March and parts of April encouraged plants to break dormancy, or “wake up,” by mid-to-late April across parts of southern and central Wisconsin, while vegetation in northern Wisconsin remained dormant.
Once active growth began, these plants and crops became more vulnerable to damage when sub-freezing temperatures returned, especially in the second half of April. By the third weekend of April, some fruit growers had begun taking action to protect their trees from frost. In Door County, cherry trees reportedly began flowering around April 29, increasing concern about potential freeze damage heading into early May.
Early Start to Tick Season
Early-season tick activity in Wisconsin also began sooner than normal, with reports of tick bites increasing earlier this spring compared to recent years. This early emergence is likely linked to the combination of warmer-than-normal conditions throughout March and parts of April, along with a very wet April that supported favorable environmental conditions for tick activity.
Climate Stats by Division: April 2026
Temperature (degrees Fahrenheit)
Color Key
-
Dark blue: Record coolest
-
Royal blue: Bottom ⅒
-
Light blue: Bottom ⅓
-
White: Normal
-
Light orange: Top ⅓
-
Orange: Top ⅒
-
Red: Record warmest
| Division | Avg | Dept |
|---|---|---|
| Northwest | 43.2Top ⅓ | 1.9Top ⅓ |
| North Central | 43.4 :Top ⅓ | 3.0 :Top ⅓ |
| Northeast | 43.5: Top ⅓ | 2.6:Top ⅓ |
| West Central | 47.6: Top ⅓ | 2.8:Top ⅓ |
| Central | 48.8: Top ⅒ | 4.6:Top ⅒ |
| East Central | 46.5: Top ⅓ | 3.2:Top ⅓ |
| Southwest | 50.6: Top ⅓ | 4.3:Top ⅓ |
| South Central | 51.7: Top ⅒ | 5.6:Top ⅒ |
| Southeast | 50.4: Top ⅒ | 5.0:Top ⅒ |
| State | 46.4: Top ⅓ | 3.3:Top ⅓ |
Snowfall (inches)
Color Key
-
Purple: Below Normal
-
White: Normal
-
Beige: Above Normal
| Division | Avg | Dept |
|---|---|---|
| Northwest | 2.6Below Normal | -2.2Below Normal |
| North Central | 2.2:Below Normal | -4.5:Below Normal |
| Northeast | 1.3:Below Normal | -4.9:Below Normal |
| West Central | 0.1:Below Normal | -3.1:Below Normal |
| Central | 0.0:Below Normal | -3.5:Below Normal |
| East Central | 0.0:Below Normal | -3.0:Below Normal |
| Southwest | 0.0:BelowNormal | -1.9:Below Normal |
| South Central | 0.0:BelowNormal | -1.5:Below Normal |
| Southeast | 0.0:Below Normal | -1.7:Below Normal |
| State | 1.1:Below Normal | -3.1:Below Normal |
Liquid-Equivalent Precipitation (Inches)
Color Key
-
Dark brown: Record driest
-
Light brown: Bottom ⅒
-
Beige: Bottom ⅓
-
White: Normal
-
Light green: Top ⅓
-
Green: Top ⅒
-
Dark green: Record wettest
| April 2026 | Since Nov. 1, 2025 | |||
|---|---|---|---|---|
| Division | Avg | Dept | Avg | Dept |
| Northwest | 4.79: Top ⅒ | 1.98: Top ⅒ | 6.12: Top ⅓ | -0.56: Top ⅓ |
| North Central | 5.85: Record | 2.93: Record | 8.40: Top ⅒ | 0.92: Top ⅒ |
| Northeast | 6.66: Record | 3.76: Record | 9.67: Record | 2.12: Record |
| West Central | 5.29 : Top ⅒ | 1.96: Top ⅒ | 6.91: Top ⅓ | -0.21: Top ⅓ |
| Central | 8.26: Record | 4.91: Record | 8.25: Top ⅒ | 0.63: Top ⅒ |
| East Central | 7.81: Record | 4.64: Record | 8.50: Top ⅒ | 0.23: Top ⅒ |
| Southwest | 7.72: Record | 3.88: Record | 7.31: Top ⅒ | -1.07: Top ⅒ |
| South Central | 7.33:Record | 3.68: Record | 7.27: Top ⅓ | -1.64: Top ⅓ |
| Southeast | 8.93: Record | 5.26: Record | 8.73 Top ⅒ | -0.66 Top ⅒ |
| State | 6.53: Record | 3.33 Record | 7.77 Top ⅒ | 0.09 Top ⅒ |
Monthly, seasonal, and annual temperature and precipitation values and rankings published in this report are from NOAA’s National Centers for Environmental Information at the time of posting this climate summary. Values and rankings can change after publishing our climate summaries. To check the most recent values and rankings, visit NOAA’s National Centers for Environmental Information Climate at a Glance Tool.
This report is a product of the Wisconsin State Climatology Office. For questions and comments, please contact us by email (stclim@aos.wisc.edu) or phone (608-263-2374).