Following a dramatic start to spring that included a historic blizzard, record-setting rainfall, and severe weather, May featured stark changes. Wisconsin rapidly shifted to extreme dryness, early summer heat, and quieter weather.
- Frost risk to 90-degree heat
- Tied as Wisconsin’s fourth driest May
- Dry conditions returned
Chilly Start to Warm Finish
May was another month of noticeable temperature swings in Wisconsin, beginning with a taste of late winter and ending with a preview of summer.
The first half of May was notably chilly, with statewide temperatures averaging nearly five degrees below normal between May 1 and 15. Widespread freezes affected much of the state on multiple mornings, with temperatures dipping as low as 20 degrees the morning of May 2 in Rhinelander (Oneida County) and Eagle River (Vilas County).
Several locations also challenged or tied daily temperature records, including Rhinelander, which set a new daily record low of 21 degrees on May 11.
Following this early-month cold snap, the 32-degree freeze season came to a close across Wisconsin’s six first-order stations. In Wausau and Eau Claire, this was exactly in line with the 1950 to 2025 average. In Madison, Green Bay, and La Crosse, the last freezes were a few days later than average. Conversely, Milwaukee saw its last freeze a full week earlier than average (Table 1).
| Location | 2026 Last Freeze | Average Last Freeze (1950-2025) | Latest Last Freeze (1950-2025) |
|---|---|---|---|
| Milwaukee | April 20 | April 27 | May 31 |
| Madison | May 7 | May 2 | June 1 |
| La Crosse | May 7 | May 3 | May 30 |
| Green Bay | May 11 | May 7 | May 30 |
| Eau Claire | May 11 | May 11 | June 12 |
| Wausau | May 11 | May 11 | June 12 |
By mid-month, however, the script was flipped. Temperatures surged to an average of 3.5 degrees warmer than normal across the state. The contrast was especially striking in the final week of May, when over 40 stations reached 90 degrees. Many of these 90-degree readings occurred on May 26 across central and northern Wisconsin, which is earlier than normal for most locations (Table 2).
| Location | First 90°F Temperature of 2026 | Average First 90°F Temperature (1991-2020) |
|---|---|---|
| Milwaukee | Did not yet reach 90°F | June 13 |
| Madison | Did not yet reach 90°F | June 26 |
| La Crosse | May 26 | May 26 |
| Green Bay | May 26 | June 30 |
| Eau Claire | May 26 | June 6 |
| Wausau | May 26 | June 26 |
The warmest temperature observed was a warm 92 degrees, recorded in multiple locations, including Black River Falls (Jackson County) and the Wautoma Municipal Airport (Waushara County) on May 26.
However, even though we saw some incredibly warm days in the latter half of the month, the nighttime temperatures continued to remain generally low. Frost advisories were issued for parts of the state around May 19 and 20, and Ashland (Ashland County) even tied its daily record low temperature of 27 degrees on May 21. Through the last week of the month, areas in northern Wisconsin and even along the Door Peninsula recorded low temperatures in the thirties.
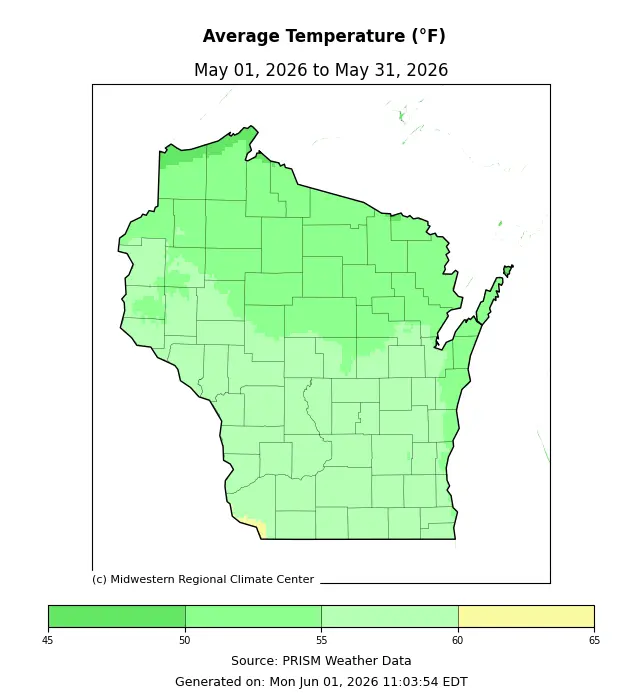
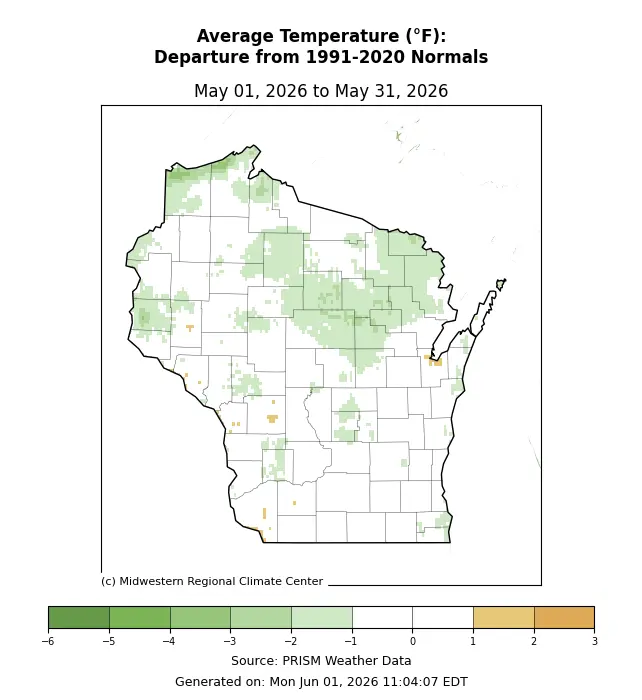
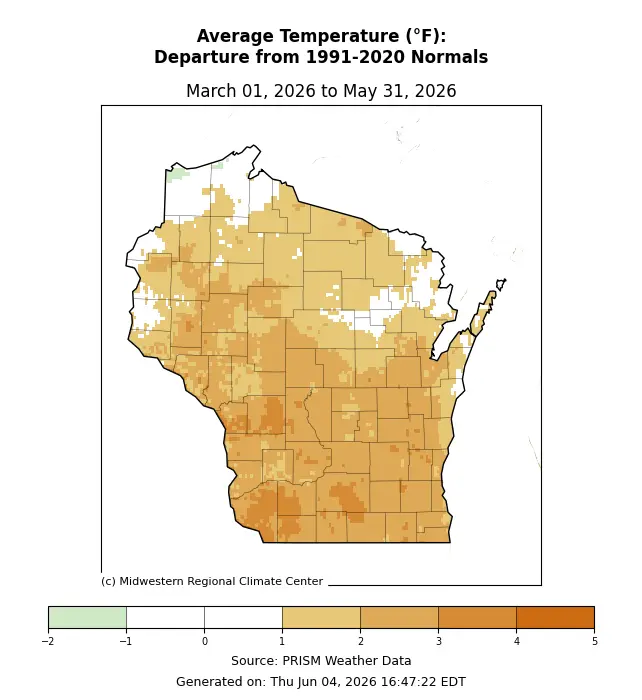
Despite the dramatic ups and downs, Wisconsin’s average temperature for May was 54.9 degrees, just a half a degree below normal (Figures 1 and 2).
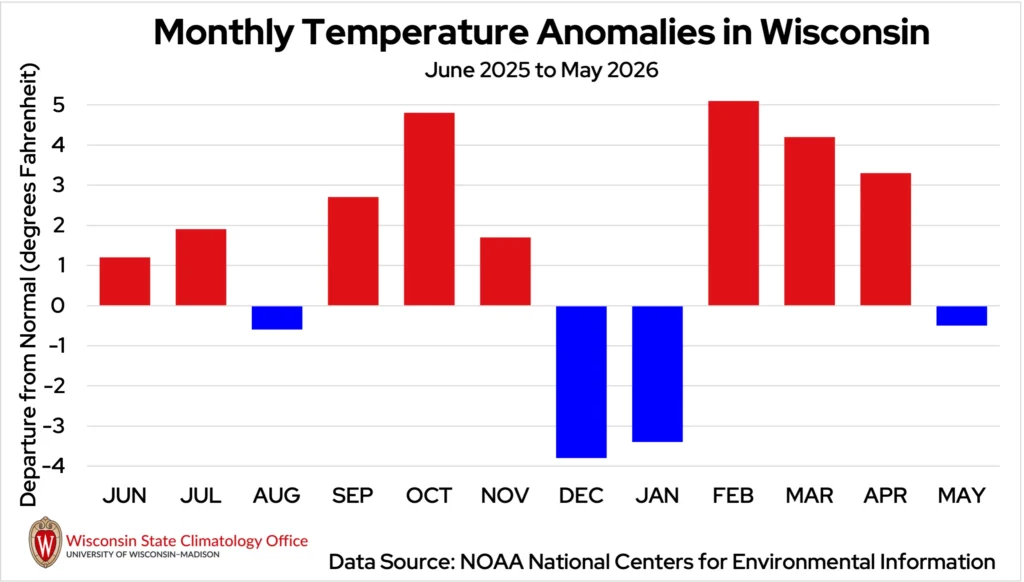
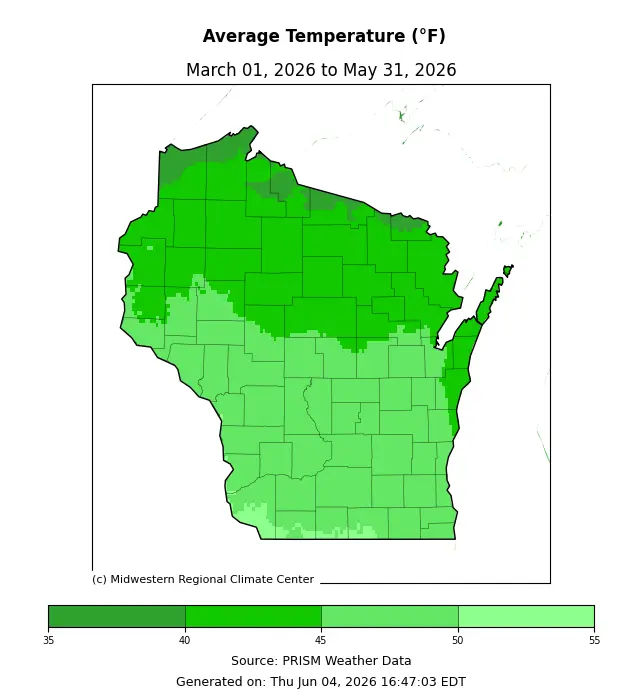
Spring as a whole averaged 45.3 degrees — 2.3 degrees warmer than normal — tying 2016 for the eighteenth warmest spring in 132 years. While the season ultimately finished on the warm side, it was far from steady. Large temperature swings occurred during each month, including a remarkable cold snap in mid-March and summerlike heat in April and May (Figure 3).
Precipitation Ping-Pong
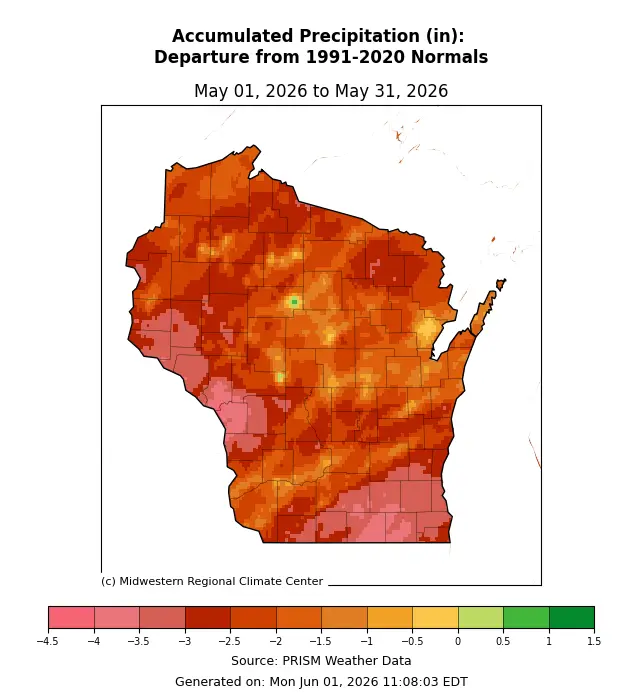
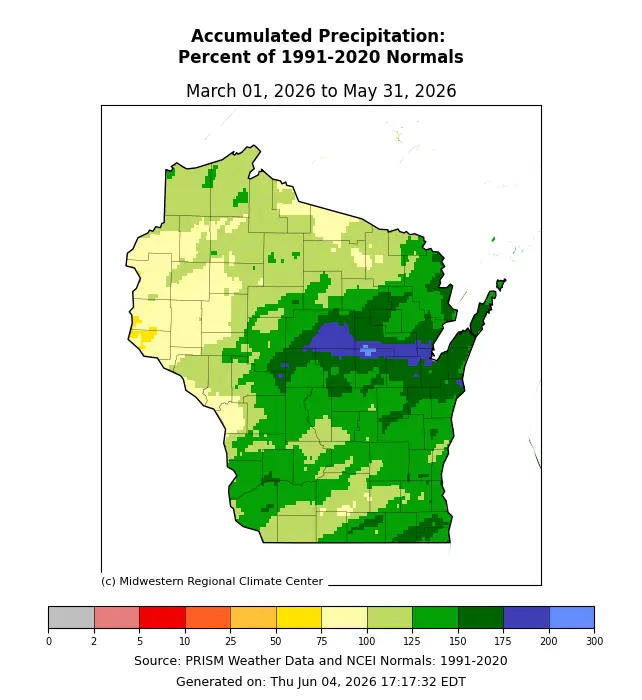
After experiencing its wettest April on record, Wisconsin flipped to one of its driest Mays ever observed. The state averaged only 1.61 inches of precipitation the whole month — 2.32 inches below normal — tied with 2023 as Wisconsin’s fourth driest May on record (Figure 4).
Milwaukee experienced perhaps the most remarkable turnaround. Following its wettest April on record with 9.49 inches of precipitation, Brew City received only 0.36 inches throughout the entire month, setting a new record for its driest May. The previous May record of 0.41 inches had stood since 1885.
This is such an incredible feat that, in examining the records at each of Wisconsin’s six first-order stations going back to the early 1900s, there is no previous occurrence of a record-wet month immediately followed by a record-dry month or vice versa.
Janesville (at the Wastewater Treatment Plant in Rock County) had a similar turnaround, from a record April high of 10.55 inches to a record-low 0.47 inches in May.
The dryness was not limited to southern Wisconsin. Much of the state saw little rainfall during the month. The La Crosse Regional Airport and the Chippewa Valley Regional Airport recorded their fourth and seventh driest Mays on record, respectively.
Large patches across southeastern, west-central, and northeastern Wisconsin saw less than 25 percent of their normal May precipitation. Much of the rest of the state received between 25 and 75 percent of normal (Figure 5).
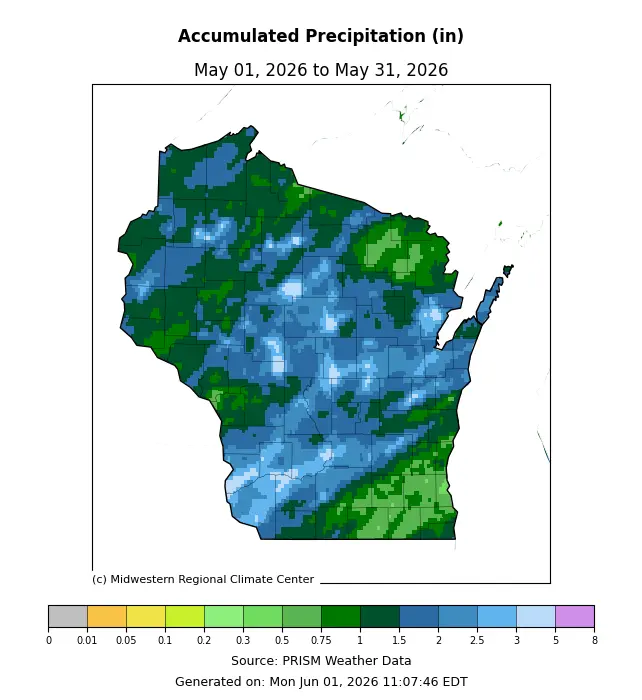
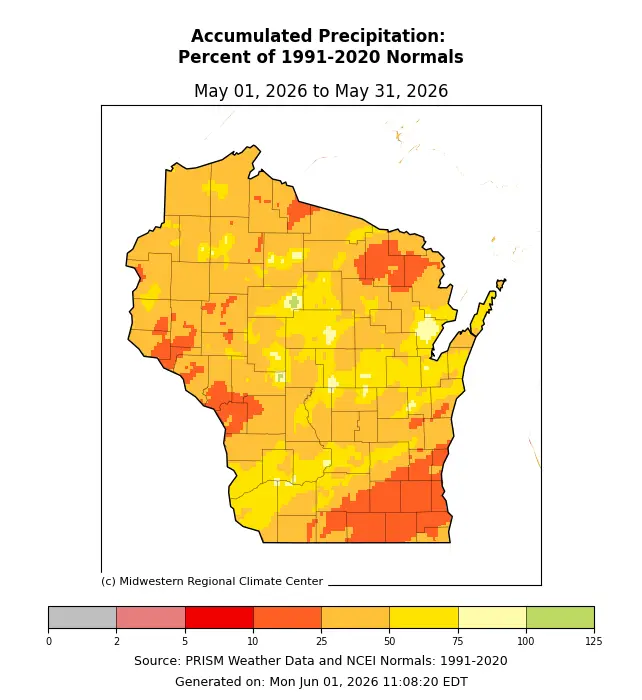
While a handful of rain events brought temporary relief — including scattered showers across most of the state on the 12th, locally heavy downpours in Dane County on the 17th, and a few more drops between the last week of the month — most areas never came close to erasing their month-long deficits.
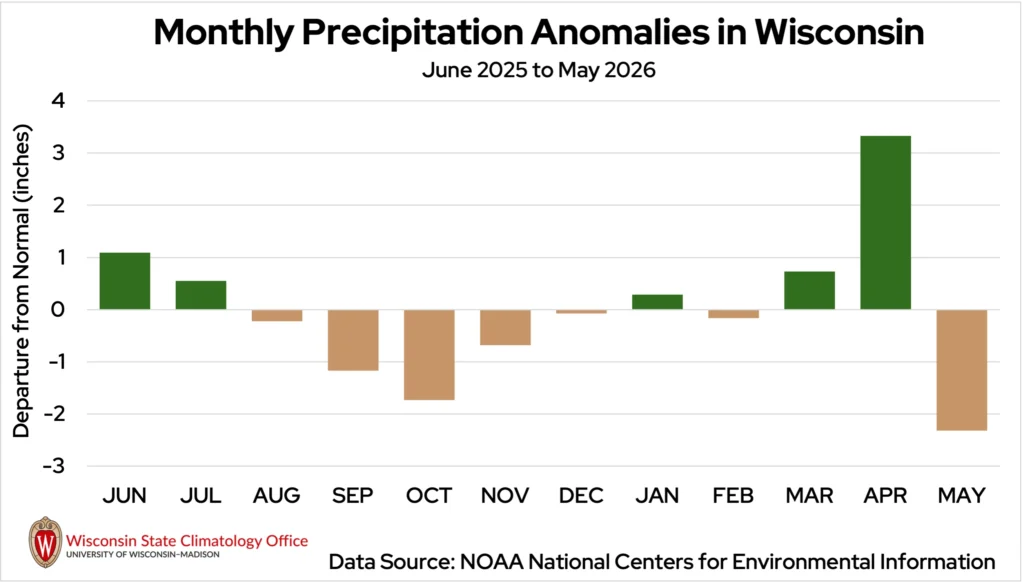
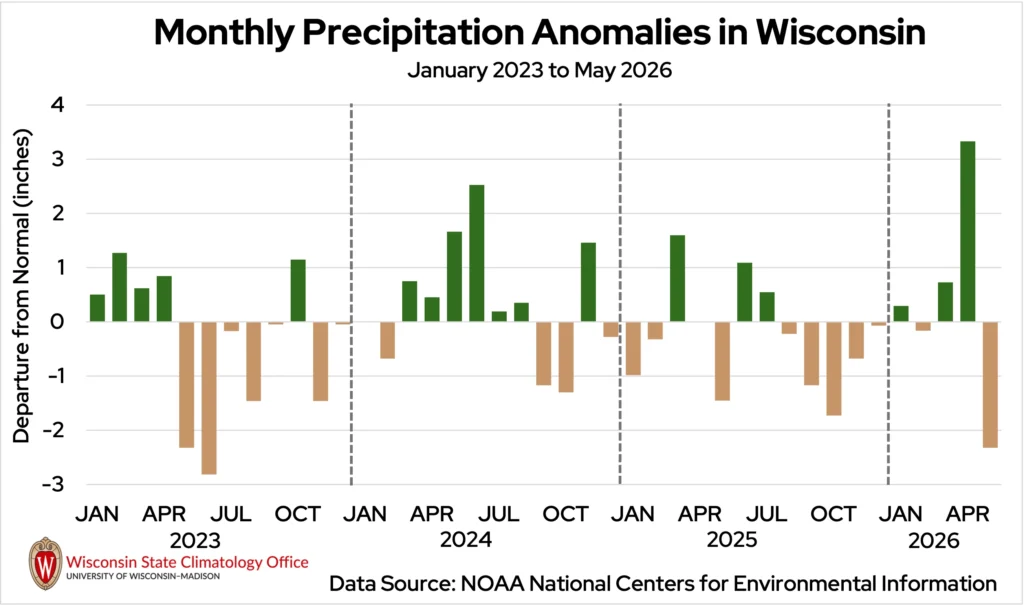
Concerns shifted dramatically from flooding in early May to the potential for drought development heading into summer. The one-two punch of April 2026 to May 2026 clearly articulates the precipitation ping-pong pattern we’ve been facing recently in Wisconsin (Figure 6).
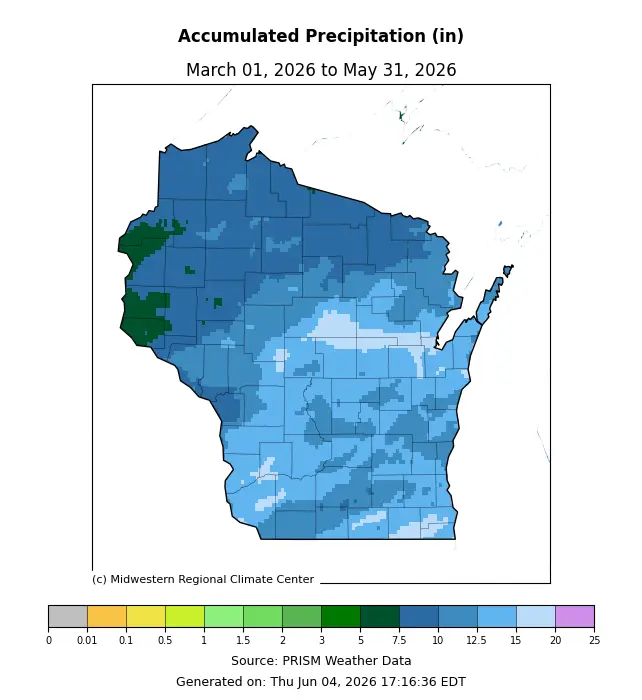
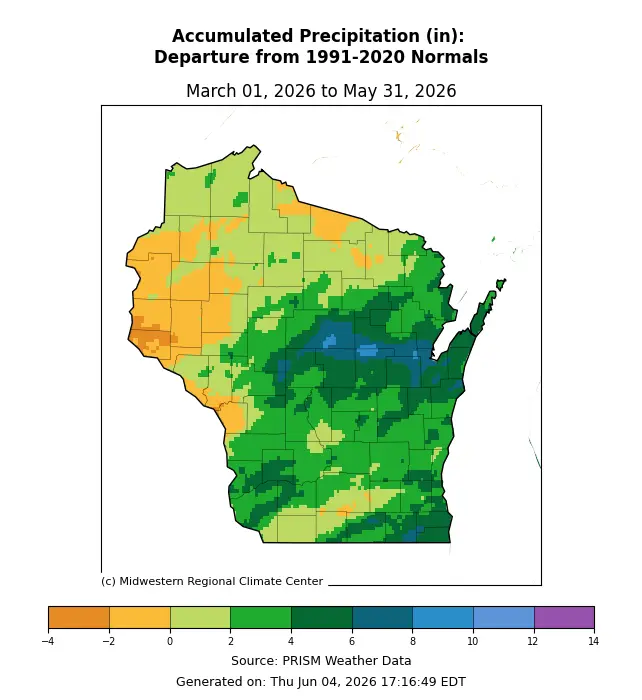
Spring ranked as the tenth wettest spring on record, with precipitation totals of 10.75 inches, 1.80 inches above normal. However, the seasonal surplus was driven overwhelmingly by April’s record-setting rainfall. Additionally, seasonal snowfall averaged 19.3 inches across the state — 6.8 inches above normal — much of which fell in early spring.
The season showcased nearly every form of Wisconsin weather, from the historic mid-March blizzard to April’s frequent severe weather outbreaks and flooding concerns, followed by the rapid return of dry conditions during May (Figure 7).
Quiet on the Storm Front
May brought much of Wisconsin a needed break from severe weather following a remarkably active April.
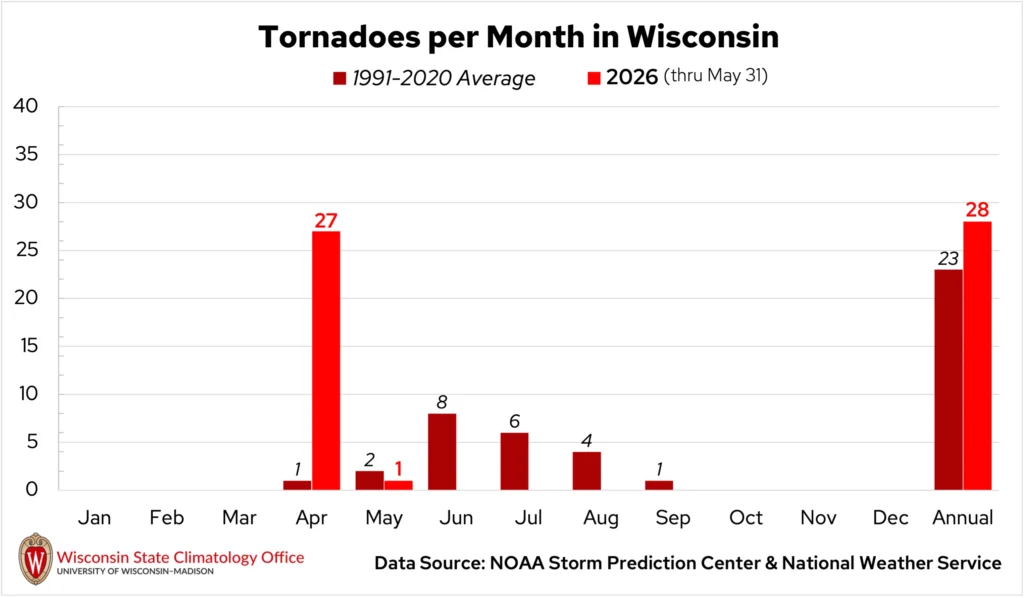
Only one tornado was confirmed across the state in May, though Wisconsin typically records about two tornadoes during May. This lone tornado was an EF0 (the weakest strength category) that touched down during the early morning hours of May 16 in southwestern Lafayette County, destroying a shed and uprooting and damaging several trees (Table 3).
| Location | Date | Enhanced Fujita (EF) Rating | Estimated Maximum Winds | Damage Reported |
|---|---|---|---|---|
| Shullsburg (Lafayette Co.) | May 16 | EF0 | 85 MPH | Damage to trees and a shed |
Additional rounds of thunderstorms crossed the state on May 17 and again on May 18 and 19, bringing gusty winds and isolated hail. Later in the month, scattered storms on May 27 knocked down numerous trees and power lines across central Wisconsin and produced hail up to two inches in diameter near Rib Mountain (Marathon County).
Despite these isolated events, May was a relatively quiet month by Wisconsin standards, and especially when compared to April’s 27 tornadoes. The transition from the state’s most tornadic April on record (since 1950) to a comparatively calm May was yet another example of the weather whiplash Wisconsin has been experiencing (Figure 8).
Rapid Return of Dry Conditions
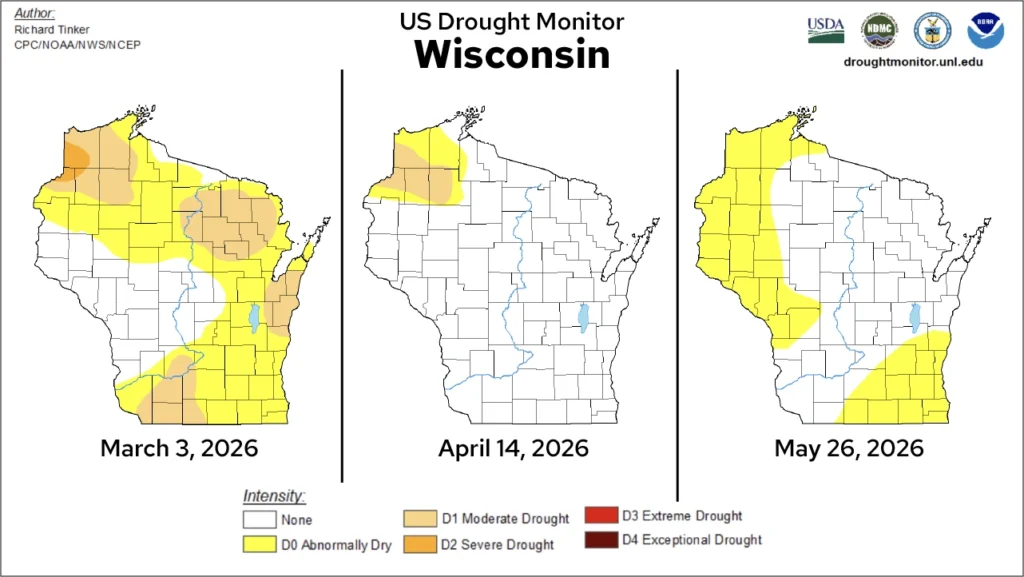
Following a spring that flipped from early-season dryness in March to widespread relief in April, Wisconsin entered May largely free of drought concerns. However, the month’s warm, dry, and occasionally windy weather quickly allowed dry conditions to return.
During the first three weeks of May, less than two percent of the state was classified as abnormally dry (D0), a sharp contrast to the start of spring. By the last week of May, that coverage had expanded to nearly 40 percent, including larger portions of northwestern Wisconsin as well as west-central and southeastern Wisconsin (Figure 9).
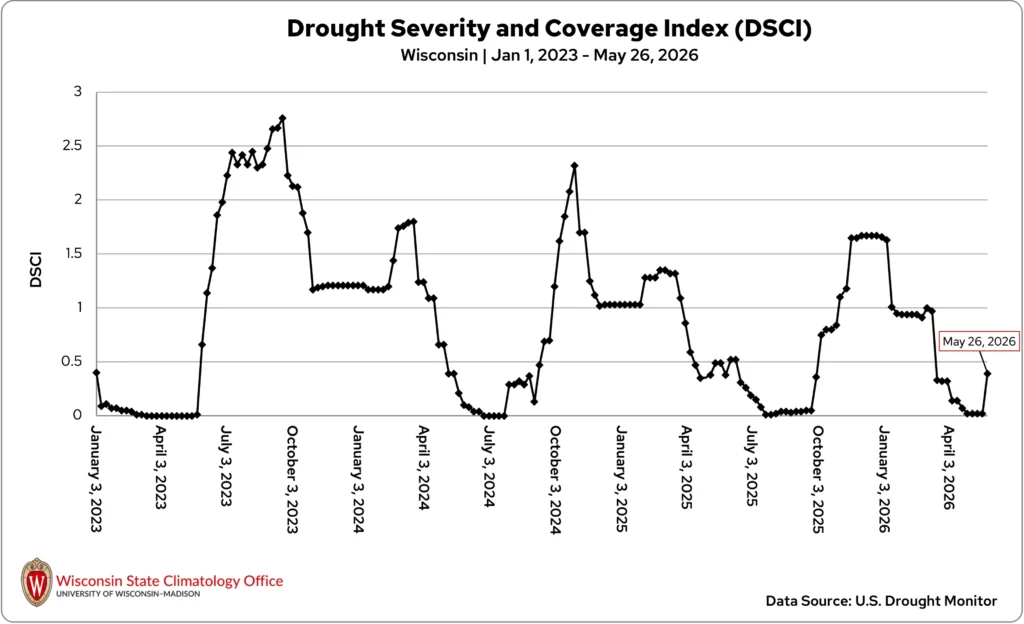
The state’s Drought Severity and Coverage Index also climbed from near zero in mid-April to nearly 0.40 by the end of May, returning to levels last seen around mid-March. Together, these shifts highlight how quickly conditions can swing from widespread drought to excess water and back within a single season (Figure 10).
Frost Threats and Drying Fields
Wisconsin agriculture faced a changing set of conditions throughout the month of May.
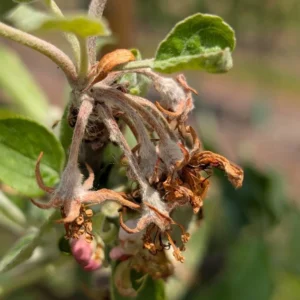
With the repeated frosts and freezes at the beginning of May and again mid-month, newly emerged crops, fruit trees, gardens, and other sensitive vegetation were at risk. These cold temperatures prompted growers to closely monitor conditions and, in some cases, take measures to protect vulnerable crops.
Reports from around the state indicated that some fruit blossoms and garden plants were nipped by the frost, and the cool weather likely slowed crop development and spring green-up, particularly in northern Wisconsin (Image 1).
As the month progressed, attention shifted from cold temperatures to increasing warmth and a growing lack of moisture. April’s abundant rainfall had provided ample moisture for crops, pastures, and rangelands, but May’s warm and dry conditions steadily reduced any moisture left in the soil.
By month’s end, plant available water near seedling depth had become increasingly limited in most areas, and reports of dry gardens, stressed lawns, and emerging soil moisture concerns became more common.
In some locations, soil crusting affected crop emergence, including reports of soybean emergence issues in northeastern Wisconsin.
That said, many newly emerged crops appeared to be in generally good condition at the end of May. However, the combination of warmth, wind, and limited rainfall raised concerns about what could happen if the dryness persisted into June.
Climate Ed-ucation
After a spring marked by severe weather, it’s worth highlighting one of Wisconsin’s more overlooked storm hazards: lightning. Our latest blog, Watching for Lightning in Wisconsin, explores the science of lightning, the state’s lightning climatology, and steps to stay safe when lightning strikes.
Climate Stats by Division: May 2026
Color Key
-
Dark blue: Record coolest
-
Royal blue: Bottom ⅒
-
Light blue: Bottom ⅓
-
White: Normal
-
Light orange: Top ⅓
-
Orange: Top ⅒
-
Red: Record warmest
-
Dark brown: Record driest
-
Light brown: Bottom ⅒
-
Beige: Bottom ⅓
-
White: Normal
-
Light green: Top ⅓
-
Green: Top ⅒
-
Dark green: Record wettest
| Temperature (degrees Fahrenheit)
May 2026 |
Liquid-Equivalent Precip. (Inches)
May 2026 |
Liquid-Equivalent Precip. (Inches)
Nov. 1, 2025 – May 31, 2026 |
||||
|---|---|---|---|---|---|---|
| Division | Avg | Dept | Avg | Dept | Avg | Dept |
| Northwest | 53.4 Normal | -0.6Normal | 1.40: Bottom ⅒ | -2.40: Bottom ⅒ | 12.50: Normal | -0.78: Normal |
| North Central | 52.5 :Normal | -0.9 :Normal | 1.81: Bottom ⅒ | -1.93: Bottom ⅒ | 16.14: Top ⅓ | 1.99: Top ⅓ |
| Northeast | 52.2: Normal | -1.4:Normal | 1.62: Bottom ⅒ | -1.86: Bottom ⅒ | 17.66: Top ⅒ | 3.73: Top ⅒ |
| West Central | 56.9: Normal | 0.0:Normal | 1.39 : Bottom ⅒ | -2.94: Bottom ⅒ | 13.58: Normal | -1.20: Normal |
| Central | 56.5: Normal | -0.1:Normal | 1.99: Bottom ⅓ | -2.06: Bottom ⅓ | 18.34: Top ⅒ | 3.33: Top ⅒ |
| East Central | 54.6: Normal | -0.4:Normal | 1.84: Bottom ⅓ | -1.81: Bottom ⅓ | 18.29: Top ⅒ | 3.20: Top ⅒ |
| Southwest | 57.7: Normal | -0.3:Normal | 2.03: Bottom ⅓ | -2.42: Bottom ⅓ | 17.16: Top ⅓ | 0.49: Top ⅓ |
| South Central | 58.2: Normal | 0.3:Normal | 1.29:Bottom ⅒ | -2.87: Bottom ⅒ | 16.36: Top ⅓ | -0.37: Top ⅓ |
| Southeast | 56.5: Normal | -0.2:Normal | 0.71: Record | -3.25: Record | 18.71 Top ⅓ | 1.69 Top ⅓ |
| State | 54.9: Normal | -0.5:Normal | 1.613: Bottom ⅒ | -2.32 Bottom ⅒ | 15.99 Top ⅓ | 1.17 Top ⅓ |
Monthly, seasonal, and annual temperature and precipitation values and rankings published in this report are from NOAA’s National Centers for Environmental Information at the time of posting this climate summary. Values and rankings can change after publishing our climate summaries. To check the most recent values and rankings, visit NOAA’s National Centers for Environmental Information Climate at a Glance Tool.
This report is a product of the Wisconsin State Climatology Office. For questions and comments, please contact us by email (stclim@aos.wisc.edu) or phone (608-263-2374).