July jumped between extremes: from sweltering heat to near-frost conditions, destructive storms to Dust-Bowl-like dry spells.
- Tied for eleventh warmest July on record
- Extremely dry for most
- Record bout of wildfire smoke
Relentless Heat and Humidity
Throughout July, several rounds of summer heat scorched Wisconsin. Temperatures repeatedly climbed into the 90s and humidity made many days feel even hotter.
This summer’s first heat wave lingered from late June into the first few days of July, bringing highs in the 90s and heat index values exceeding 100 degrees Fahrenheit across parts of southern Wisconsin.
Some locations also experienced unusually warm nights. Madison and Milwaukee set daily records for the warmest low temperature on July 1: 79 degrees in Madison and 78 degrees in Milwaukee.
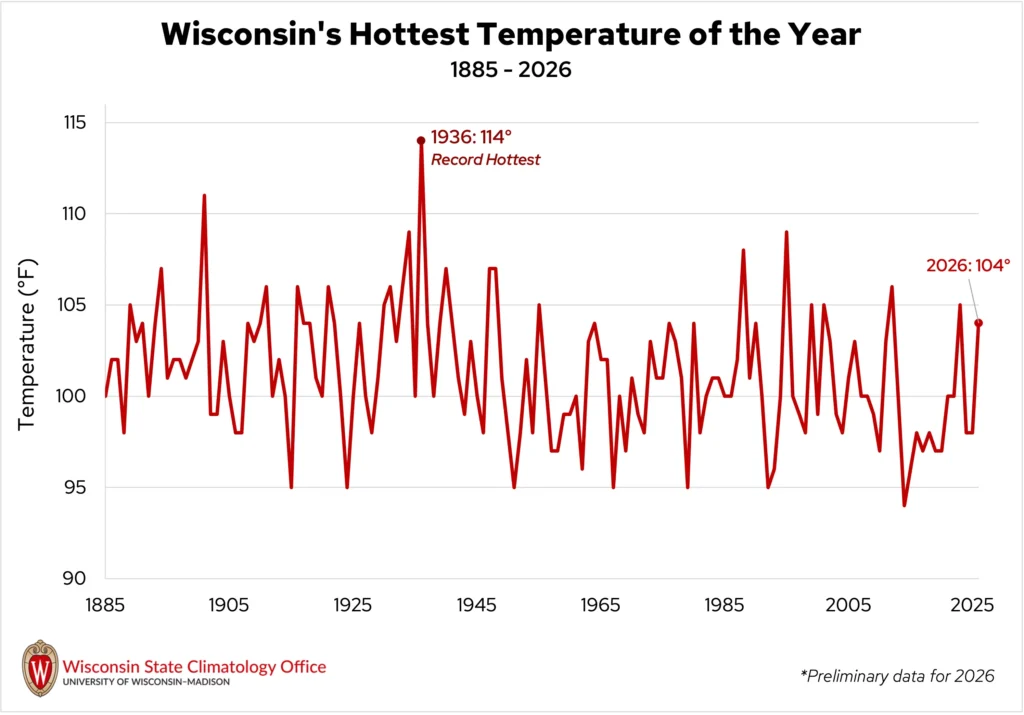
As if July couldn’t get hotter, a second, more intense heat wave arrived during the week of July 12. The timing was memorable, as July 13 marked the 90th anniversary of Wisconsin’s all-time hottest temperature: 114 degrees in Wisconsin Dells.
While this year’s event did not approach the 1936 extremes, Wisconsin did reach 100 degrees for the first time since 2023 (Figure 1). The state’s hottest temperature of the month was 104 degrees, observed at cooperative observing stations in Wausaukee (Marinette County) on July 14 and West Allis (Milwaukee County) on July 15.
Hundreds of daily warm low temperature records were also set or tied across Wisconsin between July 12 and 15, highlighting how little relief many residents received overnight.
A brief cool spell brought relief by July 22, when some northern locations dipped into the 30s and many others into the 40s. Knight (Iron County) reported a chilly 37.8 degrees the morning of July 22, the state’s coldest temperature of the month.
Alas, the summer heat returned during the final days of the month. Once again, temperatures climbed into the 90s while dew points soared into the upper 70s and even lower 80s, creating dangerously oppressive conditions.
The combination of high air and dew point temperatures on July 27 resulted in heat index values exceeding 100 degrees from southwestern through west-central Wisconsin and areas to the east.
The Lancaster Wisconet station (Grant County) reported a stifling heat index of 118.5 degrees. The Dane County Regional Airport recorded a heat index of 114 degrees that day, landing third among its steamiest days since records began in 1948.
Though these were incredible heat index values, they fell short of the hottest heat index ever measured in the state.
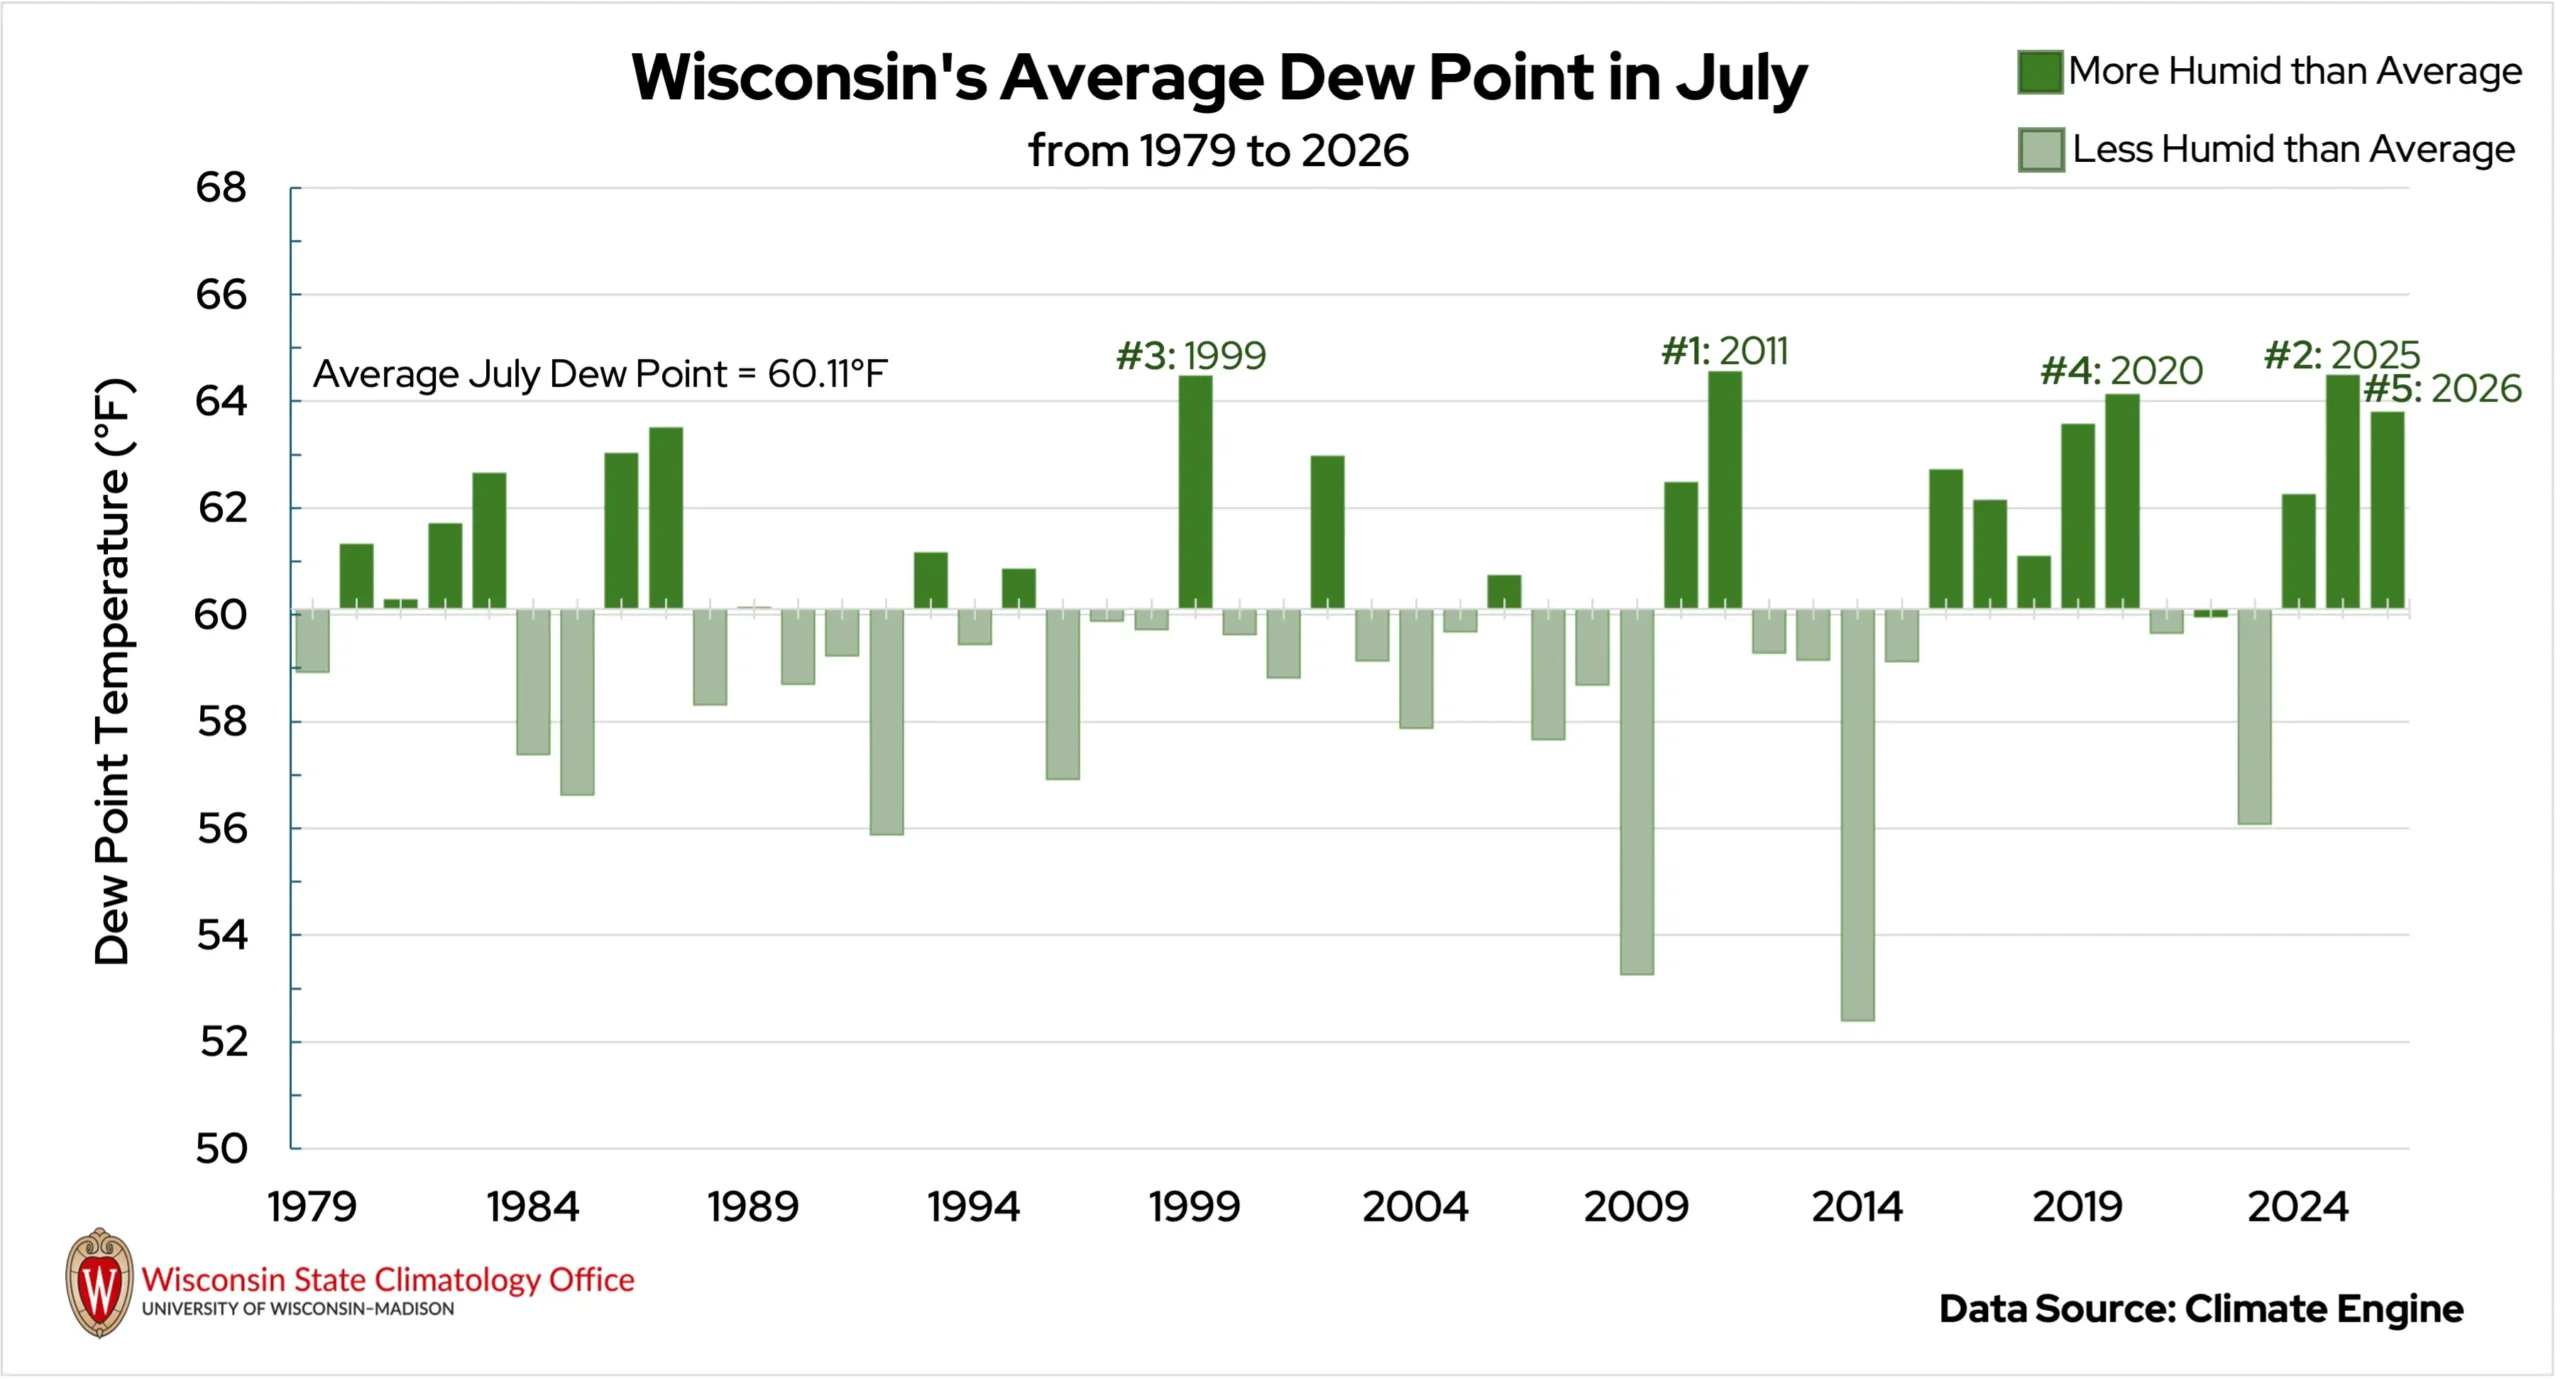
The relentlessly high dew points led to 2026 ranking as the fifth most humid July on record in Wisconsin since 1979 (Figure 2).
Although July featured several intense heat waves, the number of 90-degree days was well below record levels at Wisconsin’s six first-order stations. Instead, nearly half or more of July days recorded high temperatures in the 80s at every first-order station (Table 1), and the exceptional humidity made many of those days feel even hotter.
| Location | # of 80-degree days in July 2026 | Record # of 80-degree days in July | # of 90-degree days in July 2026 | Record # of 90-degree days in July |
|---|---|---|---|---|
| Green Bay | 21 | 26( 2010) | 2 | 14 (2012) |
| Wausau | 20 | 24 (2021) | 4 | 12 (2012) |
| Eau Claire | 19 | 25 (2008) | 7 | 18 (2006) |
| La Crosse | 18 | 27 (2008) | 8 | 17 (2006) |
| Madison | 18 | 27 (2010) | 8 | 19 (1955) |
| Milwaukee | 15 | 21 (1993) | 6 | 12 (1955) |
The warmth wasn’t limited to daytime hours, though. Nights in northern Wisconsin in particular were unusually warm, with low temperatures averaging four to eight degrees above normal for the month. July’s average low temperatures in north-central Wisconsin ranked seventh warmest on record, while other parts of northern and central Wisconsin ranked eighth, ninth, and eleventh warmest. Statewide, July’s average low temperatures tied for eleventh warmest among all Julys on record.
The repeated stretches of hot days, warm nights, and humid weather had real impacts on public health. According to the Wisconsin Department of Health Services, emergency department visits for heat-related illnesses* increased substantially during each of the month’s major heat waves, particularly during the prolonged event in mid-July. There were approximately 415 heat-related illness visits between July 12 and 17. That’s compared to the approximate 187 heat-related illness visits between July 4 and 11, when the weather was relatively cooler and drier.
*According to the Wisconsin Department of Health Services, “Visits with heat-related illnesses were identified by searching the visit chief complaints, reasons for admissions, and discharge diagnoses for words like ‘heat,’ ‘sun stroke,’ and ‘hyperthermia,’ or ICD-10 codes, such as T67 and X30.”
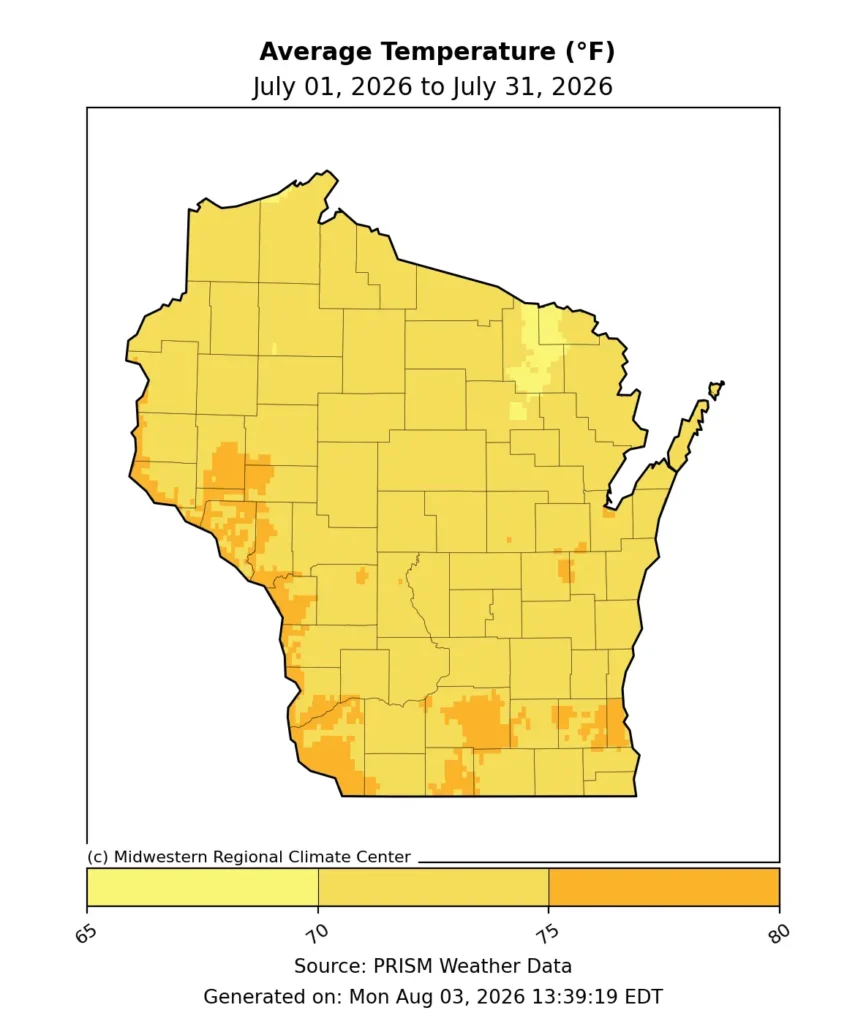
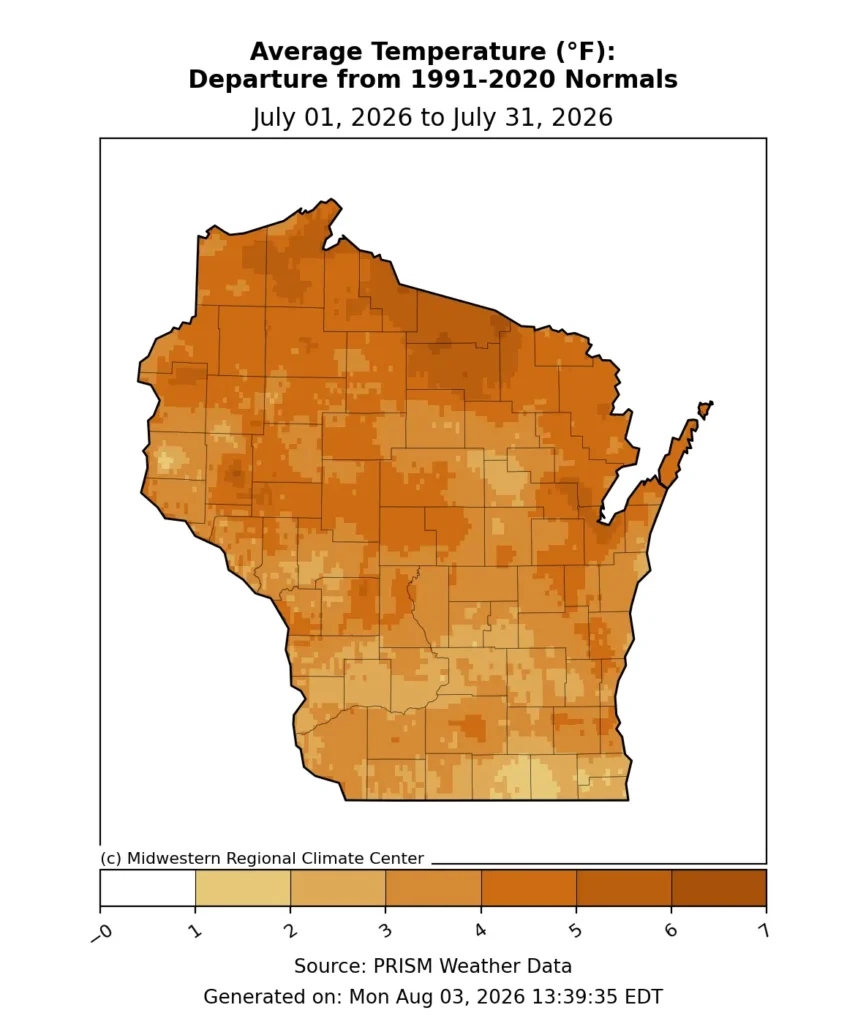
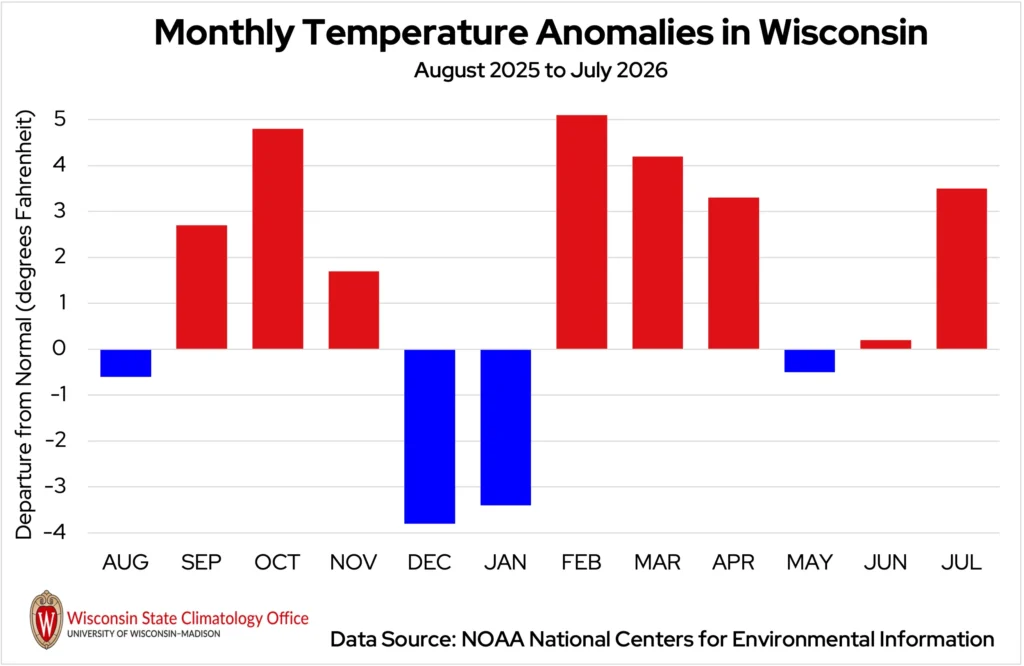
Overall, the statewide average was 72.7 degrees, a noticeable 3.5 degrees above normal. This ties for the eleventh warmest July on record and the fifth warmer-than- normal month of the year (Figures 3 and 4).
Downpours and Dry Spells
July was remarkably dry across much of Wisconsin, but isolated bursts of rain managed to prevent record-breaking dryness.
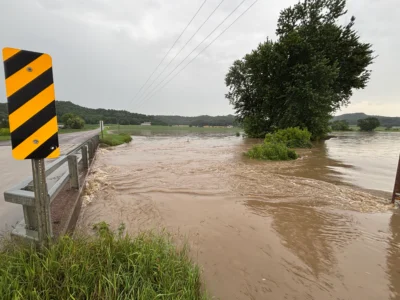
The month started out promising, with downpours and thunderstorms moving through central Wisconsin on July 1 and 2. A cold front sat over the region, dropping over two inches of rain from La Crosse to Green Bay. Many locations in the west-central region reported impressive four to five inches of rain that led to localized flooding and mudslides (Image 1). A gauge near Cashton (Monroe County) measured 5.31 inches, the highest one-day rain total in the state during July.
Central Wisconsin, along with the northern region, was under the gun again on July 8 as two rounds of showers and thunderstorms moved through. Rhinelander received nearly an inch of rain from the morning showers, but the afternoon round was especially intense.
A National Weather Service employee in De Pere (Brown County) reported two inches of rain falling in just 25 minutes! The influx of water created flash flooding in Brown County, with reports of flooded roads in Green Bay and Ashwaubenon, and significant water damage to De Pere High School. Flooding was also reported in Merrill (Lincoln County), with some vehicles becoming stranded on local roads.
The Badger State began to dry out mid-month, aside from modest totals in some of the western counties.
By July 26, Milwaukee had received only 0.16 inches of rain since the start of the month. The city was on its way to its driest July on record — the record standing at 0.18 inches during the Dust Bowl in July 1936. Lawns in the area had turned brown, and some trees began to drop leaves to conserve water.
However, the city’s fate changed on July 27 as strong thunderstorms rumbled through eastern Wisconsin. A welcome one to two inches of rain fell from Fond du Lac to Kenosha counties. Localized flooding was reported in parts of Ozaukee County, where an estimated six inches of water ponded on roads in Grafton and Saukville. A daily total of 1.75 inches of rain broke Brew City’s July 27 rainfall record of 1.5 inches set in 2011.
As the month neared a close, Madison was still strikingly dry, having received 0.95 inches between July 1 and 30. Steady rain fell across most of Wisconsin on the final day of the month, with totals from a half inch to as high as two inches in the southwest.
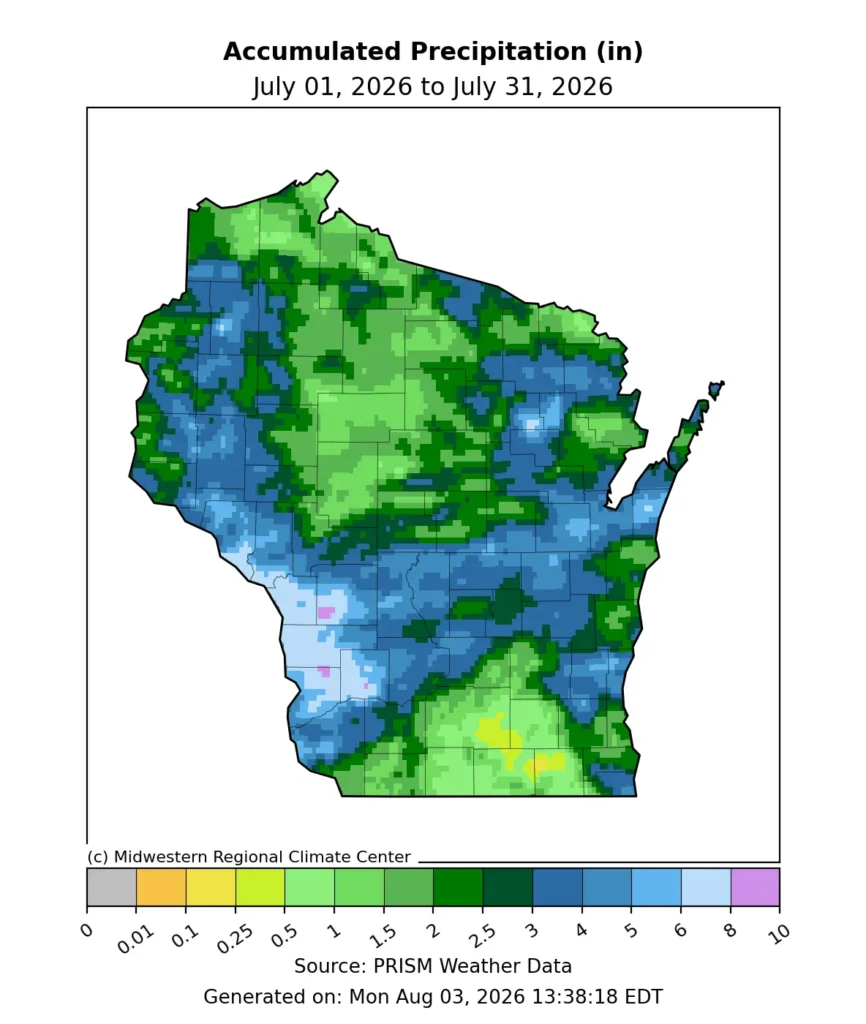
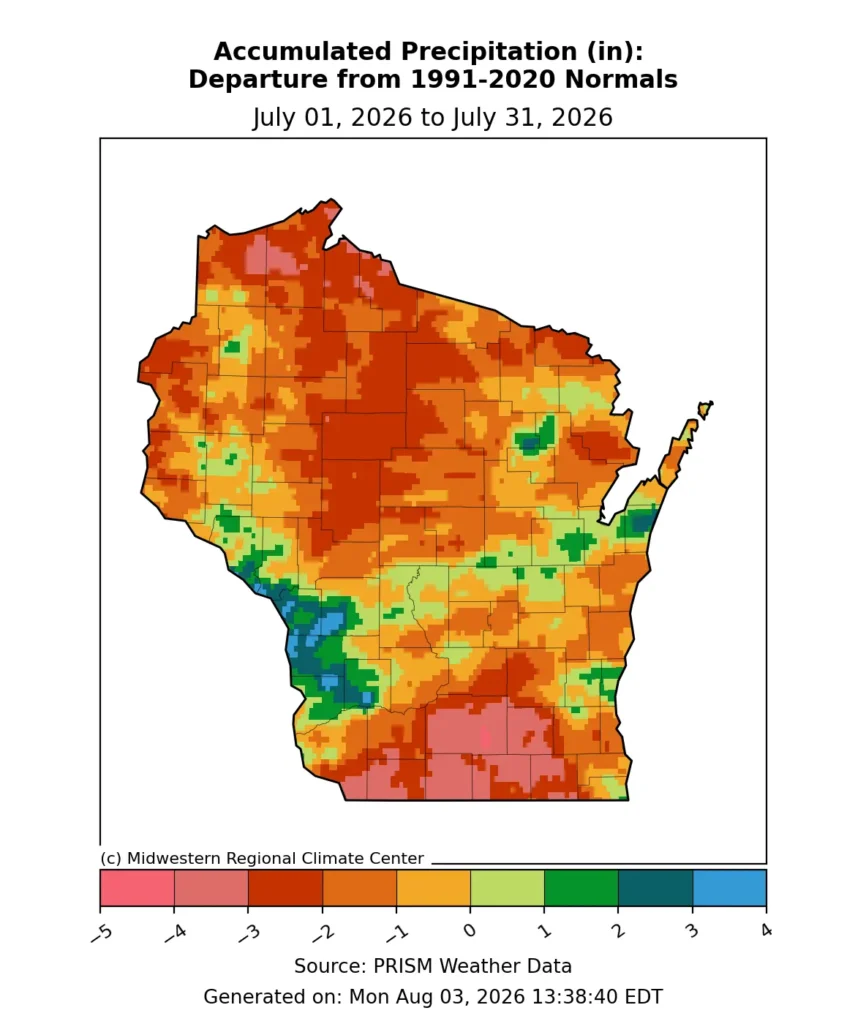
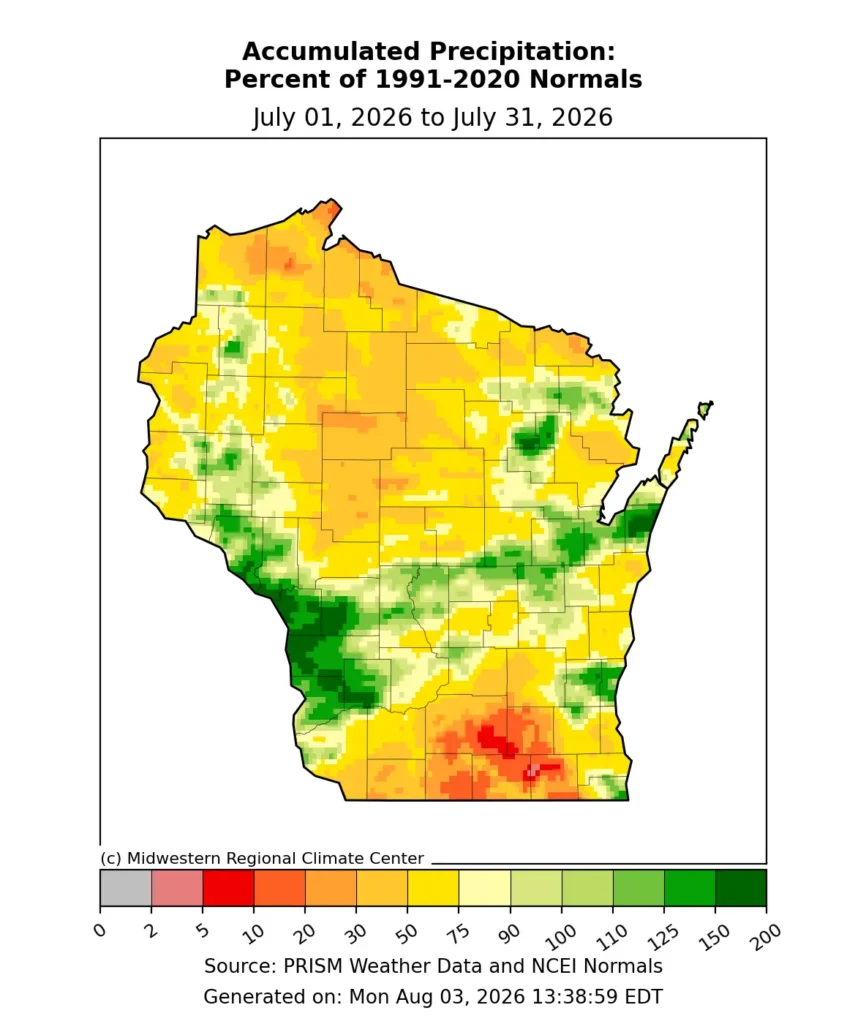
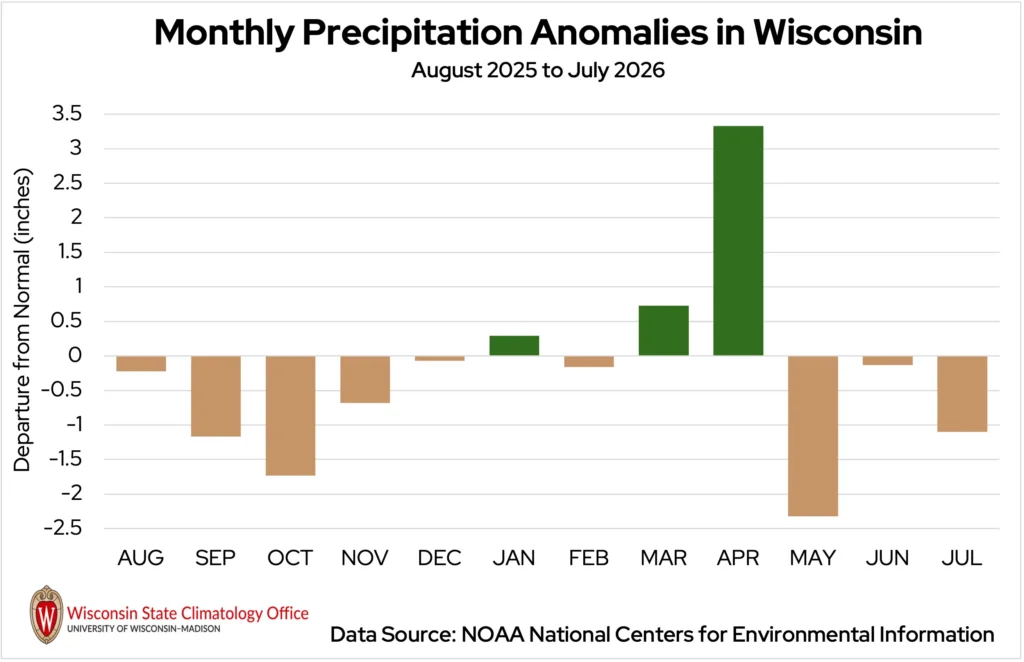
As a whole, Wisconsin averaged 2.94 inches of precipitation in July, 1.10 inches drier than normal (Figures 5 and 6). The southcentral region was particularly parched, with some locations receiving only 10 percent of their normal monthly rainfall. This was the state’s driest July since 2014.
Severe Storms Pack a Punch
While the number of severe weather days was minimal this month (only seven), the impacts were anything but.
July 1 brought morning and afternoon storms to western and central Wisconsin. The morning round generated winds up to 60 miles per hour, knocking down trees and power lines in Waupaca, Outagamie, Brown and Kewaunee counties. The afternoon storms featured large hail, with stones measuring two to three inches in diameter (golfball- to baseball-sized) reported in Fond du Lac County.
Midday on July 3, an isolated line of strong thunderstorms developed along the southern stateline. A potent macroburst from a storm cell created 90 to 100 mile per hour winds in Walworth County. The storm caught residents by surprise: three children died on Geneva Lake after their boat capsized, and five people were injured when a silo collapsed on a barn they were taking shelter in.
Multiple tornadoes occurred on July 20 and, thankfully, created only minor damage. Five tornadoes were confirmed in central Wisconsin, including a strikingly picturesque tornado in Stratford (Marathon County).
Much stronger storms swept through a week later on July 27. Storms developed along a frontal boundary in northern Wisconsin that morning and progressed southeastward. A large, destructive tornado touched down near Appleton (Outagamie County) and tore through Fox Crossing and Menasha (Winnebago County) before dissipating over Lake Winnebago. Numerous homes and businesses were significantly damaged by the twister’s estimated 140-mile-per-hour winds (Image 2 and Table 2).
| Location | Date | Enhanced Fujita (EF) Rating | Estimated Maximum Winds | Damage Reported |
| White Creek (Adams Co.) | July 1 | EF1 | 90 MPH | Some damage to trees and several mobile homes |
| Whitehall (Trempeleau Co.) | July 20 | EF0 | 60 MPH | No significant damage reported |
| Stratford (Marathon Co.) | July 20 | EFU | Unknown | Eyewitness reports of tornado, but no damage observed |
| Black River Falls (Jackson Co.) | July 20 | EF0 | 60 MPH | No significant damage reported |
| Zoar (Menominee Co.) | July 20 | EF0 | 70 MPH | Isolated tree damage |
| Tigerton (Shawano Co.) | July 20 | EFU | Unknown | Eyewitness reports of tornado, but no damage observed |
| Appleton (Winnebago Co.) | July 27 | EF3 | 140 MPH | Numerous heavily damaged homes and businesses, uprooted and snapped trees |
In addition to the tornado, massive hail pummeled parts of the state. Baseball- to softball-sized hail (two to three inches in diameter) fell in Door, Kewaunee, Shawano and Dodge counties. The largest hailstone reported was grapefruit-sized (4.5 inches) near Gresham in Shawano County.
Strong winds also brought down power lines, leaving nearly 100,000 customers in eastern Wisconsin without power. A line worker who was out working before the storms began was struck and killed by lightning in Whitewater (Walworth County). This is the second lightning fatality in Wisconsin in 2026, and the fifth since 2016. Wisconsin now ranks 14th in the U.S. for lightning fatalities in the last decade.
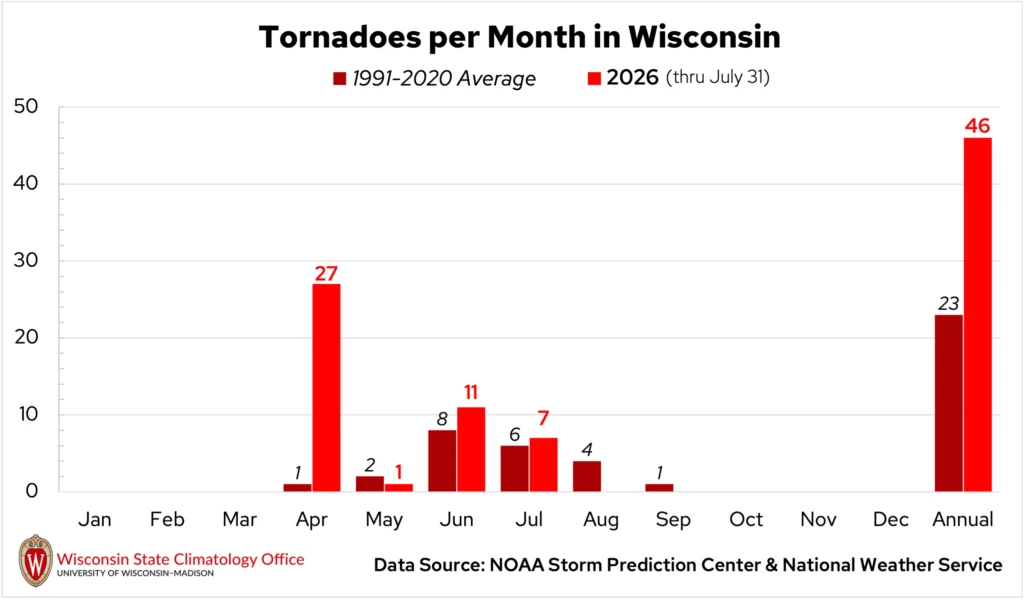
In all, seven tornadoes crossed through Wisconsin in July, one more than the 30-year average for the month (Figure 7). This brings the state’s 2026 tornado count to 46, tying for the second-most in a year on record.
Drought Deepens
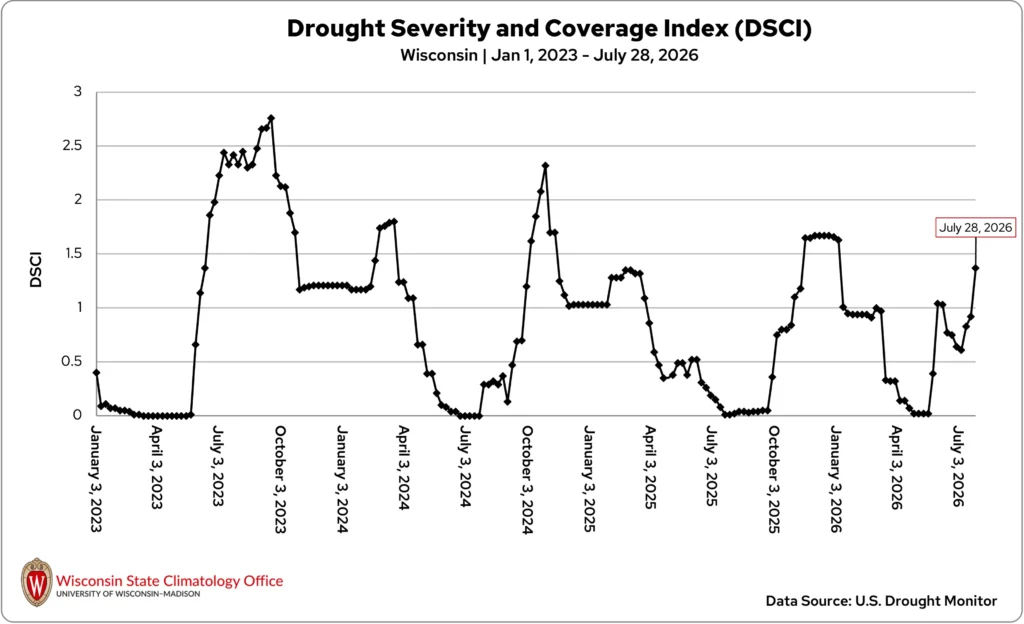
It’s no surprise that drought conditions quickly worsened as the state became increasingly dry through July. Wisconsin’s Drought Severity and Coverage Index (DSCI) more than doubled from July 7 to 28 (Figure 8). This dry month was a contrast to recent summers, when Wisconsin’s DSCI reached a minimum in July.
Abnormal dryness (D0) and areas of moderate drought (D1) expanded through the state by mid-month. By July 21, a sliver of Iron County was upgraded to severe drought (D2) — the first in the state since March. That sliver expanded by month’s end, covering much of Iron and Ashland counties and parts of Price, Oneida and Vilas (Figure 9).
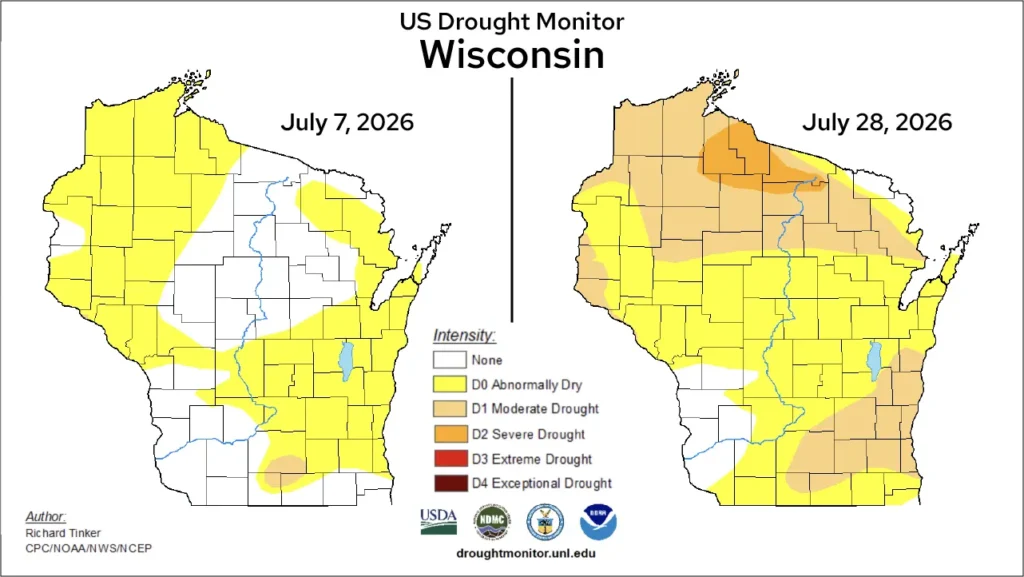
On July 28, 92 percent of Wisconsin was experiencing varying levels of dryness.
However, conditions on the ground may have appeared more severe than the map indicated, especially in parts of southern Wisconsin.
For background, the U.S. Drought Monitor considers conditions over recent weeks and also months prior. It also incorporates more than precipitation. Additional variables include soil moisture, streamflow, vegetation health, and reported impacts.
As a result, a recent stretch of dry weather may not be immediately reflected on the monitor, but rather is considered in the context of conditions from previous weeks and months.
Residents can submit local reports of drought conditions and impacts through the Condition Monitoring Observer Reports system.
Smoke From Distant Fires
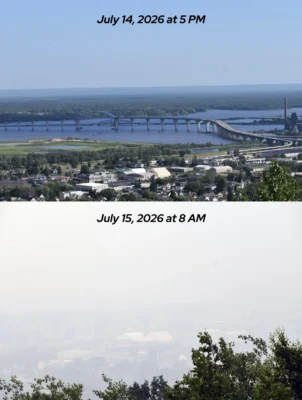
During the third week of July, Wisconsin became shrouded in wildfire smoke. Blazing wildfires in parts of Ontario and northern Minnesota created dense plumes of smoke that were spread across the Midwest and the East Coast by northeasterly winds.
On July 15, the Air Quality Index (AQI) reached the “hazardous” category across much of northern Wisconsin as smoke thickened through the day (Image 3). People in Minocqua and Vilas counties, and from the Bad River Band of Lake Superior Chippewa, even reported falling ash.
Dense smoke spread on July 16, becoming Wisconsin’s worst wildfire smoke event on record. Nearly the entire state experienced very unhealthy to hazardous air quality. DNR Outreach Coordinator Craig Czarnecki reported that 13 of the state’s air quality monitors measured their highest concentrations of wildfire smoke on July 16.
The dangerous air quality created significant health concerns, especially for people with preexisting medical conditions. According to the Wisconsin Department of Health Services, emergency department visits for severe asthma saw the largest single-day spike since 2018. Every region of the state experienced an increase in asthma-related visits, but the largest increase was in the northeast. The number of asthma-related visits in northeast Wisconsin on July 16 was more than three times higher than the previous seven days.
The smoke also forced the cancellation of many outdoor events. Low visibility created challenges at the EAA AirVenture in Winnebago County and caused some pilots to delay their arrival.
Over the following days, air quality gradually improved, but the smoke was stubborn to clear completely. Air Quality Advisories remained in place for parts of Wisconsin through July 20. In all, there were seven days when the state’s air quality was impacted by wildfire smoke in July.
Agriculture: Warmth Helped, Heat Hurt
July’s warmth helped crops advance through the growing season, but repeated heat waves and increasingly dry conditions created challenges.
Early in the month, farmers made good progress with hay cutting, fertilizer applications, and small grain harvest as fields dried out.
However, persistent heat and limited rainfall began stressing crops and increasing the need for irrigation. Corn, soybean, and pasture conditions degraded during the month, though about half of the reported crops and pastures were still rated in good condition at month’s end.
Livestock also faced heat stress, particularly during stretches of hot, humid nights that provided little overnight relief. For dairy cows, heat stress can reduce feed intake, thus lowering milk production. Heat can also be fatal for calves in the womb whose mothers are overheating for several days in a row.
Fruit crops generally benefited from the warmth, with apples, grapes, and berries developing quickly. However, moisture became increasingly needed as temperatures rose. One silver lining was Wisconsin’s ginseng crop, where the dry weather helped suppress fungal diseases.
In contrast to the heat, some northern Wisconsin cranberry growers had to jump into action in the early morning hours of July 22, using sprinkler systems to shield their cranberries from frost damage.
Climate Stats by Division
Color Key
-
Dark blue: Record coolest
-
Royal blue: Bottom ⅒
-
Light blue: Bottom ⅓
-
White: Normal
-
Light orange: Top ⅓
-
Orange: Top ⅒
-
Red: Record warmest
-
Dark brown: Record driest
-
Light brown: Bottom ⅒
-
Beige: Bottom ⅓
-
White: Normal
-
Light green: Top ⅓
-
Green: Top ⅒
-
Dark green: Record wettest
| Temperature (degrees Fahrenheit)
July 2026 |
Liquid-Equivalent Precip. (Inches)
July 2026 |
Liquid-Equivalent Precip. (Inches)
Nov. 1, 2025 – July 31, 2026 |
||||
|---|---|---|---|---|---|---|
| Division | Avg | Dept | Avg | Dept | Avg | Dept |
| Northwest | 71.9 :Top ⅒ | 3.8:Top ⅒ | 3.04: Bottom ⅓ | -1.14: Bottom ⅓ | 19.62: Normal | -2.22: Normal |
| North Central | 70.9 :Top ⅒ | 3.9 :Top ⅒ | 1.95: Bottom ⅒ | -2.03: Bottom ⅒ | 22.57: Normal | -0.06: Normal |
| Northeast | 71.0: Top ⅒ | 3.6:Top ⅒ | 2.42: Bottom ⅓ | -1.37: Bottom ⅓ | 25.05: Top ⅒ | 3.12: Top ⅒ |
| West Central | 74.0: Top ⅒ | 3.3:Top ⅒ | 4.40 : Normal | 0.28: Normal | 22.80: Normal | -1.17: Normal |
| Central | 73.6: Top ⅒ | 3.5:Top ⅒ | 2.63: Bottom ⅓ | -1.26: Bottom ⅓ | 24.71: Top ⅓ | 1.04: Top ⅓ |
| East Central | 72.8: Top ⅒ | 3.1:Top ⅒ | 3.46: Normal | -0.25: Normal | 25.04: Top ⅓ | 1.93: Top ⅓ |
| Southwest | 74.2: Top ⅓ | 2.7:Top ⅓ | 4.60: Top ⅓ | 0.01: Top ⅓ | 27.41: Top ⅓ | 0.63: Top ⅓ |
| South Central | 74.4: Top ⅓ | 2.8:Top ⅓ | 1.59:Bottom ⅒ | -2.56: Bottom ⅒ | 23.66: Normal | -2.48: Normal |
| Southeast | 73.8: Top ⅓ | 2.5:Top ⅓ | 2.44: Bottom ⅓ | -1.23: Bottom ⅓ | 26.02 Top ⅓ | 0.73 Top ⅓ |
| State | 72.7: Top ⅒ | 3.5:Normal | 2.94: Bottom ⅓ | -1.10 Bottom ⅓ | 23.49 Top ⅓ | -0.06 Top ⅓ |
Monthly, seasonal, and annual temperature and precipitation values and rankings published in this report are from NOAA’s National Centers for Environmental Information at the time of posting this climate summary. Values and rankings can change after publishing our climate summaries. To check the most recent values and rankings, visit NOAA’s National Centers for Environmental Information Climate at a Glance Tool.
This report is a product of the Wisconsin State Climatology Office. For questions and comments, please contact us by email (stclim@aos.wisc.edu) or phone (608-263-2374).