October was exceptionally warm and abnormally dry as drought deepened in northern Wisconsin and farmers made progress with the harvest.
- Fourth warmest October
- Beneficial rain, lingering deficits
- Exceptional drought expands
A Toasty October
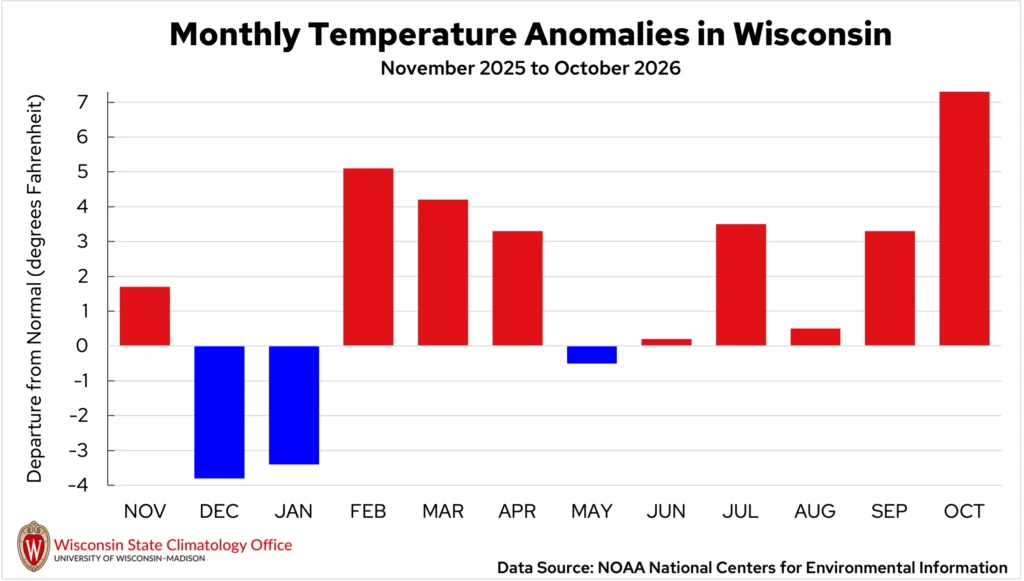
October was exceptionally warm across Wisconsin, ranking as Wisconsin’s fourth-warmest October on record. The statewide average temperature was 54.1 degrees, an astonishing 7.3 degrees above normal (Figures 1 and 2).
This makes for the most above-normal month Wisconsin has seen since February 2024, when the state was 12.2 degrees warmer than normal. In fact, this October was even warmer than several Septembers on record. The warmth extending back to early summer also made June through October the warmest such period on record.
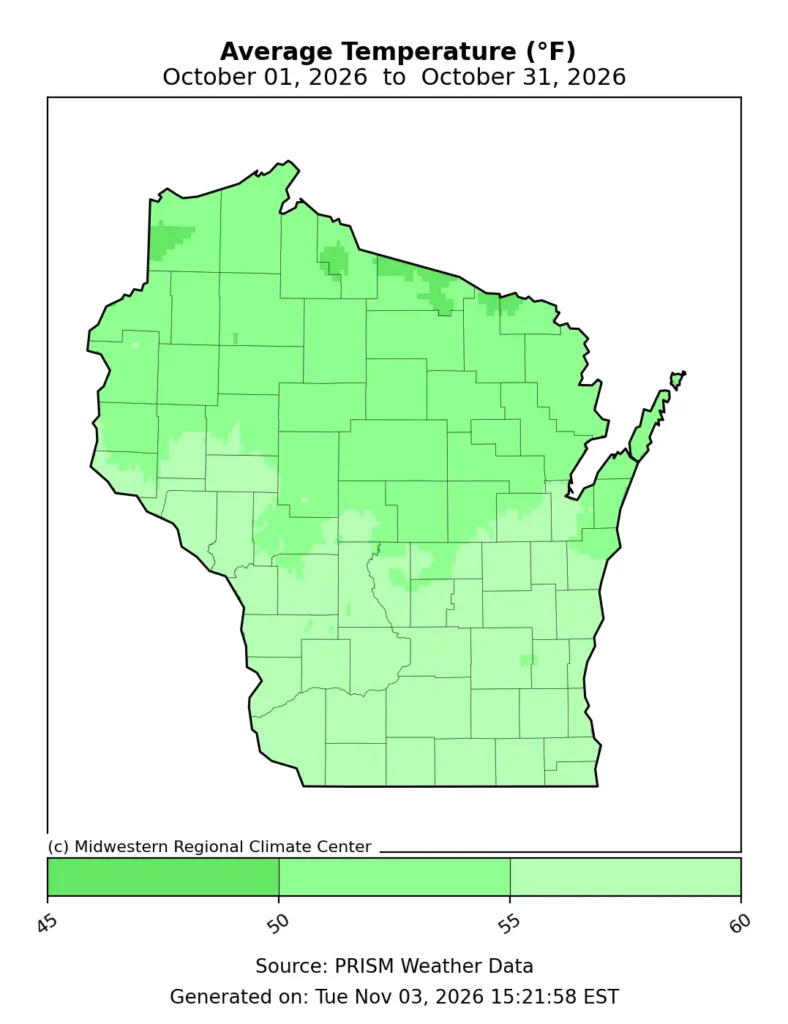
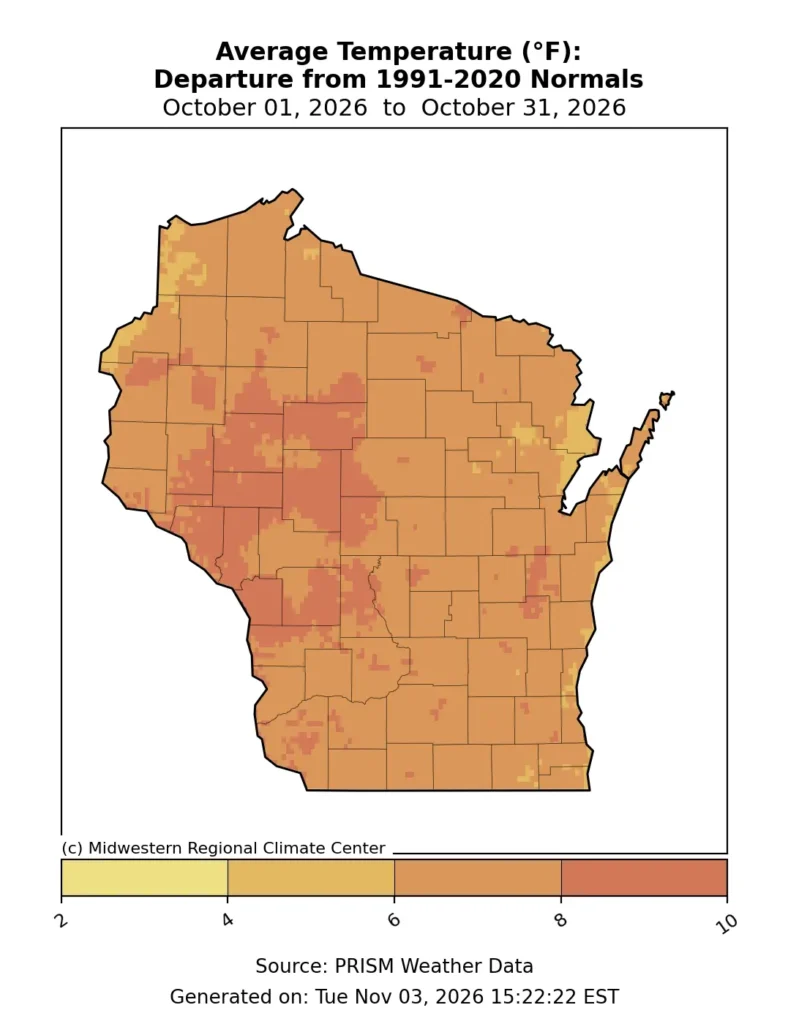
Unusually warm daytime temperatures were a major contributor to October’s exceptional warmth. High temperatures averaged eight to 10 degrees above normal across much of the state, with parts of northwestern Wisconsin over 10 degrees warmer than normal.
There were an impressive number of days with high temperatures reaching at least 60 degrees. Green Bay recorded 24 such days, tying for its third-highest October total on record, while Milwaukee had 26, its second-highest total.
An intense stretch of heat between October 10 and 12 brought numerous daily temperature records across the state, including a high of 89 degrees in Ashland (Ashland County) on October 10 and 88 degrees in Eau Claire on October 11.
For reference, the normal high temperature in Eau Claire on October 11 is 61 degrees.
Wisconsin even squeezed out one more 90-degree reading at a Wisconet station in River Falls, which recorded 90 degrees on October 11. This was the warmest temperature anywhere in the state all month, and likely the final 90-degree reading of 2026, capping off a remarkably normal year for extreme heat (Table 1).
| Location | Number of 90-degree Days in 2026 (thru Oct.) | 1991-2020 Normal Number of 90-degree Days per Year (entire year) |
|---|---|---|
| Milwaukee | 9 | 9 |
| Madison | 10 | 9 |
| La Crosse | 14 | 17 |
| Green Bay | 6 | 6 |
| Eau Claire | 11 | 10 |
| Wausau | 7 | 5 |
| 6 City Average | 9.5 | 9 |
Nighttime temperatures were unseasonably warm, too, ranging from one to 12 degrees above normal across the state. Anomalies were greatest in west-central Wisconsin and smallest in far northwestern and northeastern Wisconsin.
Several locations also broke daily records for their warmest minimum temperatures on October 12, including 68 degrees in La Crosse and 63 degrees in Madison.
Then, a mid-month cooldown brought frost and the coldest temperature of the month — a chilly 20 degrees the morning of October 17 in Merrill (Lincoln County). The first fall 32-degree freeze struck Wausau on the 16th and Green Bay and Madison on the 17th. Eau Claire had already recorded its first freeze earlier in the month on the 5th. All four cities saw a later-than-average first fall freeze.
Temperatures rebounded into the 70s across much of the state during the final week of October, with additional daily high-temperature records set. Ashland tied their record high of 79 degrees on October 24. On October 28, Green Bay rose to 73 degrees and Madison to 74, both beating out records previously set in the 1940s.
By Halloween, temperatures settled closer to normal as ghouls and goblins roamed the streets in search of sweet treats.
Bouts of Beneficial Rain Still Fell Short
October left a lot to be desired in terms of precipitation, as the majority of the state fell short of normal. Central and northern Wisconsin saw deficits of one to two inches, with some locations receiving less than half of the monthly normal (Figure 3).
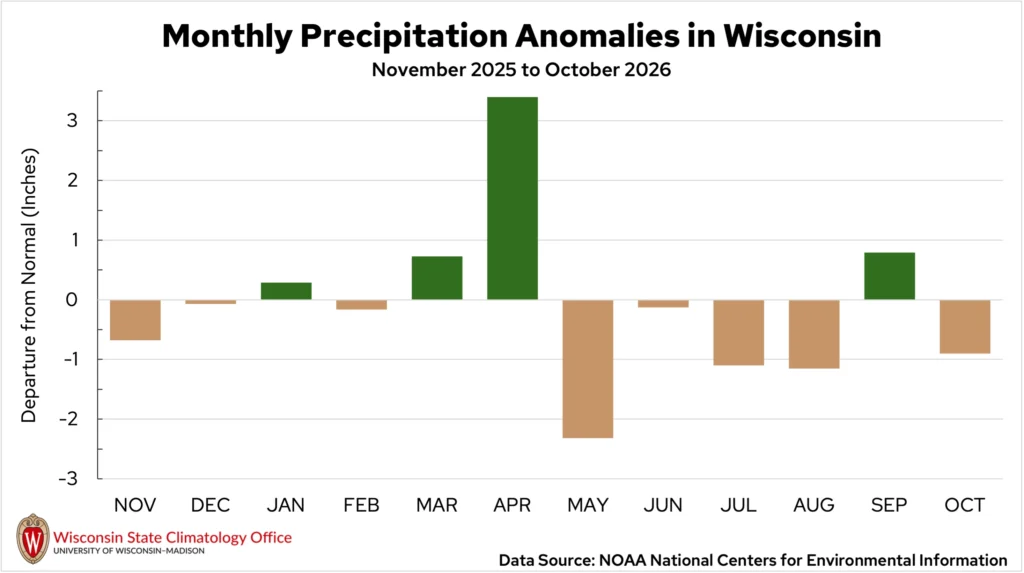
The statewide average total was 2.11 inches, falling 0.9 inches below average (Figure 4). This is the fourth consecutive drier-than-average October for the Badger State.
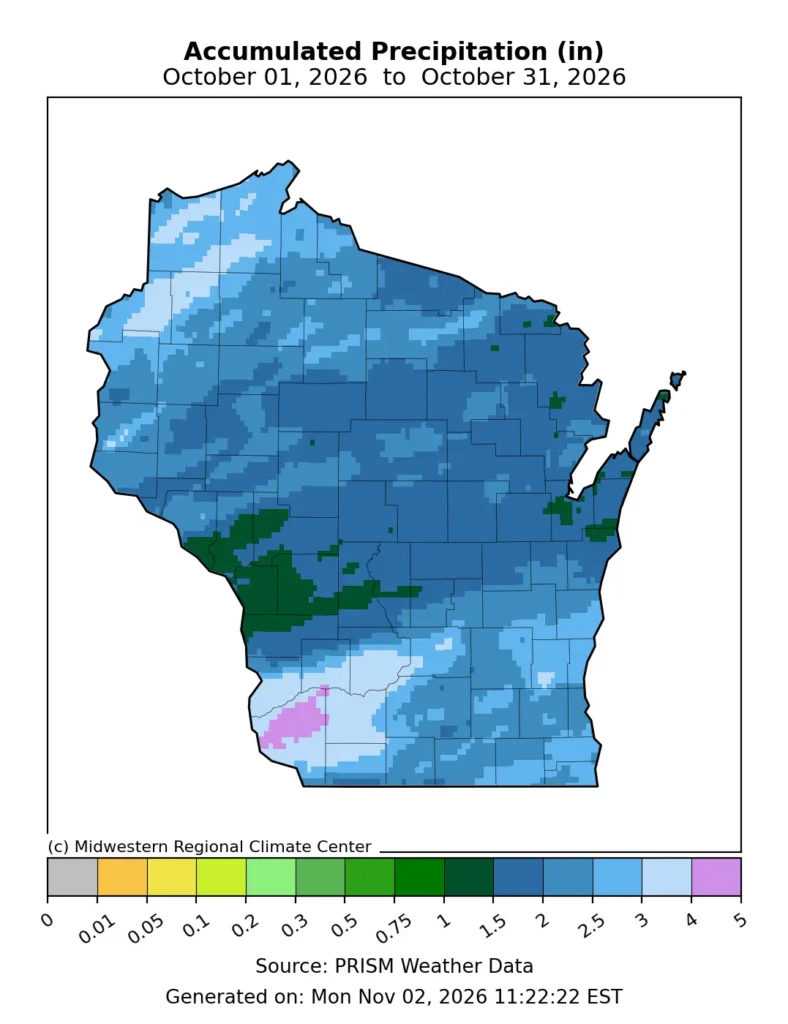
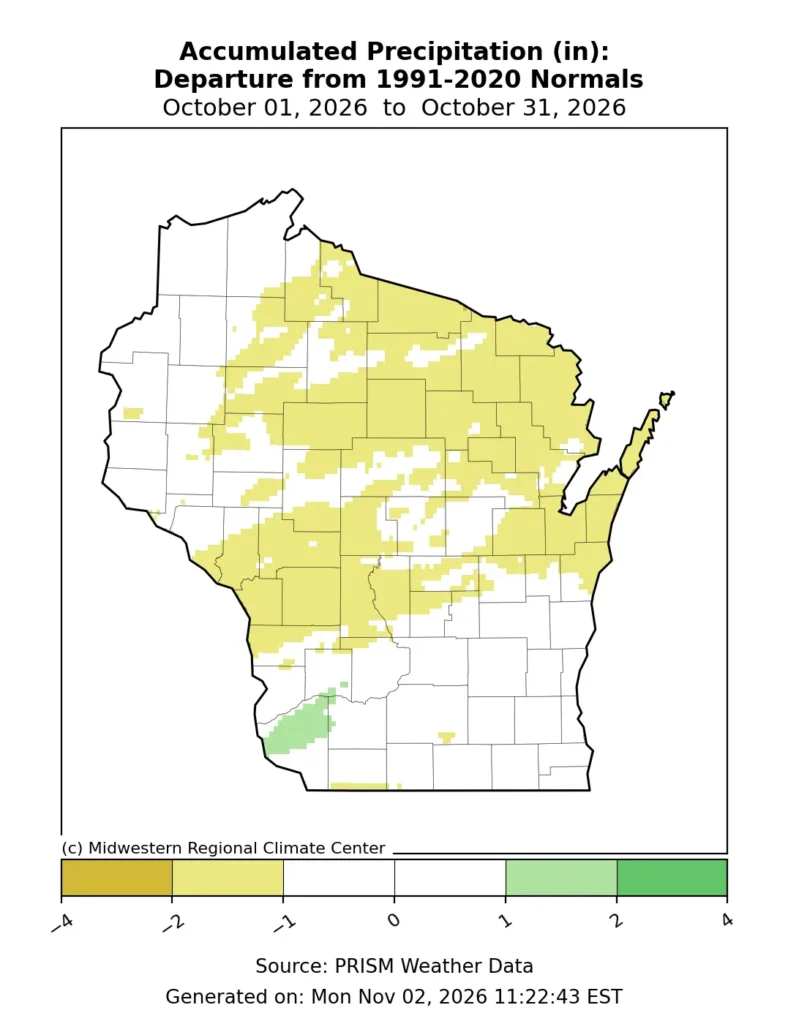
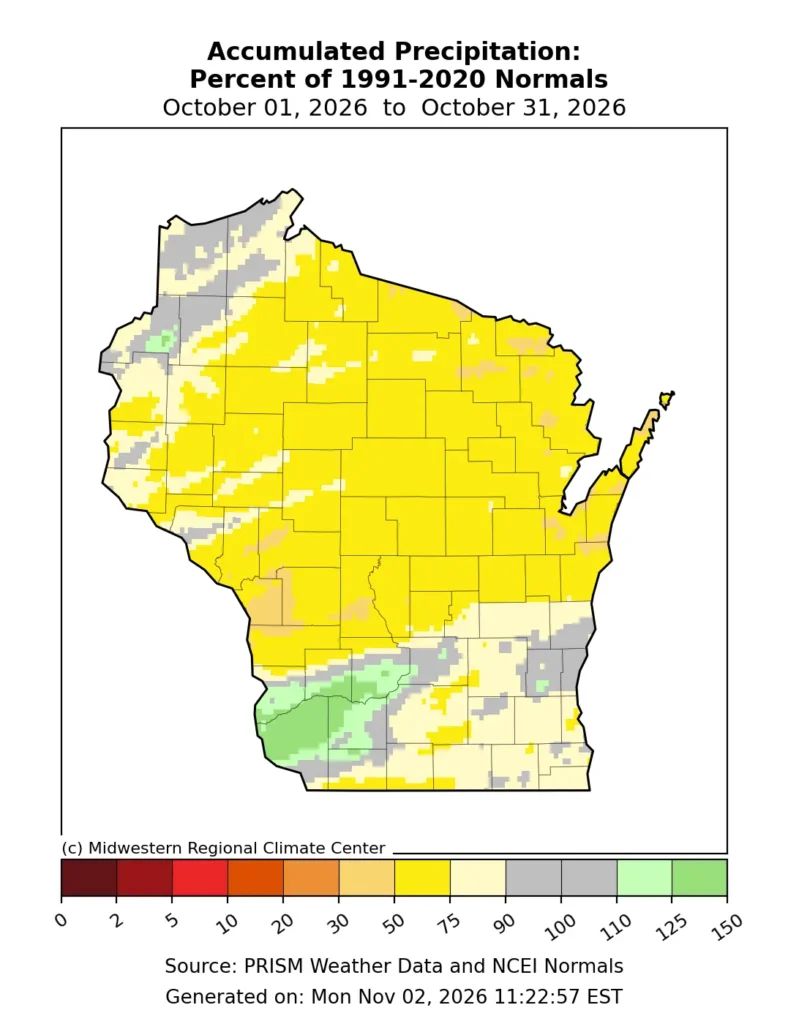
Soaking rain fell on southern and central Wisconsin on the first of the month, leaving the northern region high and dry. Numerous totals across Grant, Crawford and Richland counties exceeded two inches. Prairie du Chien (Crawford County) measured 2.34 inches, the highest 24-hour rain total in the state for the month.
Small rain systems sprinkled a few tenths of an inch across the state through the following weeks, but many places remained dry until mid-month.
A strong cold front swept through on October 15 and 16, bringing steady rain to nearly the entire state. Widespread totals ranged from a half inch to an inch, with many central counties reporting higher amounts. Northern Wisconsin finally got its share of rain, and many cities saw their largest rainfall since early summer. Minocqua (Oneida County) reported 1.20 inches of rain on the 16th, the town’s largest rainfall since June 9.
The weather turned soggy again during the final week of the month, as a slow-moving low-pressure system shifted through the region. Scattered rain showers brought anywhere from a quarter-inch to an inch of rain to the northern half of the state from October 26 through 28. The west saw the highest totals, with parts of Douglas, Burnette, Washburn, and Polk counties reporting 1.5 to two inches of rain. The most drought-stricken areas of the north received upwards of 0.5 inches.
As of the end of October, no measurable snow (0.1” or more) had fallen anywhere across the state — another indicator of the unseasonably warm conditions. While not much, the state averages 0.7 inches of snow in October.
Drought Continued to Deepen
Despite some bursts of rain during the month, drought continued to expand through northern Wisconsin. The U.S. Drought Monitor on October 6 already reflected the state’s largest exceptional drought (D4) since records began in 2000. By the end of the month, exceptional drought had spread farther east into Vilas and northern Oneida County (Figure 5). Minimal change was seen through the rest of the northern and central regions.
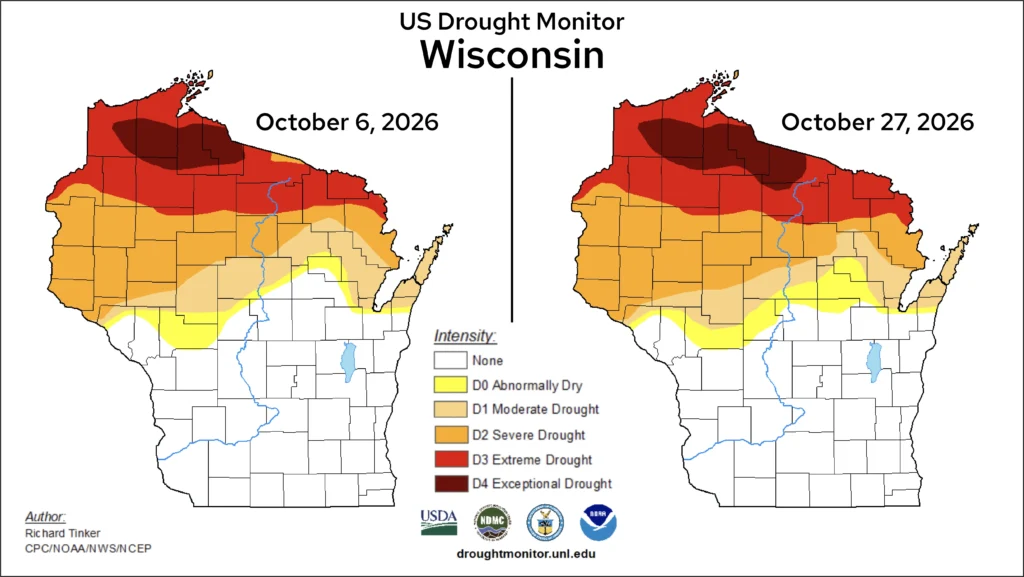
After more than six weeks of exceptional drought, impacts in the region have been compounding. The Department of Natural Resources (DNR) reported the Rainbow Flowage in Oneida County is nine feet lower than normal, creating challenges for fishers.
The Wisconsin River in particular has become low, causing the Wisconsin Valley Improvement Company, which manages the reservoir systems, to significantly reduce flow from the river (Image 1). These managers are also creating plans to conserve water levels ahead of the winter season.

On land, residents continue to report cracked soil, low feed quality for livestock, and minimal regrowth in pastures.
Dry fields during the harvest led to a high number of wildfires, especially in the northern and central regions of the state. In October, 161 wildfires burned nearly 140 acres in Wisconsin, many of which were sparked by equipment or debris burning. By comparison, only 65 wildfires burned during October 2025, but 197 burned in 2024 when drought covered the entire state.
Drought, combined with unseasonal warmth, put exceptional stress on the trees in northern and parts of central Wisconsin. Warm, dry conditions caused some trees to change leaf color early or drop their leaves altogether. The DNR noted large groups of young aspen trees had dropped their leaves by early September in some north-central counties. This limited the duration and quality of fall color spectating for Wisconsinites.
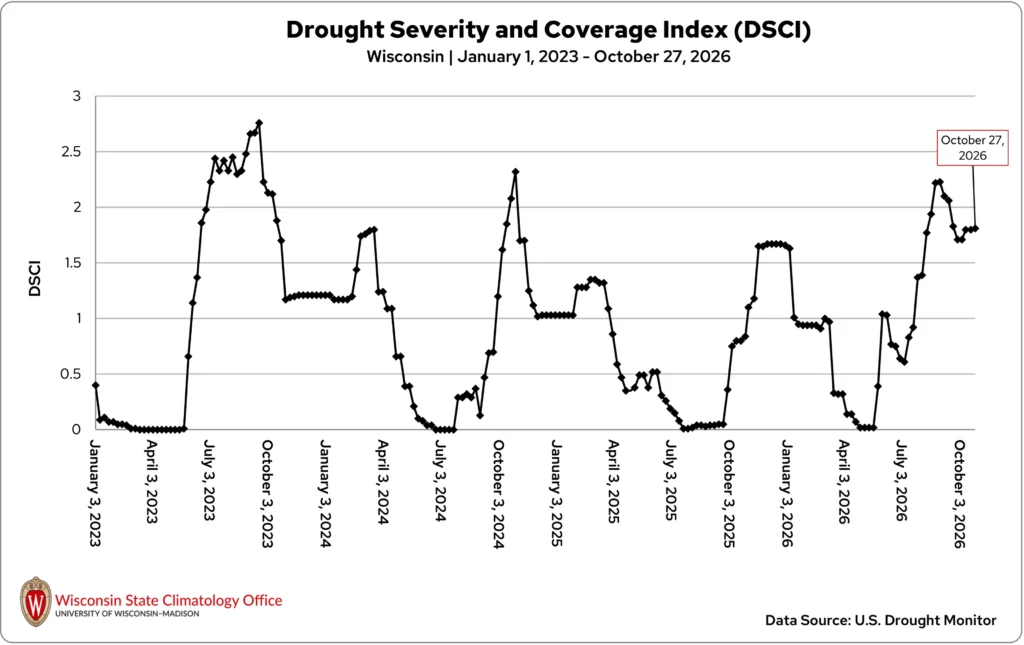
Despite the deepening drought in the north, the state’s Drought Severity and Coverage Index has generally decreased since mid-September but remains high (Figure 6). The decline is because wet conditions have resolved any remaining dryness through the southern half of the state, shrinking drought’s overall coverage.
Harvest Progress Amid Varying Conditions
The mix of wet and dry periods throughout October influenced fieldwork and harvest progress. Spurts of rain delayed fieldwork, but stretches of dry weather allowed harvest to move quickly, especially soybeans.
By late October, soybean harvest was nearly 90 percent complete statewide, though some grain quality issues were reported due to too much moisture from bouts of rainfall. Meanwhile, corn harvest for grain was nearly 50 percent complete, roughly on par with the five-year average for this time of year.
With the ongoing drought in the north, livestock producers continued to seek additional hay and grazing opportunities as dryness continued to take a toll on pasture conditions and forage availability. Despite the dryness and uncertainty about sufficient soil moisture, producers continued to plant winter wheat, with about 90 percent planted by the end of the month.
Alfalfa yields also suffered due to the persistent dryness, though reduced yields do not necessarily mean the crop is a total loss.
As cranberry growers completed harvest, some marshes got by with few disruptions while others were forced to slow or adjust operations to manage limited water for harvesting and frost protection. At least one marsh in northern Wisconsin was unable to harvest due to insufficient water.
Potatoes, pumpkins, and apples also held on through October, despite dry conditions throughout the growing season. Some producers reported impacts, such as smaller apples.
The unusually warm conditions, including warmer-than-average nighttime temperatures and a longer-than-average frost-free season, also influenced vegetation. Some southern Wisconsin residents reported gardens still producing and flowers still blooming well into October.
Climate Ed-ucation
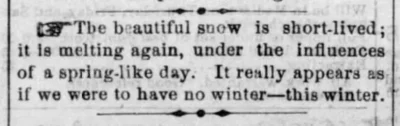
During one of the most powerful El Niño events on record, winter weather was nearly nonexistent in Wisconsin. Read more about this historic winter of 1877-78, The Year Without a Winter.
Climate Stats by Division
Color Key
-
Dark blue: Record coolest
-
Royal blue: Bottom ⅒
-
Light blue: Bottom ⅓
-
White: Normal
-
Light orange: Top ⅓
-
Orange: Top ⅒
-
Red: Record warmest
-
Dark brown: Record driest
-
Light brown: Bottom ⅒
-
Beige: Bottom ⅓
-
White: Normal
-
Light green: Top ⅓
-
Green: Top ⅒
-
Dark green: Record wettest
| Temperature (degrees Fahrenheit)
October 2026 |
Liquid-Equivalent Precip. (Inches)
October 2026 |
Liquid-Equivalent Precip. (Inches)
Nov. 1, 2025 – October 31, 2026 |
||||
|---|---|---|---|---|---|---|
| Division | Avg | Dept | Avg | Dept | Avg | Dept |
| Northwest | 52.2 :Top ⅒ | 7.3:Top ⅒ | 2.42: Normal | -0.75: Normal | 26.08: Bottom ⅓ | -6.46: Bottom ⅓ |
| North Central | 51.7 :Top ⅒ | 7.4 :Top ⅒ | 1.94: Bottom ⅓ | -1.33: Bottom ⅓ | 29.67: Bottom ⅓ | -3.70: Bottom ⅓ |
| Northeast | 51.9: Top ⅒ | 6.7:Top ⅒ | 1.84: Bottom ⅓ | -1.30: Bottom ⅓ | 31.96: Normal | -0.09: Normal |
| West Central | 55.5: Top ⅒ | 8.0:Top ⅒ | 1.71 : Normal | -1.06: Normal | 31.63: Normal | -3.23: Normal |
| Central | 55.2: Top ⅒ | 7.6:Top ⅒ | 1.91: Normal | -0.87: Normal | 36.94: Top ⅓ | 2.98: Top ⅓ |
| East Central | 55.0: Top ⅒ | 6.7:Top ⅒ | 2.01: Normal | -0.94: Normal | 35.85: Top ⅓ | 3.17: Top ⅓ |
| Southwest | 56.5: Top ⅒ | 7.3:Top ⅒ | 2.61: Normal | -0.23: Normal | 39.90: Top ⅓ | 2.27: Top ⅓ |
| South Central | 57.1: Top ⅒ | 7.4:Top ⅒ | 2.31:Normal | -0.57: Normal | 37.07: Top ⅓ | 0.38: Top ⅓ |
| Southeast | 56.8: Top ⅒ | 6.6:Top ⅒ | 2.42: Normal | -0.49: Normal | 39.52 Top ⅒ | 4.19 Top ⅒ |
| State | 54.1: Top ⅒ | 7.3:Top ⅒ | 2.11: Normal | -0.90 Normal | 32.87 Normal | -1.18 Normal |
Monthly, seasonal, and annual temperature and precipitation values and rankings published in this report are from NOAA’s National Centers for Environmental Information at the time of posting this climate summary. Values and rankings can change after publishing our climate summaries. To check the most recent values and rankings, visit NOAA’s National Centers for Environmental Information Climate at a Glance Tool.
This report is a product of the Wisconsin State Climatology Office. For questions and comments, please contact us by email (stclim@aos.wisc.edu) or phone (608-263-2374).