Every few years, the tropical Pacific Ocean warms by a degree or two, but sometimes more! This pattern, called El Niño, affects weather patterns globally. Its effects are strongest in the winter.
Ahead of the 2026 El Niño event expected to reach “super” strength, the Wisconsin State Climatology Office aimed to investigate what type of weather the state could expect as a result.
We used Pacific Ocean water temperatures to compare the strength of El Niño events to Wisconsin’s winter weather from December through February. To determine how strong these events were, we looked at the water temperatures of a region in the tropical Pacific Ocean called Niño 3.4, which is commonly used to monitor El Niño. We analyzed snowfall, snow depth, total precipitation, and temperatures from strong El Niño events that have occurred since 1950.
Determining Snowfall Trends
Snow is a natural place to start when thinking of Wisconsin winter. Figure 1 depicts statewide snowfall and ocean temperature for each winter. Red boxes represent El Niño events, and blue boxes are La Niña events (El Niño’s cool-phase counterpart). The darker the color, the stronger the event. The height of each box is determined by the spread of snowfall anomalies during winters of that event strength.
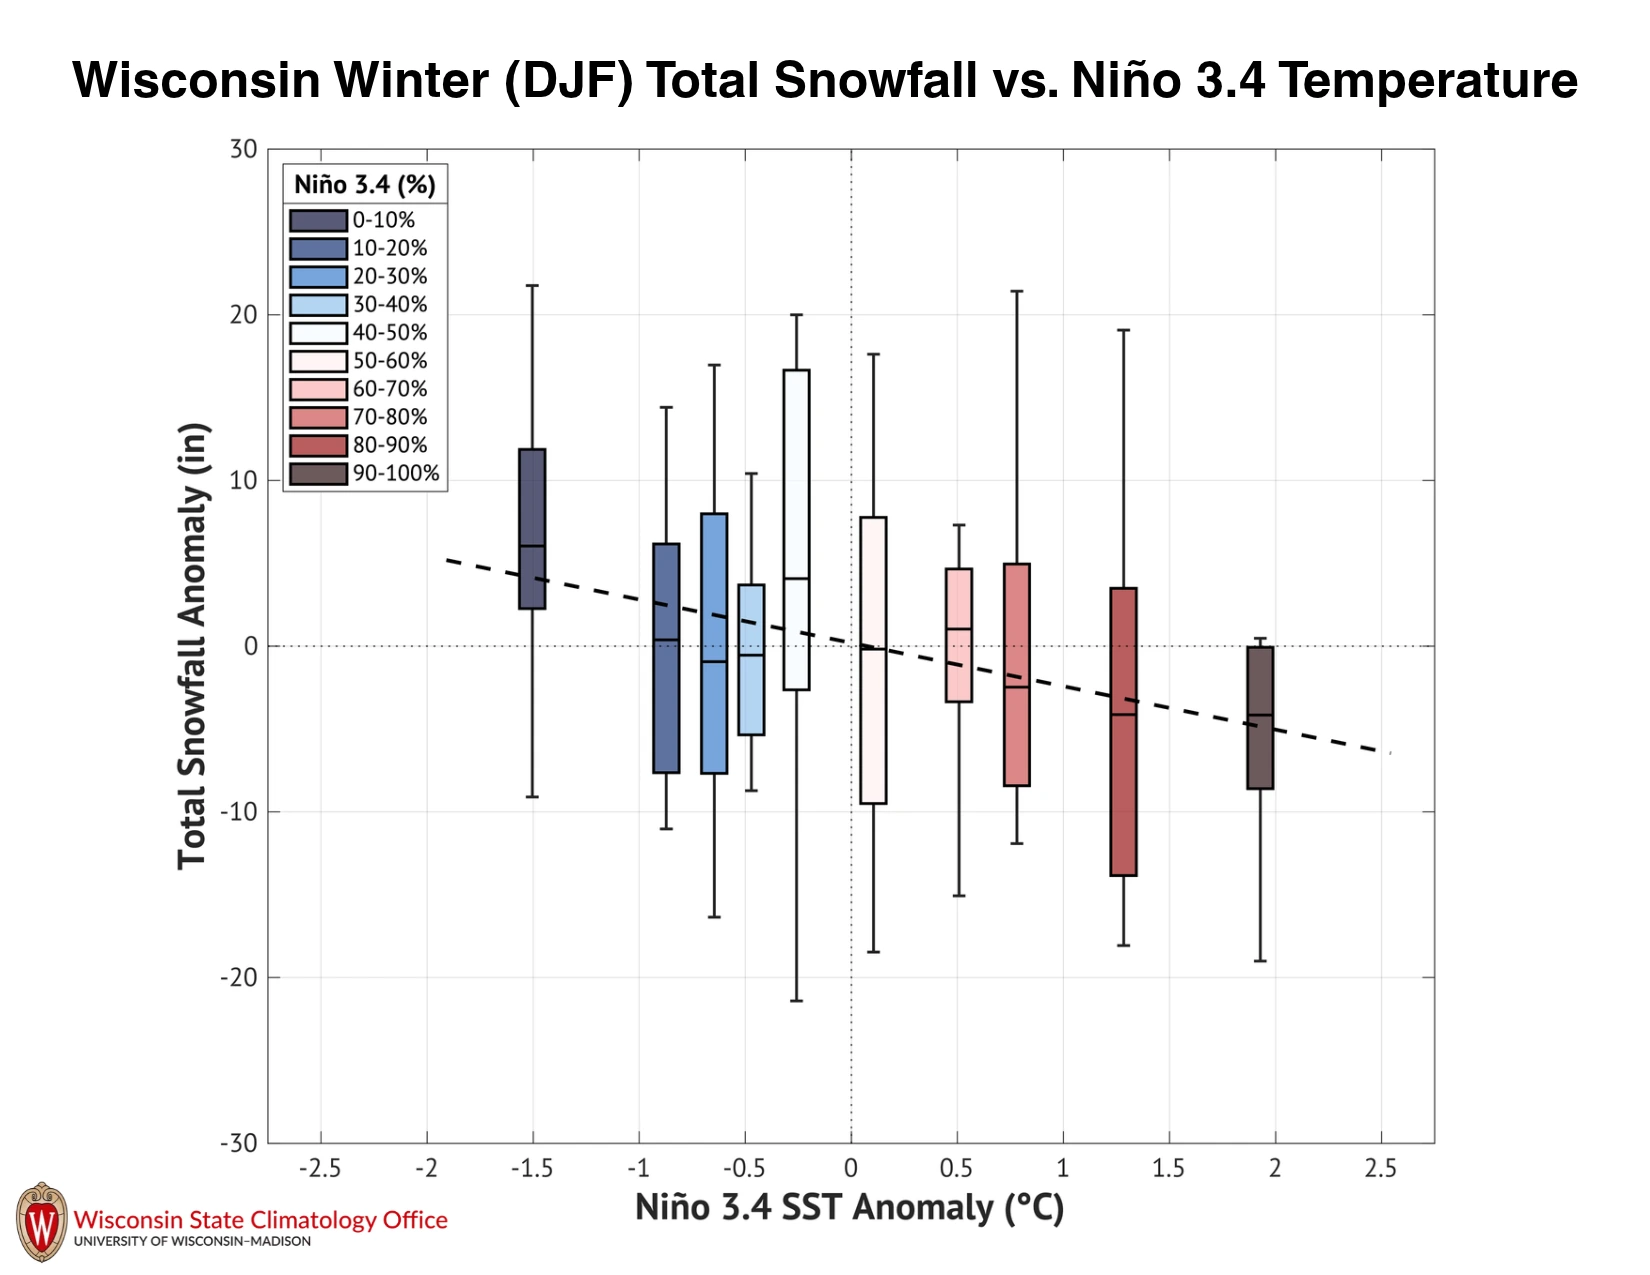
The downward-sloping dashed line indicates that the warmer the Pacific becomes, the less snow Wisconsin tends to get. Strong El Niño winters usually bring below-average snowfall, while strong La Niña winters often result in above-average snowfall. However, these results vary by event, as indicated by the “whiskers” on each box, representing the extreme anomalies.
What Does a Strong El Niño Winter Look Like in Wisconsin?
Next, we averaged the strongest events on record to see what a “typical” strong El Niño winter looks like across the state. Figure 2 shows the average of the five strongest events, while Figure 3 averages the 14 strongest. Despite this difference, the two figures tell a similar story.
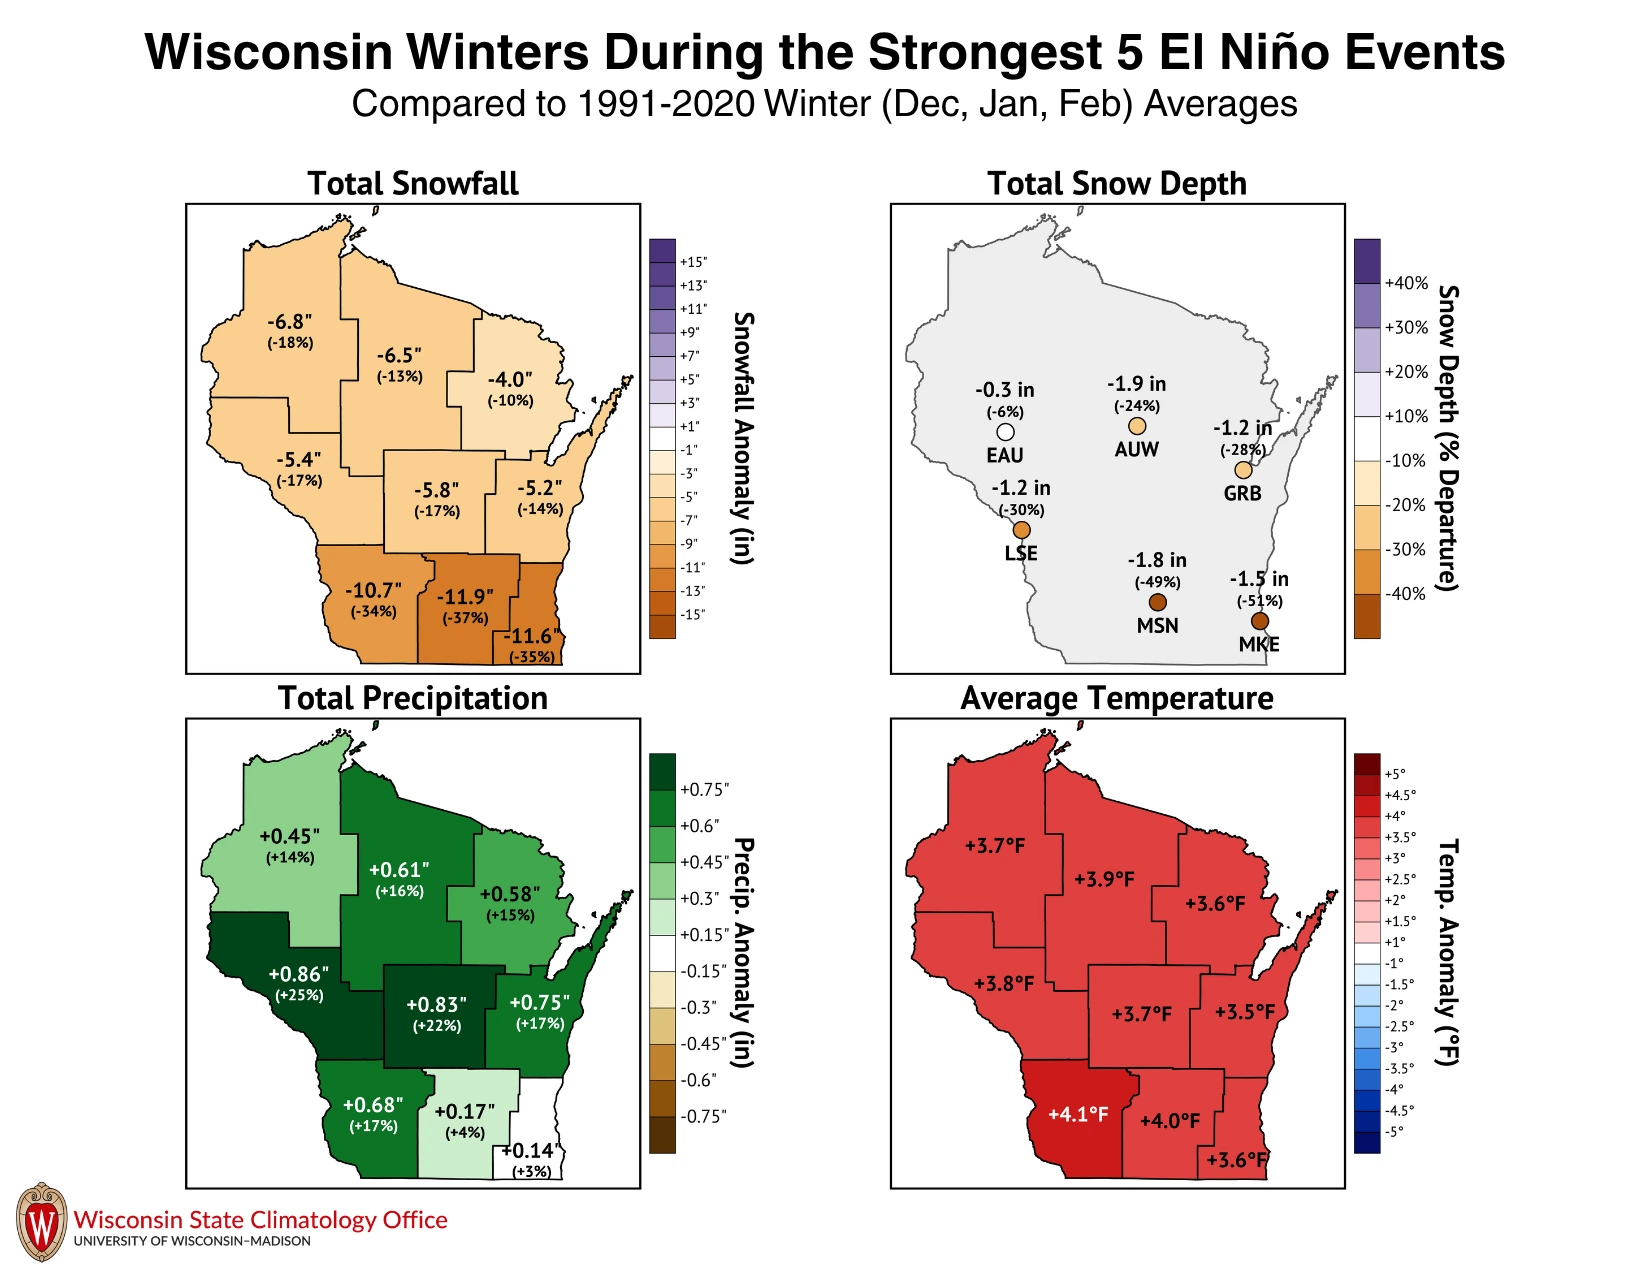
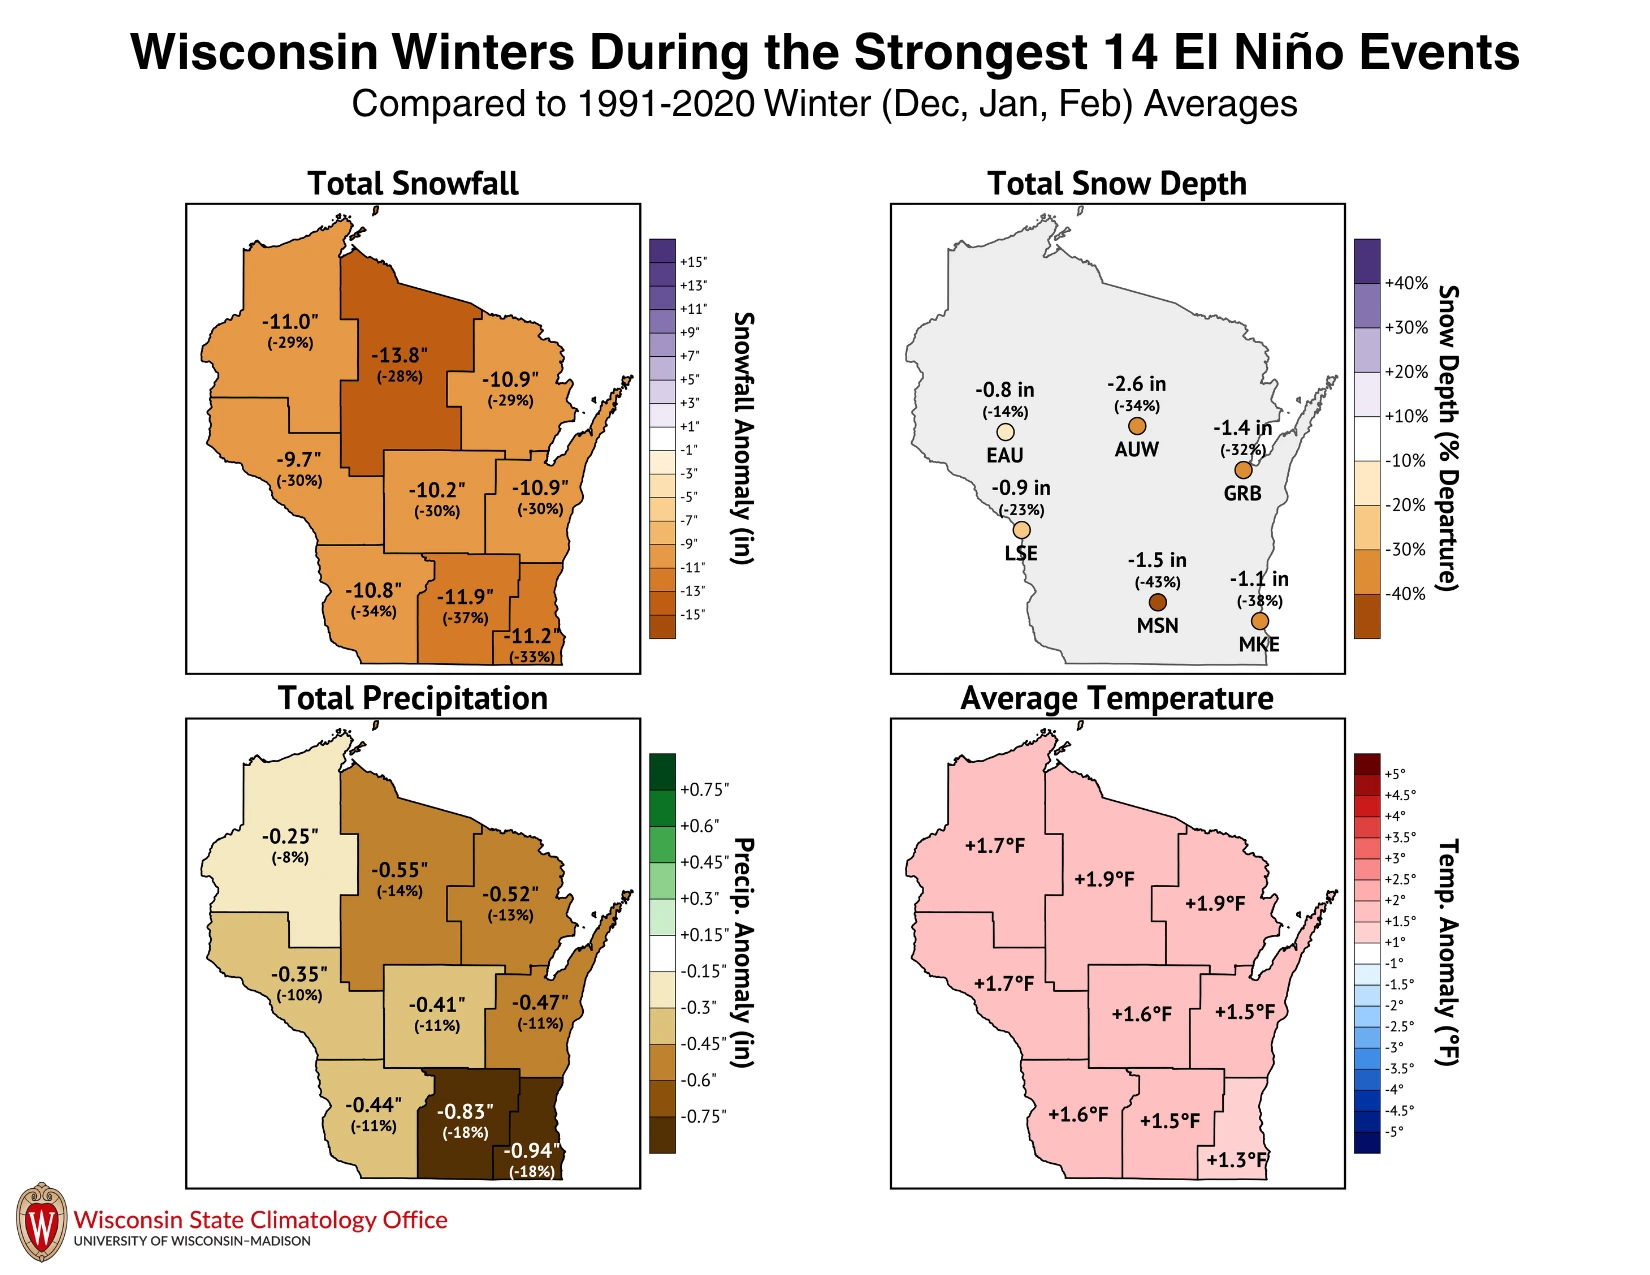
Strong El Niño events often lead to Wisconsin winters with less snowfall, thinner snowpack, and warmer temperatures compared to 1991-2020 averages. Seeing the same result from a small group of extreme events and from a larger group of events is a good sign that the pattern is a real signal and not a result of event-to-event variability. These results are statistically significant at the 95% level, meaning they are very unlikely to be a coincidence.
The one exception is total precipitation: the five strongest events averaged wetter-than-normal conditions, while the 14 strongest were drier than normal. This metric includes any winter rain and the liquid equivalent of the snow that falls. This discrepancy suggests that overall precipitation is much harder to predict depending on El Niño strength.
A Note of Caution
These research findings describe tendencies, not guarantees. The statewide maps are based on data from past winters, and every El Niño event plays out differently.
Wisconsin’s weather is also shaped by other variables, such as Arctic air masses and the random timing of individual storms. Thus, any of these can push a season in a different direction. A winter with below-average snowfall can still include a major snowstorm; a mild winter can still have stretches of bitter cold temperatures.
In other words, a strong El Niño shifts the odds toward a warmer, less snowy winter, but the forecast is never set in stone.