June was a month of drastic differences in Wisconsin. Temperatures swung from near-freezing to scorching hot, and some locations were knee-deep in floodwaters, while others were wishing for rain.
- Unseasonably cool stretches
- Isolated, large bursts of rain
- Outbreaks of severe storms
Comfortably Cool with Spikes of Heat
June continued May’s comfortably cool weather in Wisconsin, with numerous days when temperatures were five to 10 degrees below the seasonal average.
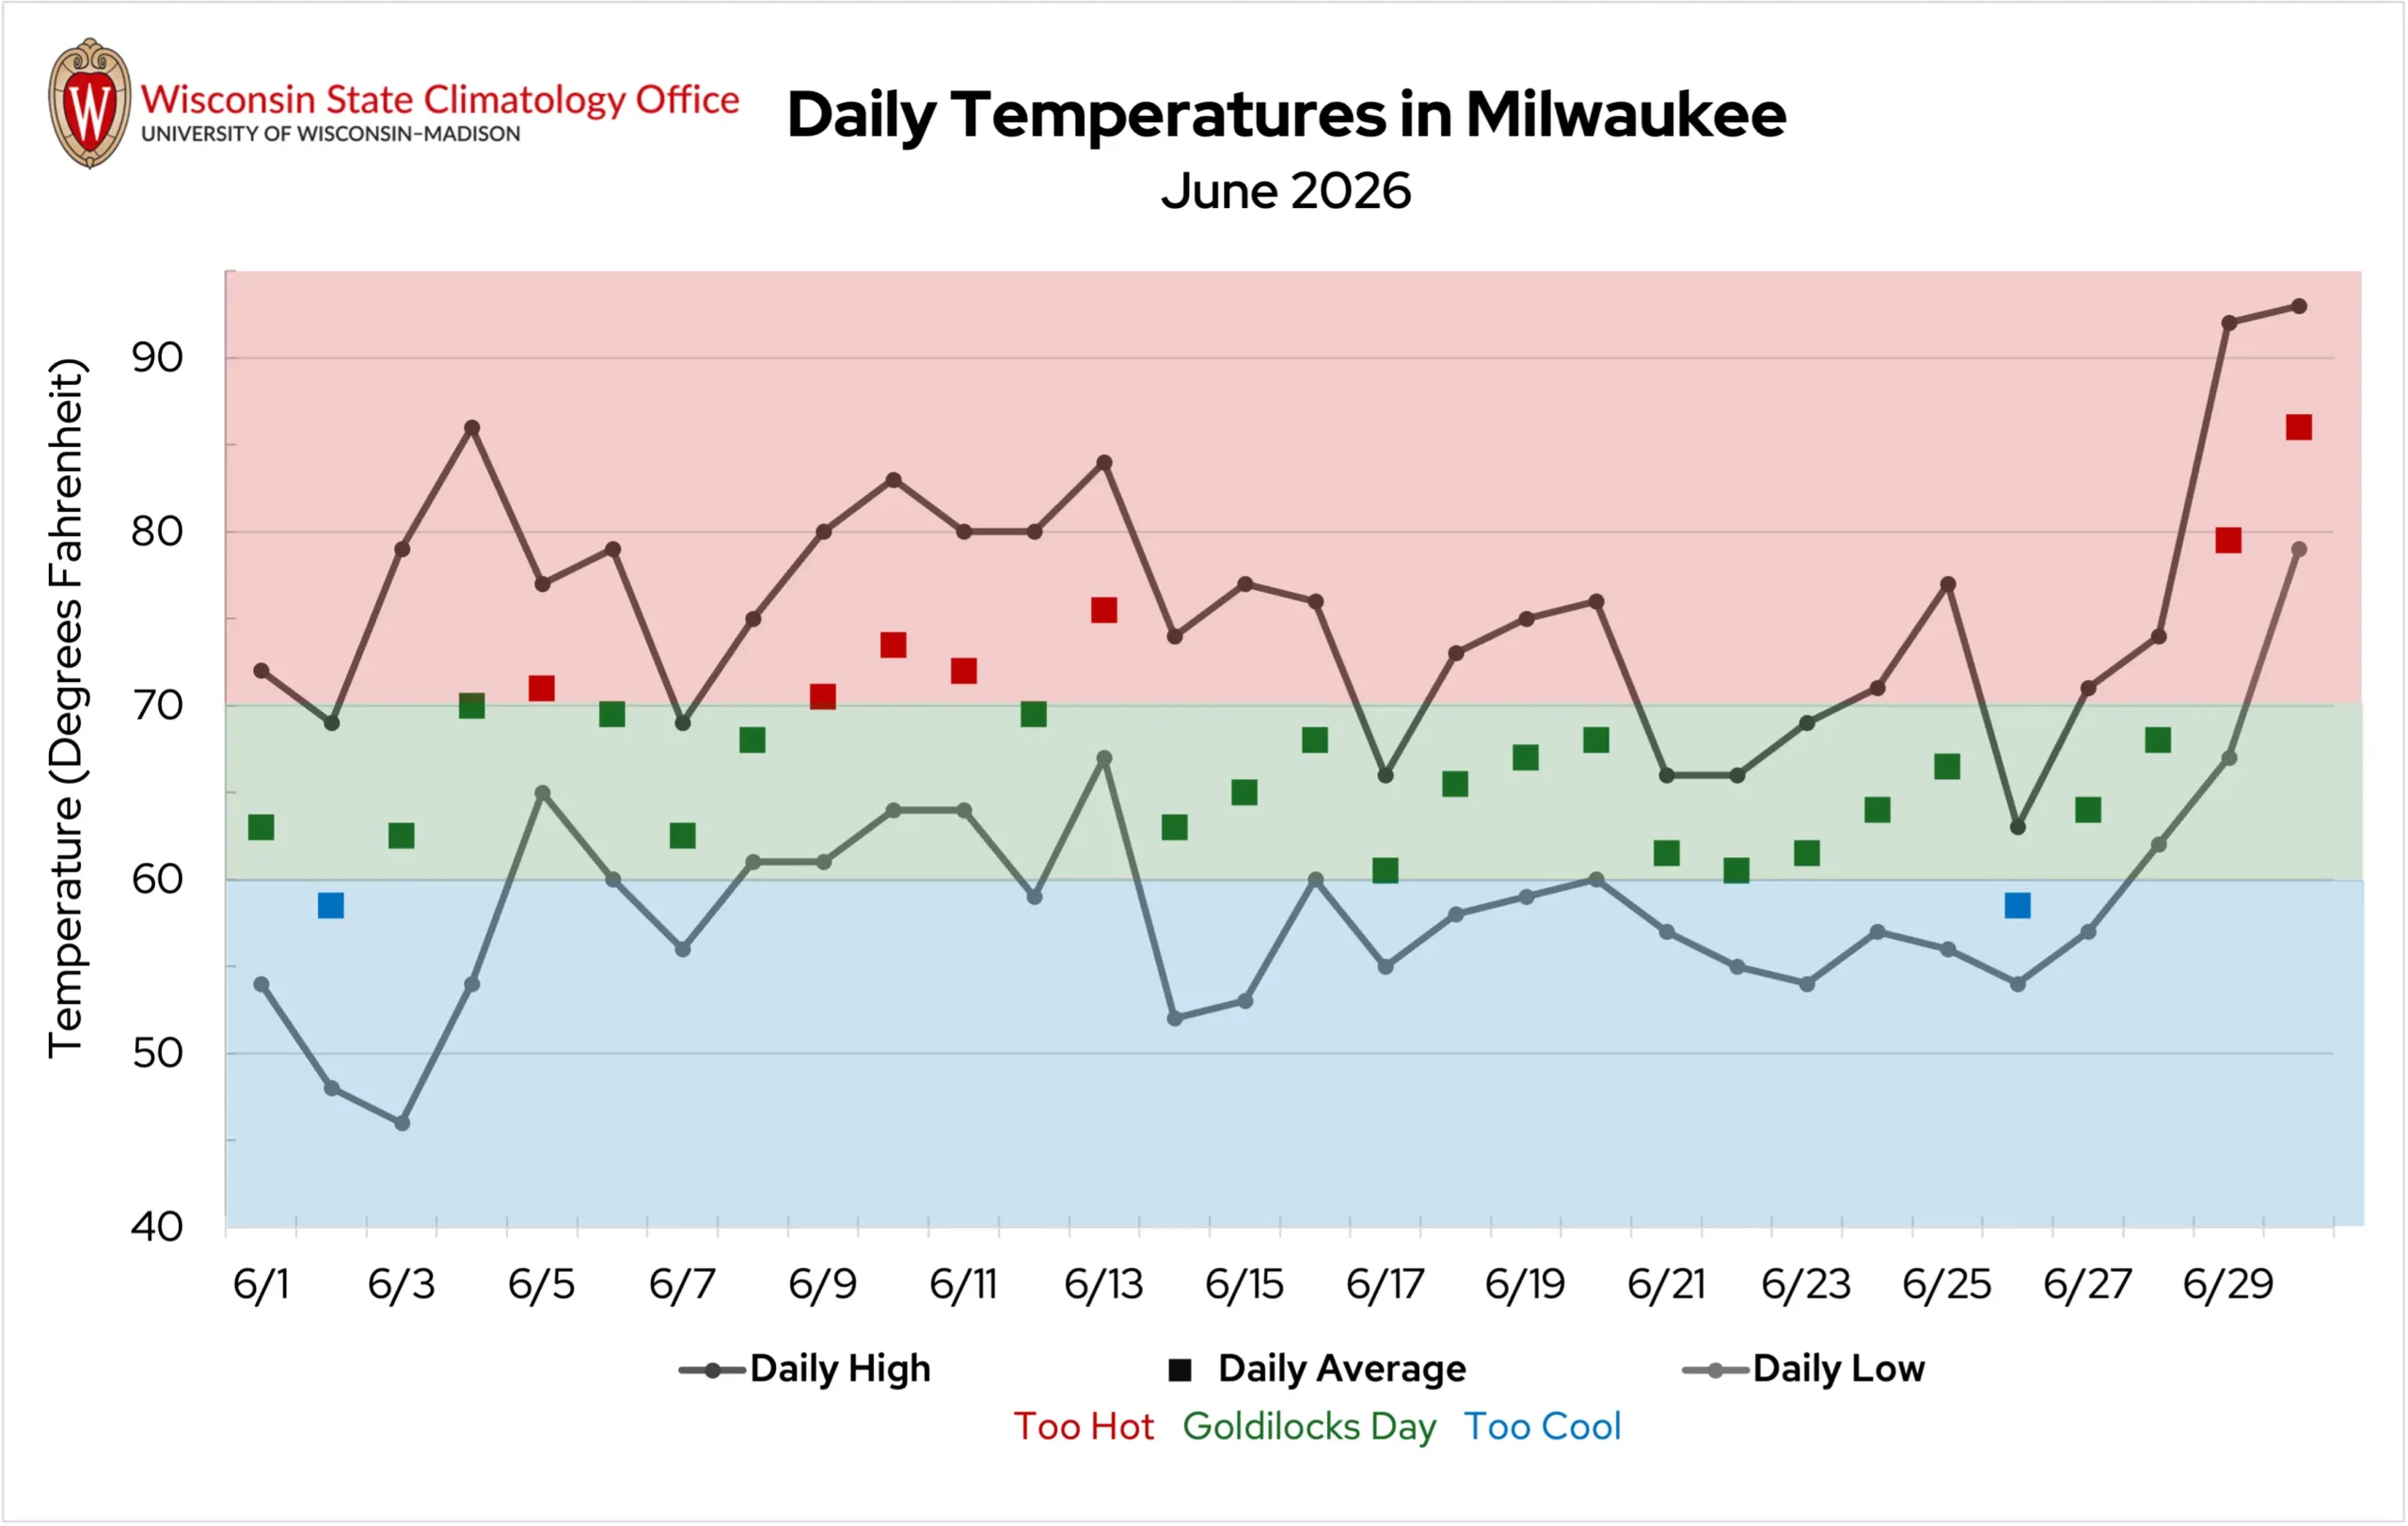
The State Climatology Office is developing a method to identify days that are optimally comfortable at a location. These “Goldilocks days” — not too hot and not too cold — have a daily average temperature between 60 and 70 degrees Fahrenheit. For example, a day with a high of 75 degrees and a low of 55 degrees would have a daily average temperature of 65 degrees — a Goldilocks day.
By this metric, 2026 was Wisconsin’s most comfortable June since 2015, with an average of 20 Goldilocks days across the state. Milwaukee experienced an especially comfortable month with 21 Goldilocks days — the city’s most in June since 1938 (Figure 1).
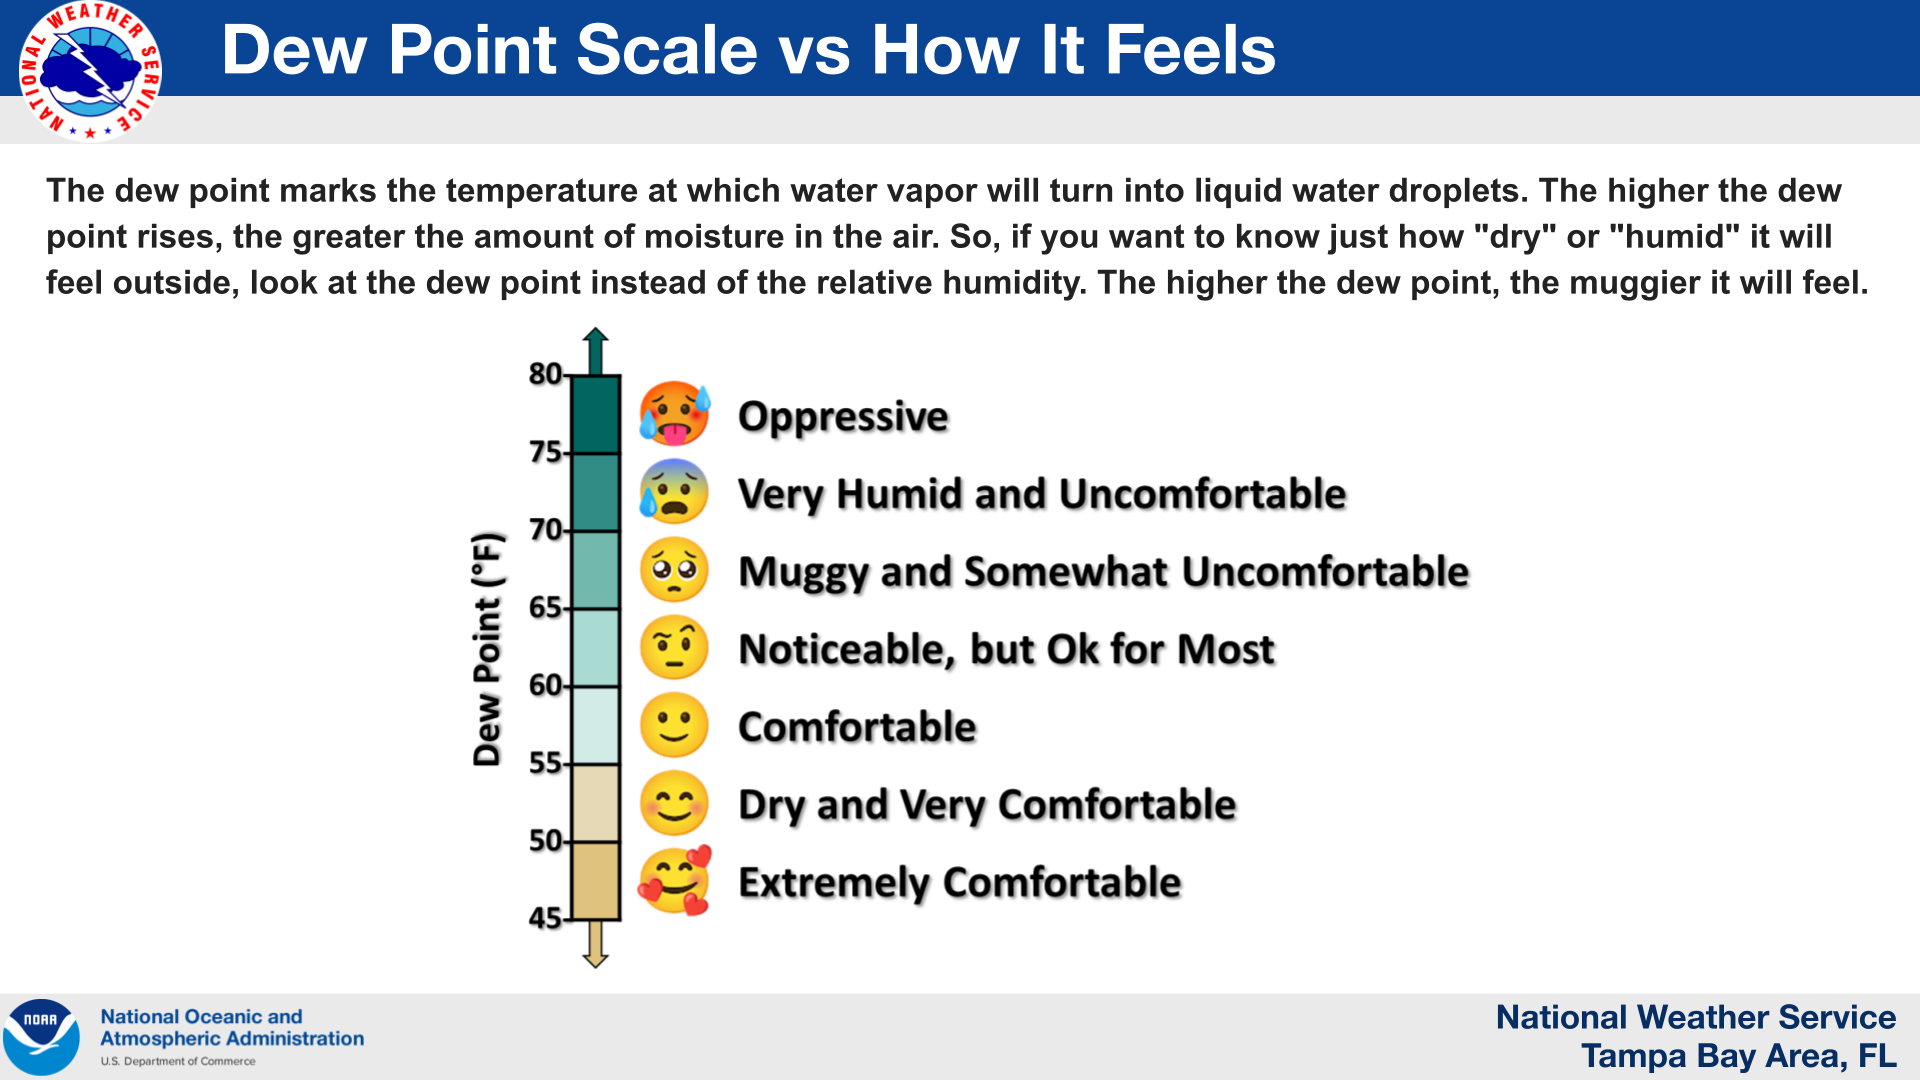
However, the month wasn’t without its sticky stretches. Humidity was high during the first week of the month, with dew point temperatures reaching the 70s. Air temperatures increased during the second week, with a few locations reaching the low 90s in southeast Wisconsin.
But cool air settled in for the middle part of the month. On June 15, temperatures fell to the upper 30s in parts of Oneida, Vilas, and Lincoln counties. The Wisconet weather station in Knight (Iron County) dropped to a chilly 34 degrees. On June 17, Eau Claire reached a high temperature of only 60 degrees, tying the daily record for coldest maximum temperature.
Wisconsinites were snapped back to reality when summer heat returned with a vengeance for the final two days of the month. A heat dome set up over the east-central United States, allowing Florida-like heat and humidity to surge northward.
As temperatures surpassed 90 degrees in many parts of the state on June 29 and 30, heat indices easily climbed above 100 degrees. The hottest heat index was 117 degrees in Marshland and Trempealeau (Trempealeau County) on June 29.
Little relief was found at night, as low temperatures remained uncomfortably warm — a trend that’s been increasing in recent decades.
On June 30, La Crosse reached a low temperature of only 81 degrees, tying the city’s record for all-time warmest low (last observed on July 4, 2012) and setting the record for warmest low temperature in June. Similarly, Wausau’s low of 78 degrees tied both the June and all-time record warmest low temperature for the city.
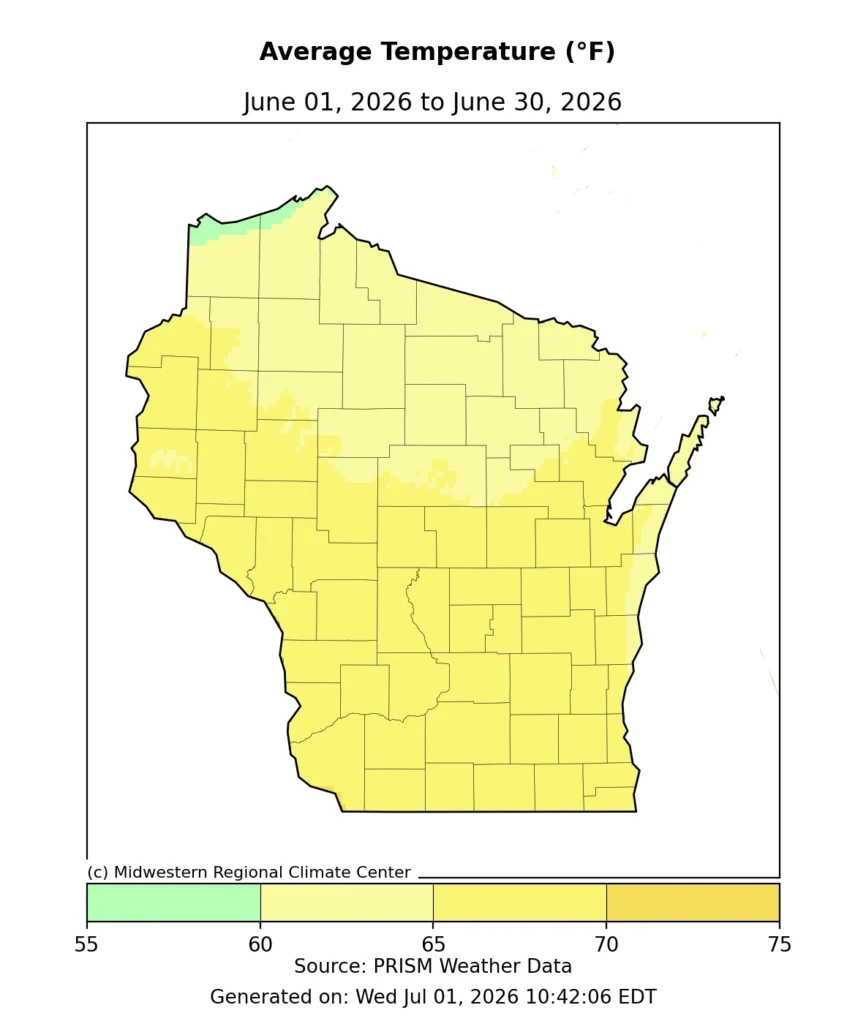
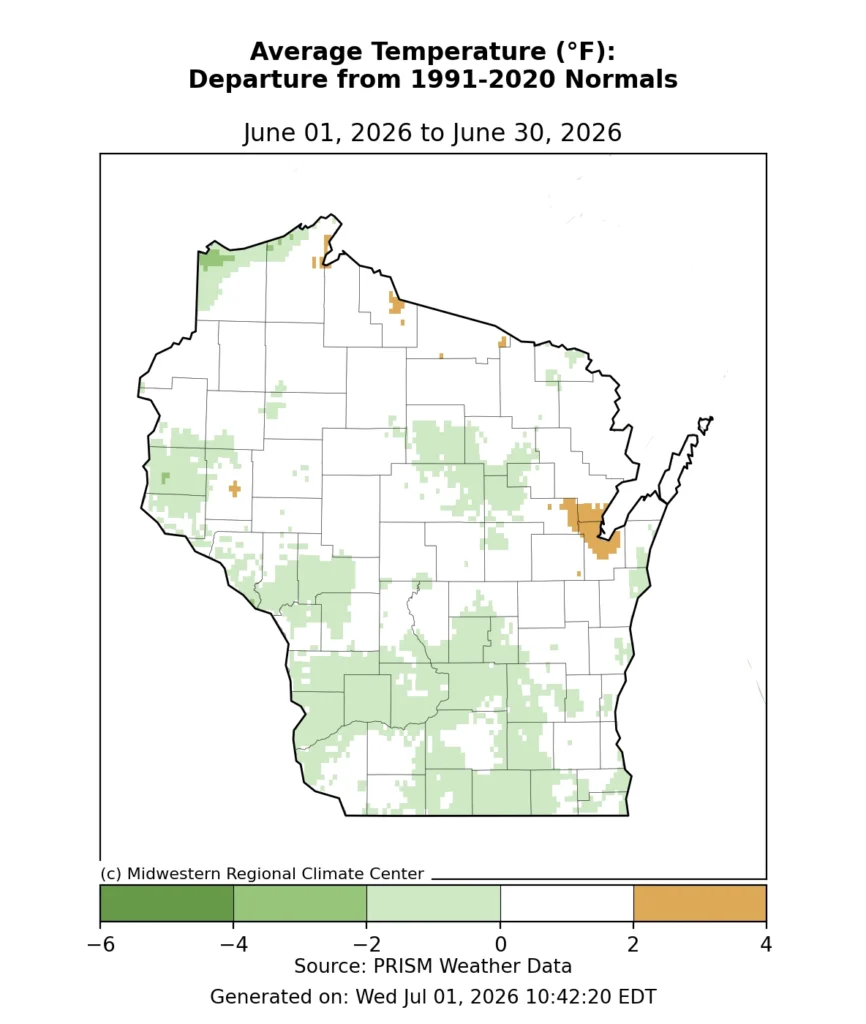
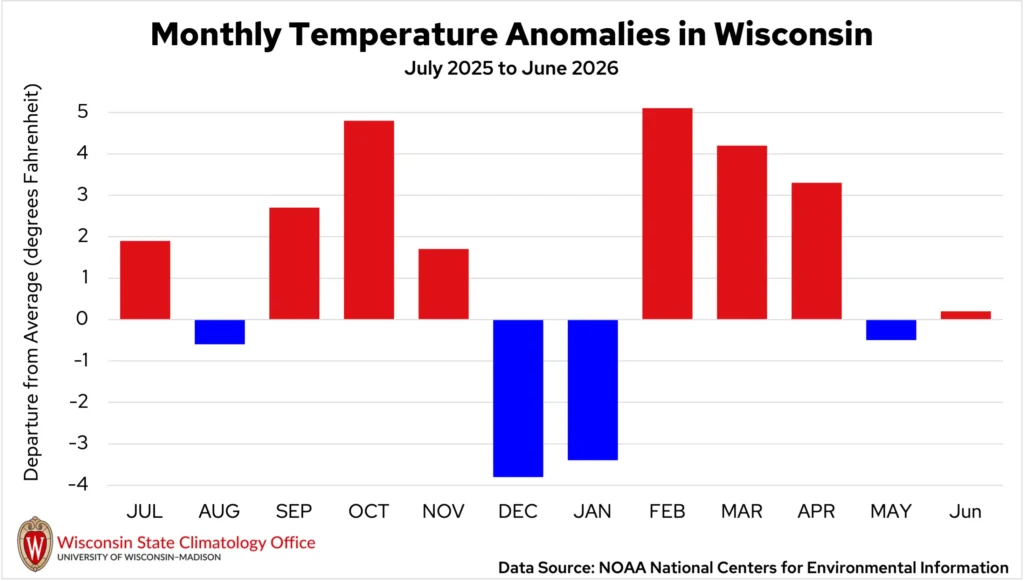
In the end, the spikes of heat beat out the prolonged cool stretches for a June statewide average temperature of 65.3 degrees, just 0.2 degrees above normal (Figure 2 and 3).
Many Left Out to Dry
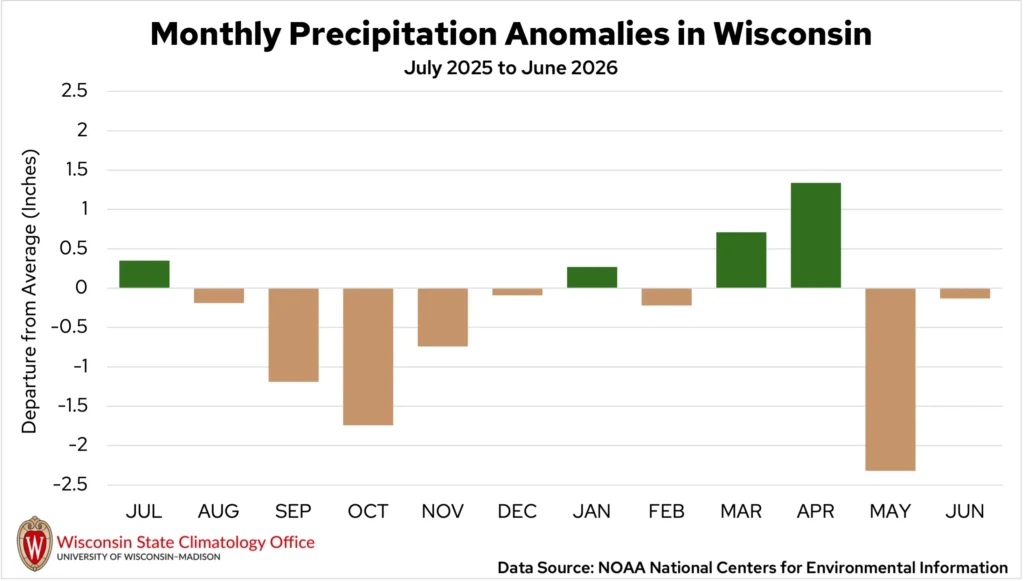
Wisconsin’s June rainfall was a case of the haves and the have-nots. Thunderstorms seemed to follow the same paths throughout the month, bringing abundant rain to isolated regions of central and southern Wisconsin, while most others were left wanting. The statewide total averaged out to 4.57 inches for the month, only 0.13 inches below normal (Figure 4).
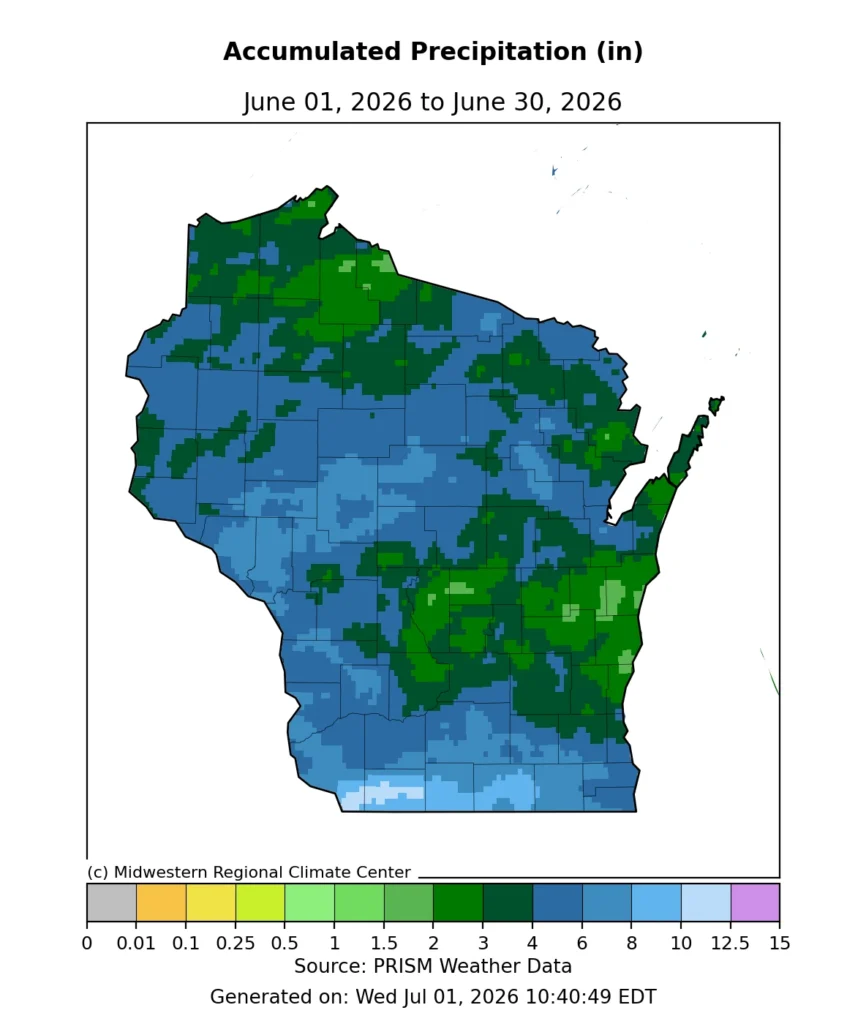
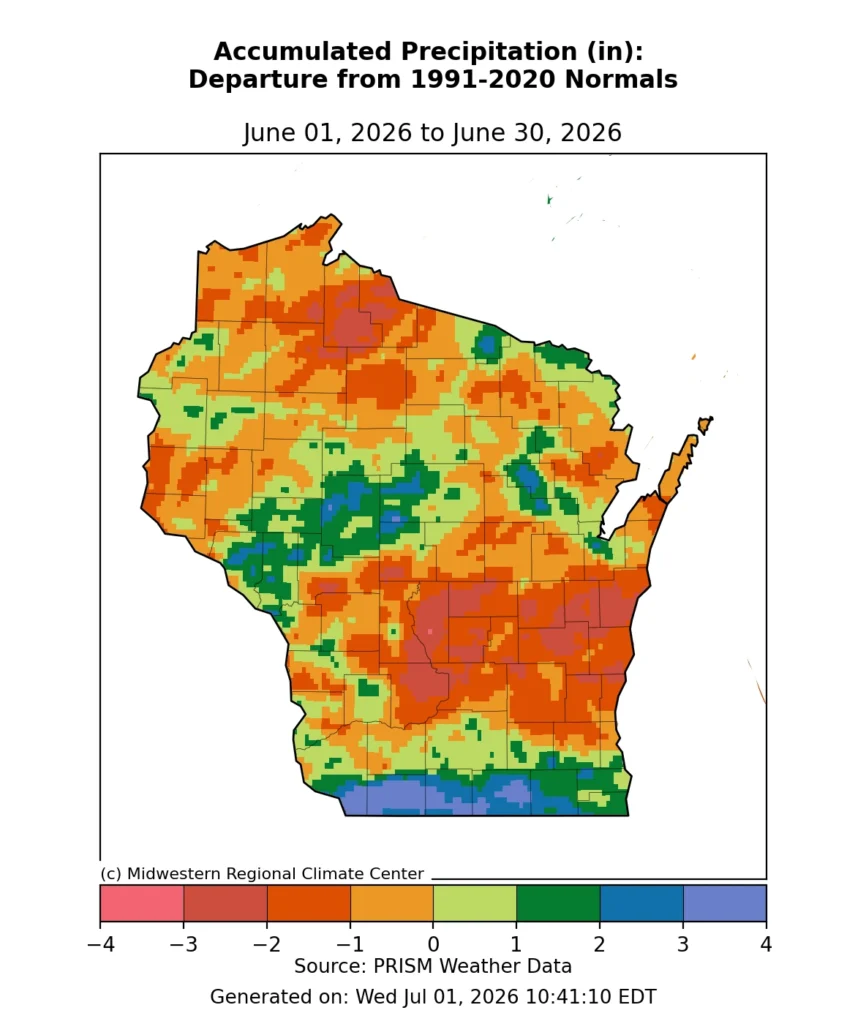
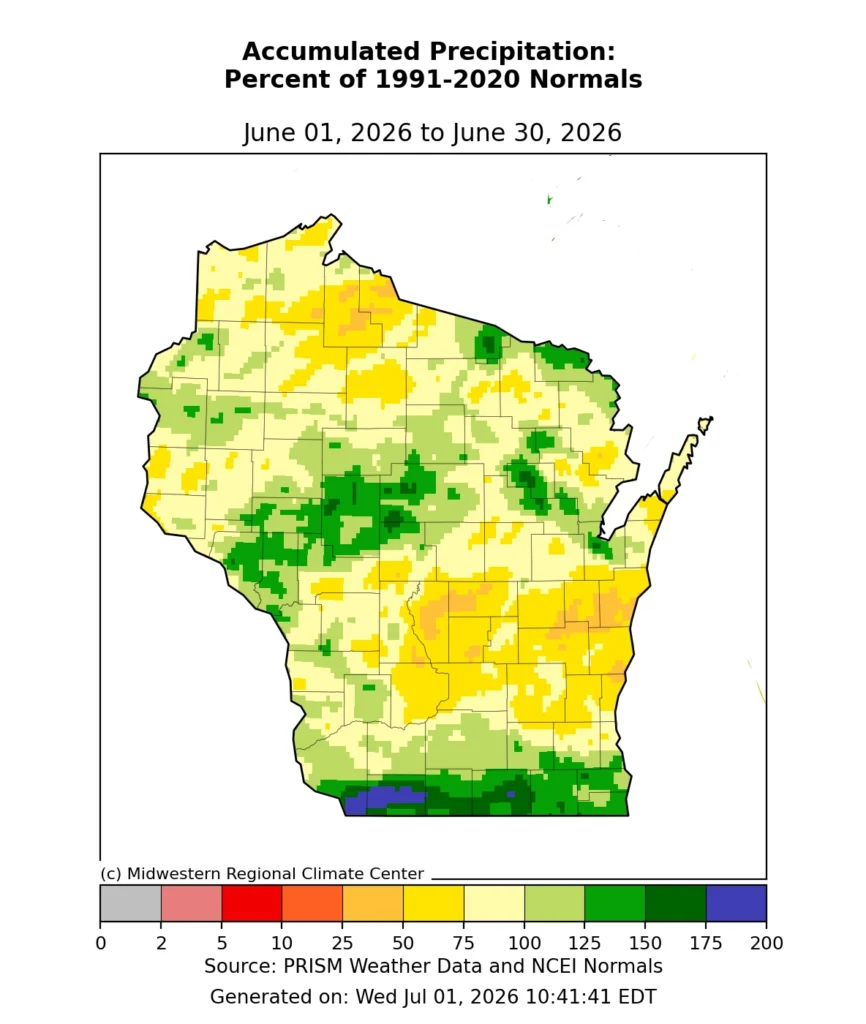
Steady showers fell across the state on June 5, with particularly intense bursts in the far southern counties. Locations in Grant, Lafayette, and Green counties picked up over two inches of rain, though isolated higher totals were seen. The Wisconet weather station in Darlington measured 5.09 inches of rain for the day!
Soggy conditions returned on June 10 through 12, with numerous rounds of thunderstorms moving through the state. After two to three inches of rain fell in central Wisconsin on June 10, there were reports of water covering roadways in the Eau Claire area. In Wausau, 2.61 inches of rain broke the city’s daily record for June 10.
Another day of steady rain arrived on June 17, accompanied by some heavier downpours from isolated thunderstorms. Totals through central and southern Wisconsin were between a half and one inch.
Rounds of showers and storms on June 24 made for an especially wet day. Steady rain fell through western and southern Wisconsin through the morning. Madison set a new daily rainfall record of 1.87 inches, surpassing the previous 1882 record of 1.49 inches.
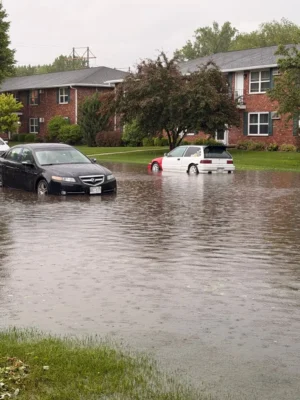
That afternoon, a line of thunderstorms passed over Brown County, dropping two to three inches of rain in just a few hours. The torrential rain caused significant flash flooding in Green Bay and Ashwaubenon. Numerous city streets were underwater, and some homes and businesses suffered significant water damage (Image 1).
On June 29, it was finally northwestern Wisconsin’s turn for a soaking. Storms and showers brought a healthy inch of rain to much of Ashland, Bayfield, and Douglas counties. This single-day rainfall doubled the region’s June precipitation totals.
Additional showers in the northeast on June 30 dropped 1.23 inches of rain in Green Bay, breaking the previous 1918 daily rainfall record by just two hundredths. With a monthly total of 6.13 inches, June 2026 was Titletown’s 11th wettest June on record.
Severe Weather Returns
After an eerily quiet May, severe weather ramped back up in June. With 183 severe thunderstorm and tornado warnings issued in the state (nearly double the monthly average), it was Wisconsin’s most active June since 2008.
Warm and humid conditions across the Midwest fueled a powerful line of storms called a derecho on June 10. One of the main characteristics of derechos is destructive winds, often exceeding 70 miles per hour. As the northern edge of the line charged through southern and central Wisconsin, multiple wind gusts of 80 to 90 miles per hour were measured. The strongest reported gust was 94 miles per hour at the Oshkosh Airport in Winnebago County.
Unsurprisingly, the winds caused widespread damage throughout the state. Along with extensive tree damage, manhole covers were blown off in Dunn County, a roof was torn from an apartment building in Iowa County, and a local landmark barn was flattened in Dodge County. The storms produced two tornadoes, one in Dodge County and one in Fond du Lac County (Table 1). The last derecho to impact Wisconsin was in July 2024.
Another outbreak of severe storms across southern Wisconsin on June 17 produced five tornadoes. A long-lived tornado developed in northeast Iowa before crossing into Crawford County, traveling for nearly 33 miles before dissipating. Widespread tree damage was seen in both Crawford and Grant counties, and some outbuildings suffered damage. In Belleville (Dane and Green counties), shingles and siding were ripped from homes, and garages were destroyed following an EF1 tornado.
| Location | Date | Enhanced Fujita (EF) Rating | Estimated Maximum Winds | Damage Reported |
| Ridgeville (Monroe Co.) | June 5 | EF0 | 75 MPH | Isolated tree damage |
| Lomira (Dodge Co.) | June 10 | EF0 | 85 MPH | Roof damage to several homes and numerous trees |
| Eden (Fond du Lac Co.) | June 10 | EF0 | 85 MPH | Damaged and uprooted trees, roof damage to a barn |
| Kenosha (Kenosha Co.) | June 11 | EF1 | 100 MPH | Significant damage to barns and several large trees |
| West of Boscobel (Crawford Co.) | June 17 | EF2 | 115 MPH | Widespread tree damage, some power poles snapped, minor damage to residential buildings |
| Boscobel (Grant Co.) | June 17 | EF1 | 105 MPH | Significant tree damage and some heavily damaged outbuildings |
| Ridgeway (Iowa Co.) | June 17 | EF1 | 105 MPH | Destroyed metal shed and tree damage |
| Argyle (Lafayette Co.) | June 17 | EF0 | 65 MPH | Broken tree limbs |
| Belleville (Dane Co.) | June 17 | EF1 | 110 MPH | Significant damage to garages, shingles, and siding pulled from several homes |
| Osseo (Trempealeau Co.) | June 19 | EF0 | 80 MPH | Some damage to trees and sheds |
| Merrillan (Jackson Co.) | June 19 | EFU | Unknown | Photo evidence of a brief tornado, but no damage observed |
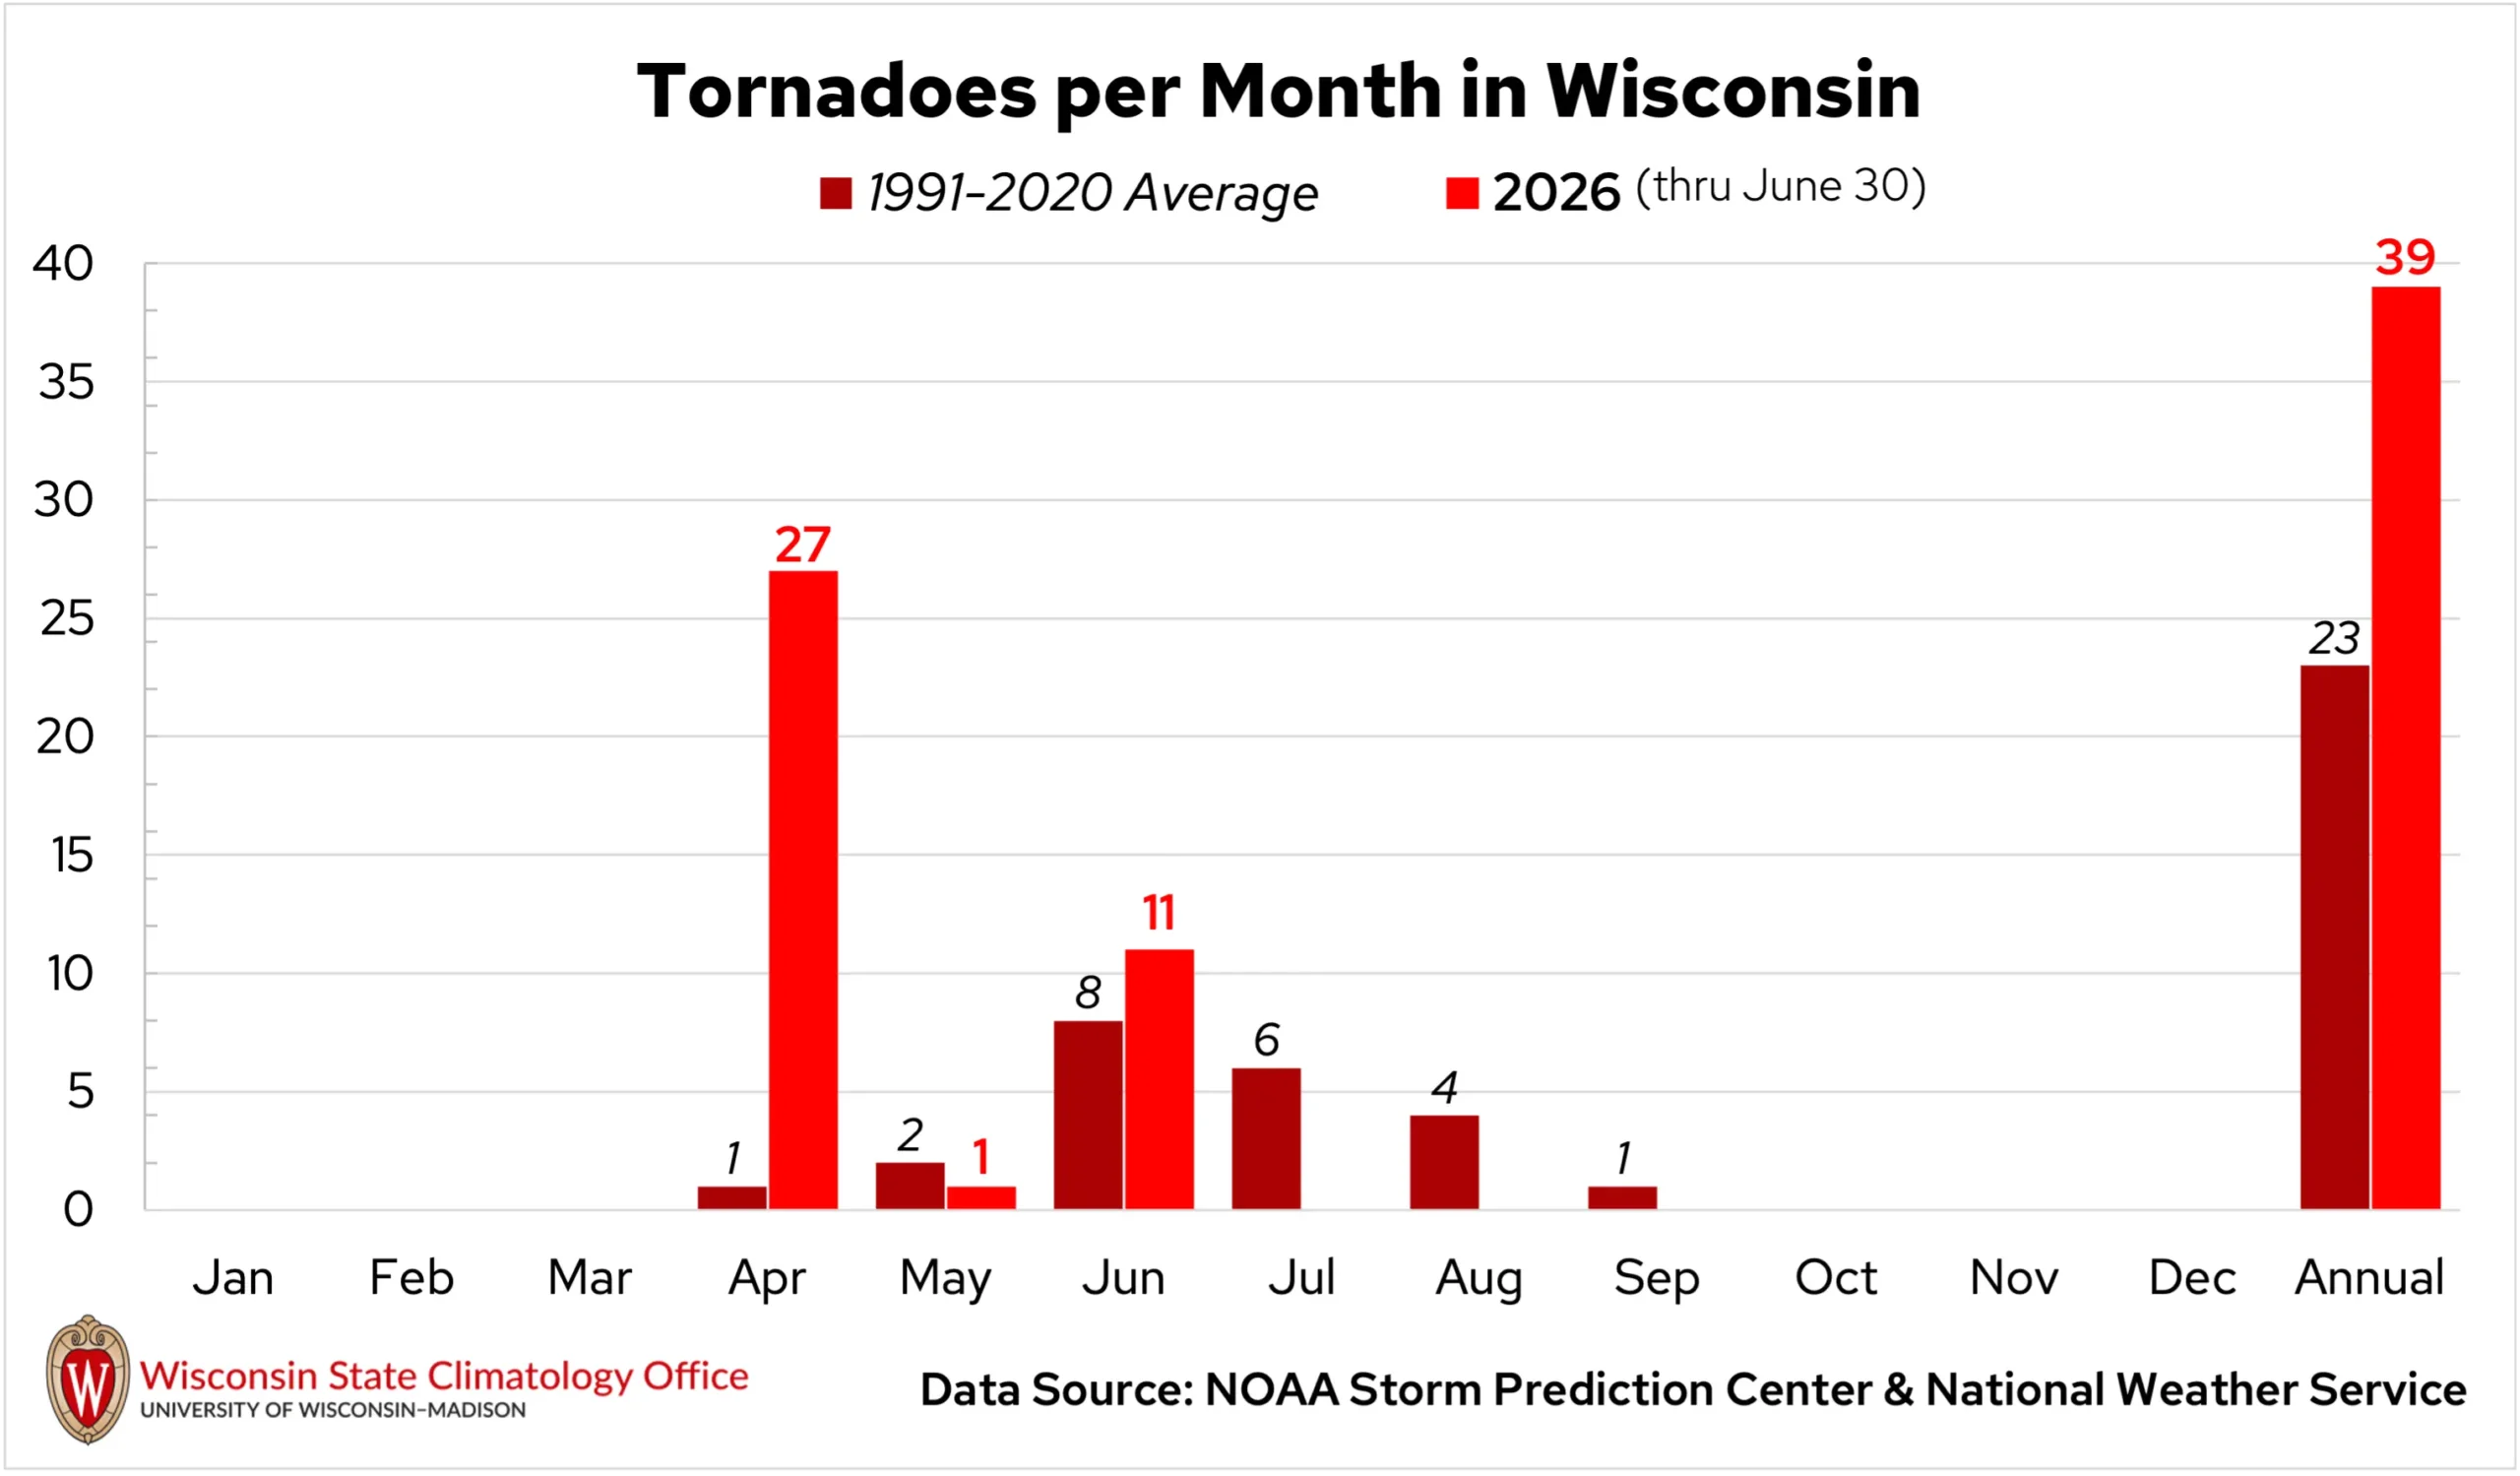
In all, 11 tornadoes crossed through Wisconsin in June, three more than the 30-year average for the month. This brings the state’s 2026 tornado count to 39, equal to the number that occurred in all of 2025 and 16 more than the annual average (Figure 6).
Some Drought Relief
On the tail of Wisconsin’s fourth driest May on record, drought concerns were high to start June. Concerns eased as rain began to develop in the state over the first few weeks of the month.
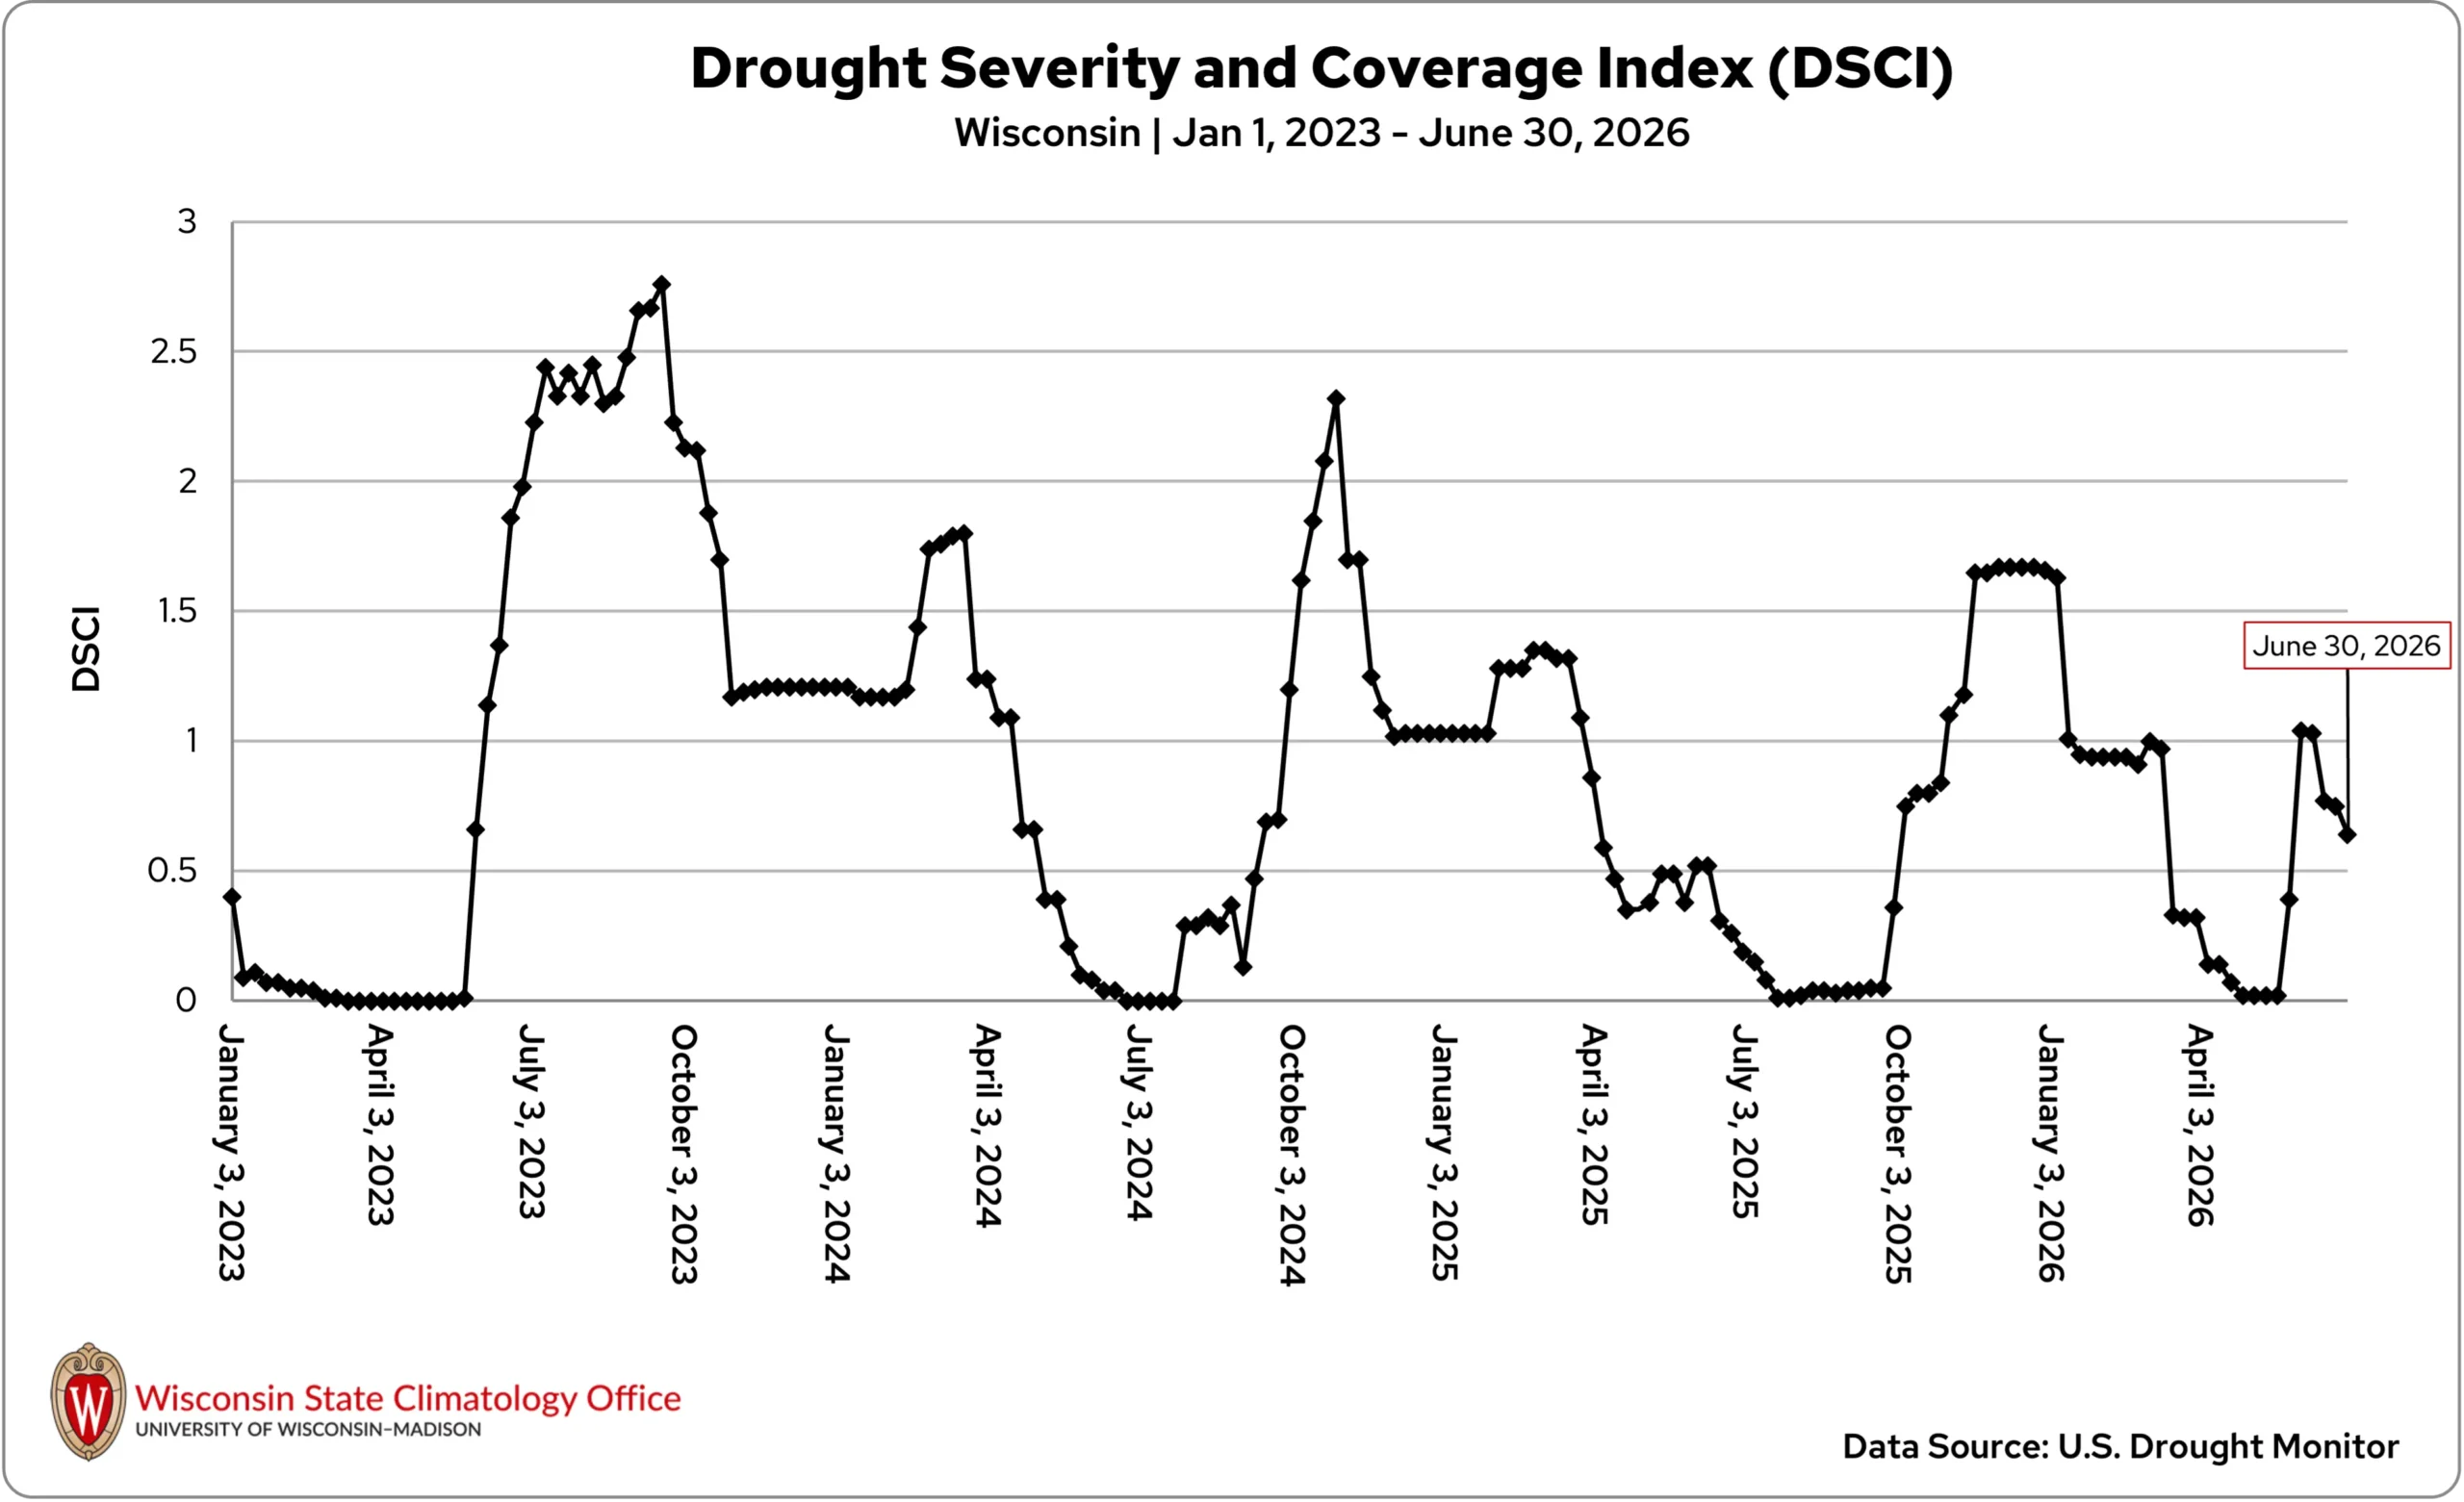
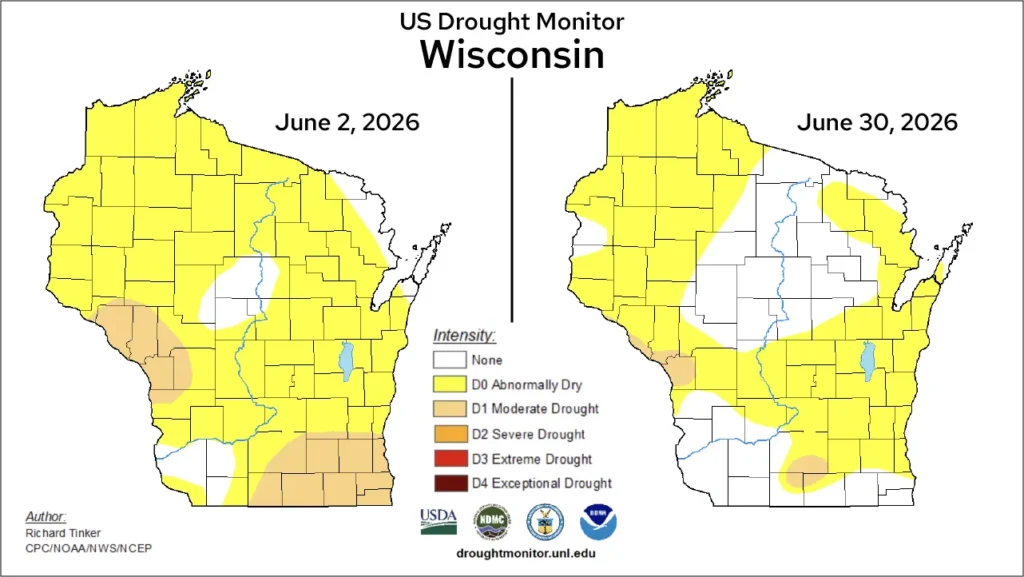
Rounds of thunderstorms through central Wisconsin mid-month greatly reduced the coverage of abnormally dry conditions (D0) and relieved some moderate drought (D1) in the southeast. The state’s Drought Severity and Coverage Index decreased by 0.26 between June 9 and 16 (Figure 7).
By month’s end, only small areas of moderate drought remained in portions of Dane, Rock, and Green counties and in parts of La Crosse, Trempealeau, and Buffalo counties (Figure 8).
Challenges Emerge for Fruit Growers
The 2026 growing season has posed challenges to Wisconsin’s agriculture. Wild swings in precipitation during April, May, and June took their toll on the soil. Depending on the region of the state and the type of soil, many fields were either unable to absorb June’s large bursts of rainfall or were eroded due to round after round of rain.
After strawberry growers battled root diseases during a wet April and worked to protect blooms from April and May frosts, conditions varied across the state at strawberry farms by harvest time in June. Some farms reported a healthy crop, while others were unable to offer pick-your-own strawberries.
Similarly, as cherry season approaches in July, Wisconsin is estimated to have lost 40 to 50 percent of its tart cherry crop to late April and May frosts, after early-to-mid April warmth caused trees to bloom early.
Wisconsin’s apple crop has also faced challenges. Freeze injury to the fruit from late April to late May has become more apparent as it matures. Warm Belly Farm estimates that its Jefferson County orchards have about 20 to 25 percent cropload compared to the previous several seasons. Fortunately, some mid- to late-season varieties are faring better, with around 50 percent cropload.
Climate Ed-ucation
One of the many features of Wisconsin’s interesting climate is the large swings in seasonal weather. Whether it’s a deluge of rain or a foot of snow, all types of precipitation are important for Wisconsin’s ecosystems, agriculture, and recreation. Read more about the role of these seasonal precipitation variations in our latest Climate Ed-ucation blog.
Climate Stats by Division
Color Key
-
Dark blue: Record coolest
-
Royal blue: Bottom ⅒
-
Light blue: Bottom ⅓
-
White: Normal
-
Light orange: Top ⅓
-
Orange: Top ⅒
-
Red: Record warmest
-
Dark brown: Record driest
-
Light brown: Bottom ⅒
-
Beige: Bottom ⅓
-
White: Normal
-
Light green: Top ⅓
-
Green: Top ⅒
-
Dark green: Record wettest
| Temperature (degrees Fahrenheit)
June 2026 |
Liquid-Equivalent Precip. (Inches)
June 2026 |
Liquid-Equivalent Precip. (Inches)
Nov. 1, 2025 – June 30, 2026 |
||||
|---|---|---|---|---|---|---|
| Division | Avg | Dept | Avg | Dept | Avg | Dept |
| Northwest | 63.6 :Normal | 0.1Normal | 4.14: Normal | -0.23: Normal | 16.64: Normal | -1.02: Normal |
| North Central | 63.9 :Top ⅓ | 0.9 :Top ⅓ | 4.46: Normal | -0.04: Normal | 20.51: Top ⅓ | 1.86: Top ⅓ |
| Northeast | 63.8: Top ⅓ | 0.9:Top ⅓ | 5.09: Top ⅓ | 0.88: Top ⅓ | 22.84: Top ⅒ | 4.71: Top ⅒ |
| West Central | 66.6: Normal | 0.0:Normal | 4.72 : Normal | -0.36: Normal | 18.24: Normal | -1.59: Normal |
| Central | 66.2: Normal | 0.1:Normal | 3.73: Normal | -1.04: Normal | 22.01: Top ⅓ | 2.23: Top ⅓ |
| East Central | 65.3: Normal | 0.2:Normal | 3.34: Normal | -0.98: Normal | 21.58: Top ⅓ | 2.18: Top ⅓ |
| Southwest | 67.0: Normal | -0.7:Normal | 5.82: Top ⅓ | -0.30: Top ⅓ | 22.93: Top ⅓ | 0.74: Top ⅓ |
| South Central | 67.5: Normal | -0.2:Normal | 5.45:Top ⅓ | -0.19: Top ⅓ | 21.80: Top ⅓ | -0.19: Top ⅓ |
| Southeast | 66.9: Normal | 0.2:Normal | 4.74: Top ⅓ | 0.14: Top ⅓ | 23.46 Top ⅓ | 1.84 Top ⅓ |
| State | 65.3: Normal | 0.2:Normal | 4.57: Normal | -0.13 Normal | 20.52 Top ⅓ | 1.01 Top ⅓ |
Monthly, seasonal, and annual temperature and precipitation values and rankings published in this report are from NOAA’s National Centers for Environmental Information at the time of posting this climate summary. Values and rankings can change after publishing our climate summaries. To check the most recent values and rankings, visit NOAA’s National Centers for Environmental Information Climate at a Glance Tool.
This report is a product of the Wisconsin State Climatology Office. For questions and comments, please contact us by email (stclim@aos.wisc.edu) or phone (608-263-2374).