October featured a little bit of everything across Wisconsin. Most notable was the precipitation that finally eased our state’s drought conditions, but the month was also marked by warmer-than-average temperatures that contrasted with a winter-like Halloween that included several inches of snow in some areas.
A Wet Month — Finally!
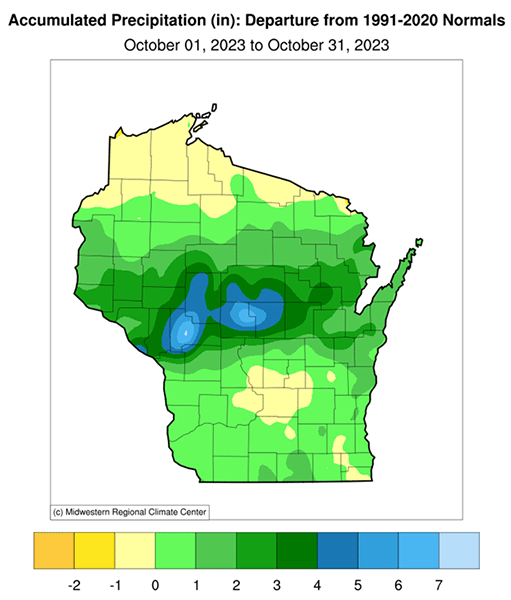
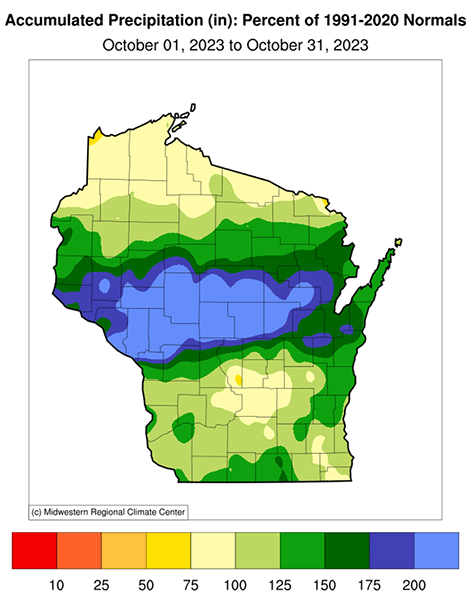
Our wet October was a welcome relief after months of major drought. The 4.14 inches of statewide-averaged precipitation during the month was 1.13 inches (38 percent) above the 1991-2020 normal. The wettest anomaly was concentrated in the north-central part of Wisconsin, stretching almost statewide from the Mississippi River to Green Bay. This band received greater than 150 percent of normal precipitation, and many areas more than doubled their normal amounts. The very largest excesses struck Jackson, Wood, and Portage Counties, which recorded more than 5 inches during the month. By contrast, most of the northern tier of counties actually had slight precipitation deficits, along with scattered areas in south-central and southeastern Wisconsin.
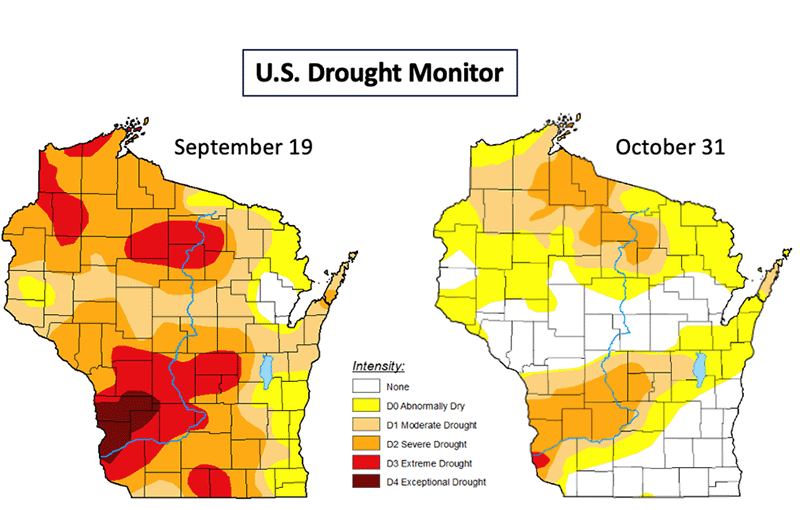
The hydrologic turnaround began in late September and continued throughout the following month. The dramatic improvement in drought conditions is illustrated by the U.S. Drought Monitor at the peak of the drought in mid-September versus the end of October. The vast majority of Wisconsin showed much improved conditions, dropping one or two categories in drought intensity. By the end of October, about half the state no longer fell into any warning category, not even the “abnormally dry” precursor.
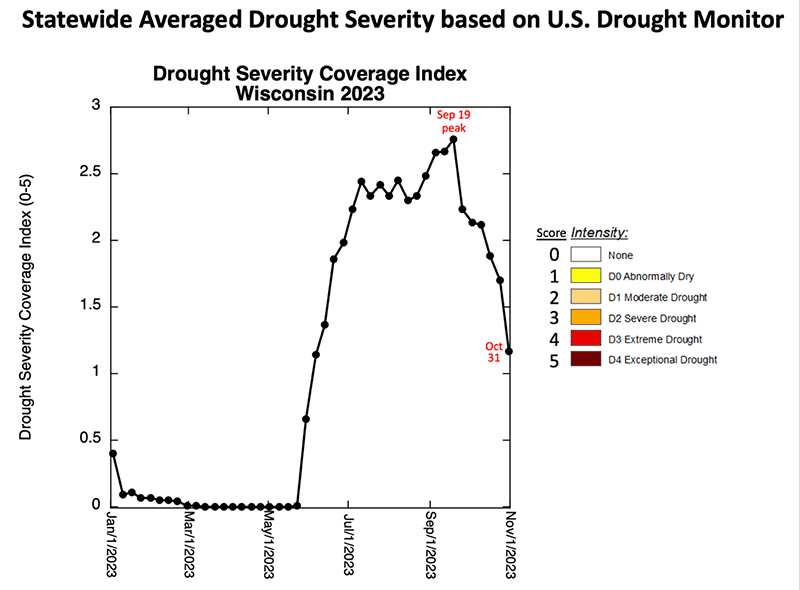
This alleviation of drought can also be tracked using the Drought Severity Coverage Index (DSCI), reported each week by the U.S. Drought Monitor. The DSCI is the weighted spatial average of all five drought categories across the state, after assigning a score to each. The weakest category (D0, “abnormally dry”) receives a score of one, D1 (moderate drought) a two, D2 (severe drought) a three, D3 (extreme drought) a four, and D4 (exceptional drought) a five.
As depicted below, the Wisconsin DSCI reached its peak for the year on September 19 at 2.76, which means that the statewide average drought condition ranged between moderate and severe drought. This peak annual DSCI reading was also the state’s highest magnitude since the U.S. Drought Monitor project began in 2000. But the index plunged shortly thereafter, falling below 2 in mid-October for first time since July 4 and then dropping even further to 1.17 by the end of October, the lowest since early June.
Just as this year’s rapid drying during late spring led to a “flash drought” characterized by its sudden onset, the DSCI shows that the drought’s weakening after mid-September was almost as quick. However, even the end-of-October DSCI is among the highest 20 percent of all weekly values in the Drought Monitor’s history, indicating that Wisconsin remained in drought even after the pronounced improvement.
Crop Yields Better Than Expected
In spite of the challenges posed by this year’s historic drought, numerous reports from around the state are revealing that crop harvests have been surprisingly good for the most part. For example, potato yields are mostly favorable, especially on farms that were able to irrigate sufficiently. In addition, the corn and soybean harvest in Wisconsin has also been better than expected. The surprisingly strong crop yields were helped by the abundant soil moisture when the drought began and the increasing usage of drought-resistant hybrid plants that conserve water during dry weather. Additional information on the status of crops in Wisconsin can be found in the weekly Crop Progress & Condition Report issued by the USDA’s National Agricultural Statistics Service.
A Warm October
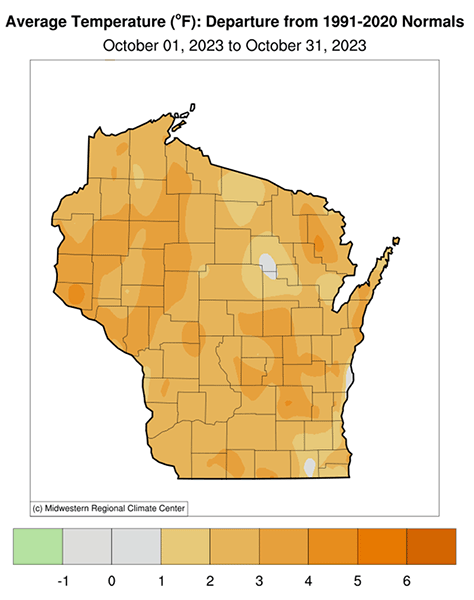
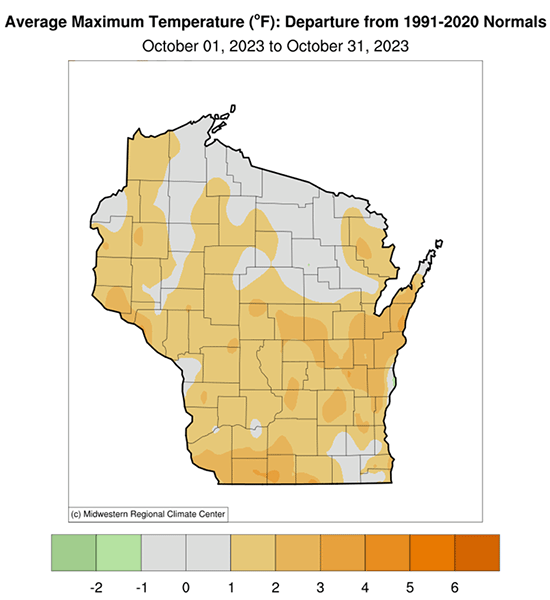
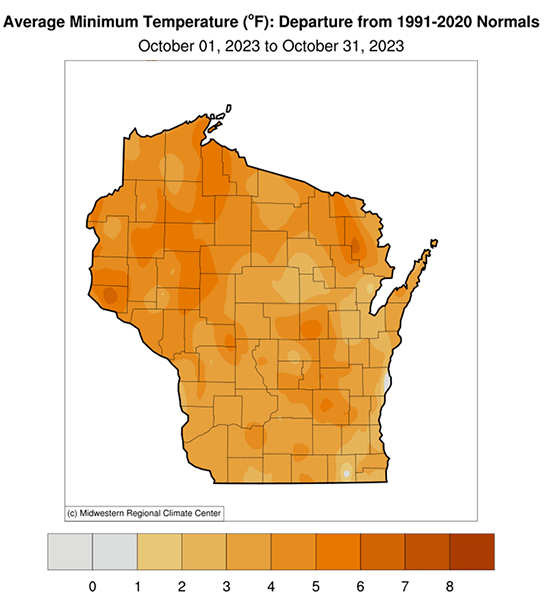
October was not only wet but also warm. The 49.4-degree average temperature for the month was 2.6 degrees above the 1991-2020 mean, making it the 28th warmest October on record (since 1895). In particular, the wetness was associated with high humidity, which helped to keep nights from becoming very cold. Nighttime low temperatures last month averaged 3.9 degrees above normal and were the 10th highest October reading on record, whereas daily high temperatures were only 0.8 degrees above normal.
Another feature of October’s warmth was how widespread it was. Everywhere in the state was unusually warm, with no particular region standing out with respect to average temperature, but the most anomalously warm overnight temperatures occurred mainly in the northern half of Wisconsin.
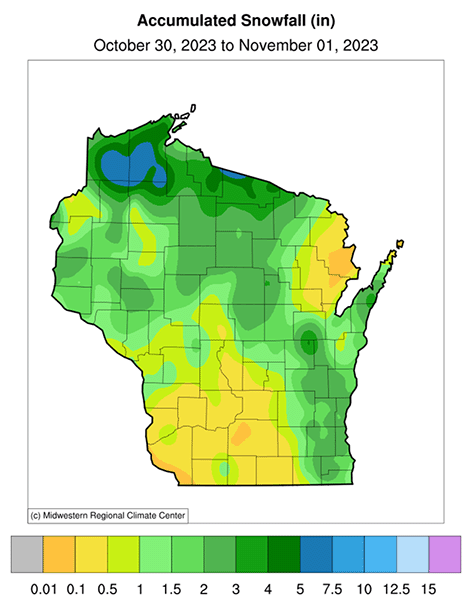
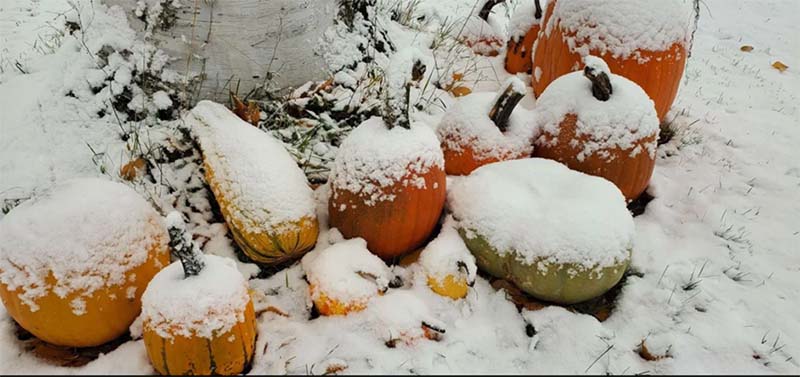
Halloween Snowstorm
An unusually early accumulating snowfall happened at the end of the month and created a wintry Halloween. Some locations picked up several inches, including a record Halloween total of 4.5 inches in Appleton that led to strangely white pumpkins this year!
End of the Growing Season
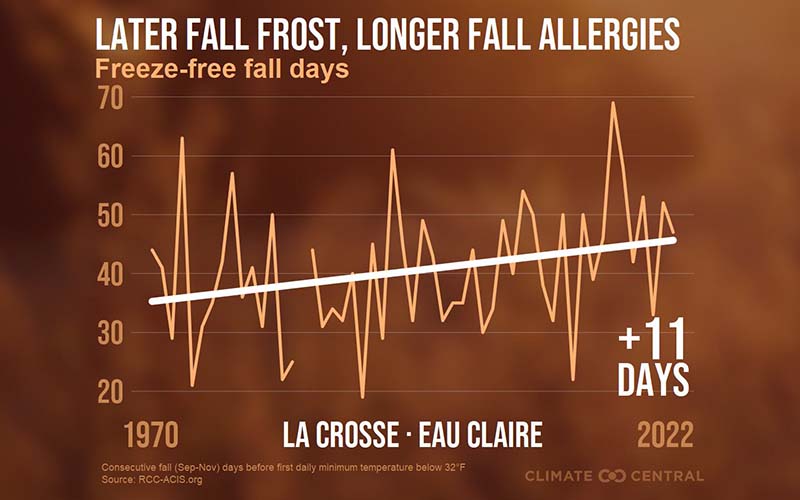
Despite the abnormally warm October, last month still marked the end of the growing season in Wisconsin, although the first frost arrived later than usual in most places. Our warming climate has been causing a lengthened growing season, which is reflected during autumn by first frosts and freezes arriving later. Data compiled by Climate Central, for example, shows this trend for the La Crosse-Eau Claire region, where the first frost of the season is occurring about 11 days later than it did 50 years ago and is prolonging the late-summer allergy season in the process.
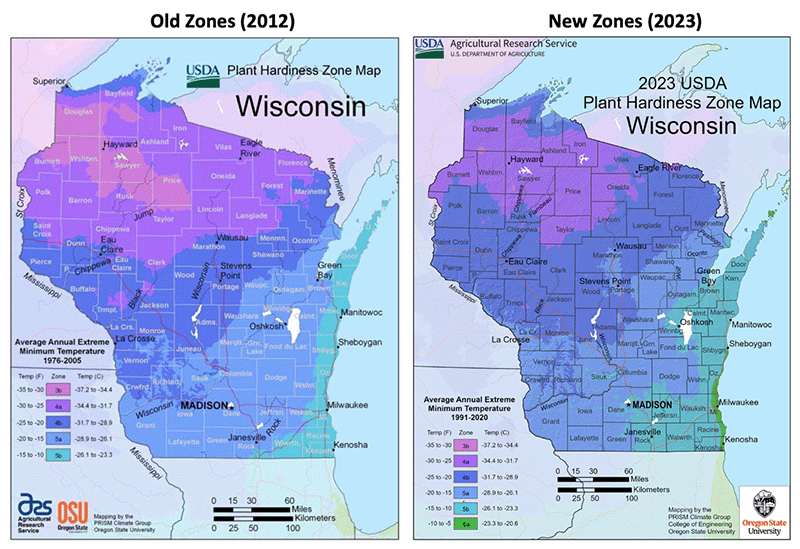
Plant Hardiness Zones
Another climate variable of importance for gardeners and other growers is “plant hardiness,” which is expressed by the USDA’s Plant Hardiness Zones. These maps provide guidance as to where perennial plants can safely grow, based on the coldest expected winter temperatures. The plant hardiness zones were just updated using the most recent climatic conditions covering years 1991 to 2020 and can be compared to their last revision in 2012 that used earlier years (1976 to 2005).
A couple of notable changes that reflect the warming of Wisconsin’s winters are the disappearance of Zone 3b (coldest winter temperature between -30 to -35 degrees Fahrenheit) in northern Wisconsin and the first statewide appearance of Zone 6a (coldest winter temperature between -5 to -10 degrees Fahrenheit) along the Lake Michigan shoreline in far southeastern Wisconsin.