Drought is a meteorological hazard that impacts many sectors in Wisconsin.
At the time this blog was written (September 30, 2026), northern Wisconsin was dealing with severe, extreme, and even exceptional drought.
Wisconsin is no stranger to drought. In the last five years alone, there have been multiple occasions when at least 20 percent of the state was in drought:
Year(s) |
Start Date |
End Date |
Number of Weeks |
| 2021 | April 27 | August 3 (also reached >20 percent on Aug. 24 and Sep. 7) | 17 |
| 2021-22 | November 2 | March 29 | 22 |
| 2022 | October 18 | November 1 | 3 |
| 2023-24 | June 6 | April 16 | 46 |
| 2024-25 | October 1 | April 1 | 27 |
| 2025-26 | November 4 | March 10 | 19 |
| 2026 | July 28 | September 22 | Ongoing |
To keep folks informed on the current extent and severity of drought, meteorologists and climatologists have produced the U.S. Drought Monitor (USDM) maps weekly since January 4, 2000. You may have seen these maps before with various shades of yellow, orange, and red, but have not been sure what they mean for you.
What does the USDM tell us?
The USDM maps are a “snapshot” of current drought conditions in every state, including Wisconsin. The USDM maps include six classifications:
- Two non-drought categories: Normal Conditions, Abnormally Dry (D0)
- Four drought levels: Moderate (D1), Severe (D2), Extreme (D3), and Exceptional (D4)
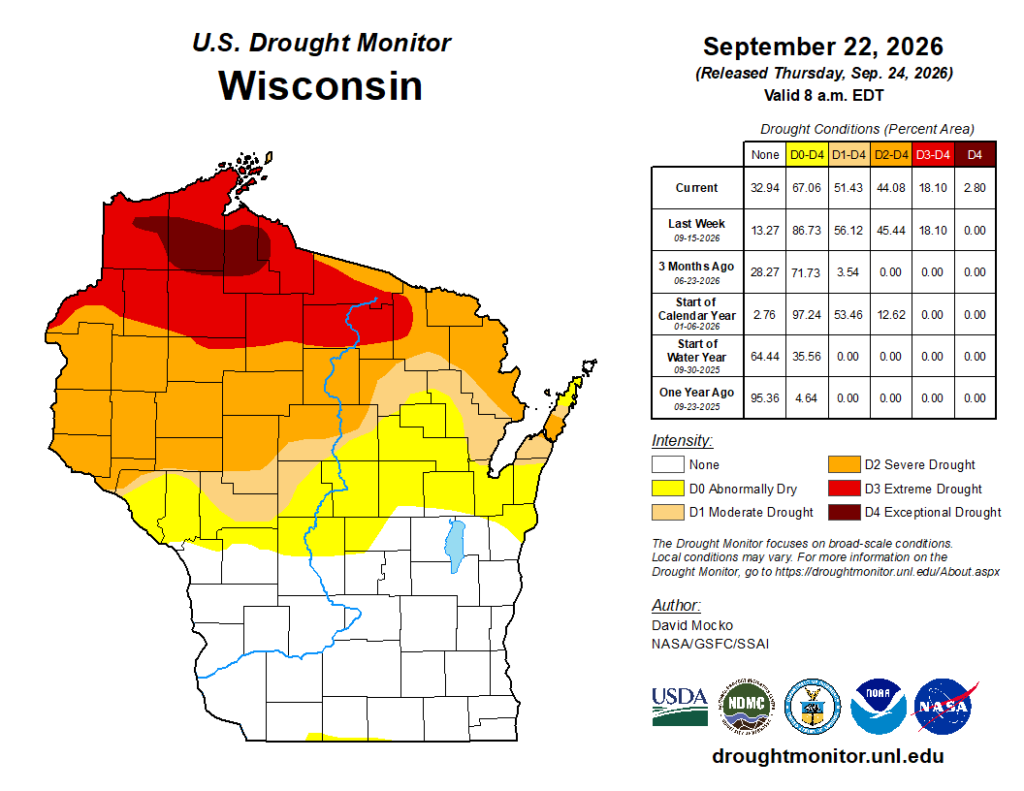
You might think that the UDSM maps only account for a lack of precipitation in your area, and while that is a major factor that is considered, many drought indicators and reported impacts are taken into account when updating the maps. This is because no single piece of data or evidence tells the full story of drought. Some of the factors that are considered include:
- Precipitation
- Streamflow
- Lake and reservoir levels
- Temperature
- Evaporative demand
- Soil moisture
- Vegetative health
- Local impacts
It is important to note that the USDM maps are not forecasts of drought nor will maps be changed once they have been published.
Who creates the USDM maps?
The USDM maps are produced weekly by meteorologists and climatologists from the National Drought Mitigation Center at the University of Nebraska-Lincoln, the National Oceanic and Atmospheric Administration and the U.S. Department of Agriculture. The maps are not generated by computers but instead are authored entirely by humans.
Updated maps come out on Thursdays, using data through the previous Tuesday morning to update the previous week’s map. To create the USDM maps, authors blend evidence from the indicators listed in the previous section, along with insights and observations from local experts.
In Wisconsin, the National Weather Service takes the lead in providing guidance to the USDM authors, with assistance from the State Climatology Office, state agencies, and Extension educators and specialists.*
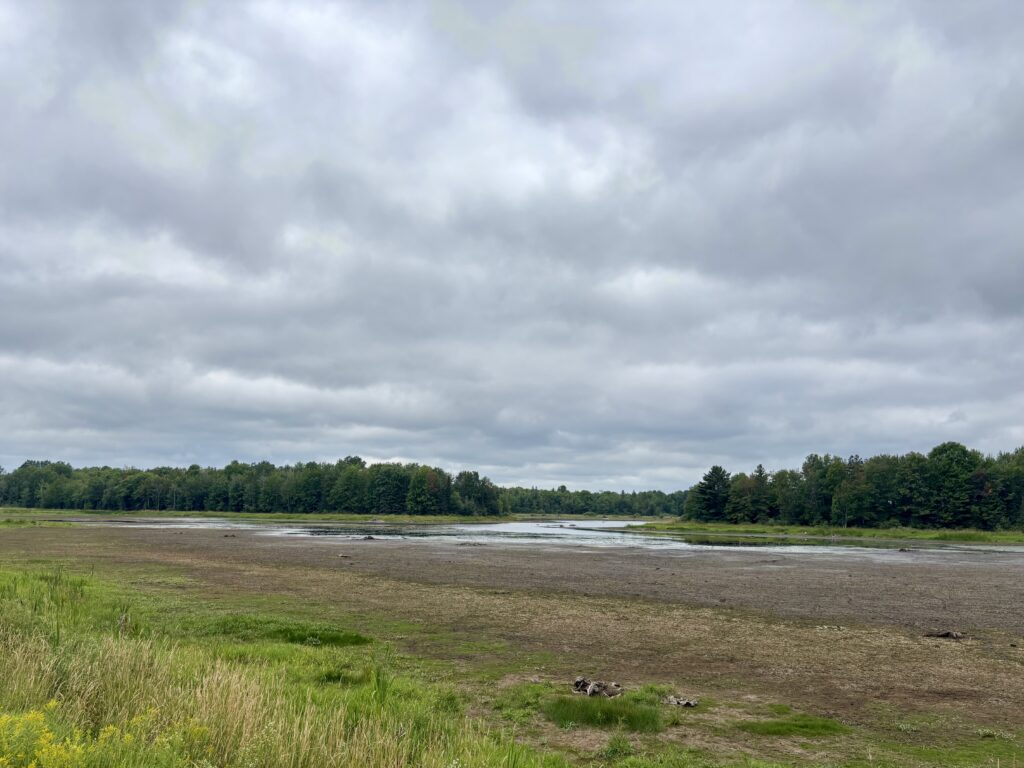
In some cases, you may wonder why the USDM map has not changed much after your area has received rain. In general, drought is a slow-moving hazard and it usually takes more than one rain event to reduce or eliminate drought that has been in place for a while. Temperatures also play an important role as hotter temperatures tend to speed up how quickly plants and soil dry out.
How are the USDM maps used?
A wide range of people and organizations use the USDM to make decisions. These include:
- Local, state, federal, and tribal agencies.
- Individuals, such as farmers, consultants, or water managers.
- Organizations, businesses, and industries.
- Policy and task forces.
Agencies use the USDM as a tool to help them know what actions to take. For example, USDA uses the USDM to determine eligibility for drought assistance programs:
- Livestock Forage Disaster Program (LFP): Eligibility is determined using a combination of intensity category (automatic for D3 and D4) and duration (weeks spent at D2 or higher). If any part of a county falls into these categories, then everyone in that county is eligible for the assistance program.
- Emergency Haying or Grazing on CRP: Eligible when a county is designated as D2 drought or higher.
In Wisconsin, there is a state drought task force that includes experts from the State Climatology Office, National Weather Service, and state and federal agencies. The role of the drought task force is to assess current drought conditions and impacts and to make recommendations to the Governor’s Office when emergency measures are warranted.
How can I contribute to the USDM updates?
You can be a part of the drought monitoring process. On-the-ground reports from local experts and citizens are vital to the weekly USDM updates. The authors need to know what impacts are being observed in order to accurately capture drought severity on the USDM map.
When the USDM authors see reports from citizens, they will confer with their local experts as well as examine all other drought indicators for that area. They will then determine whether drought severity and coverage should change for the latest USDM map.
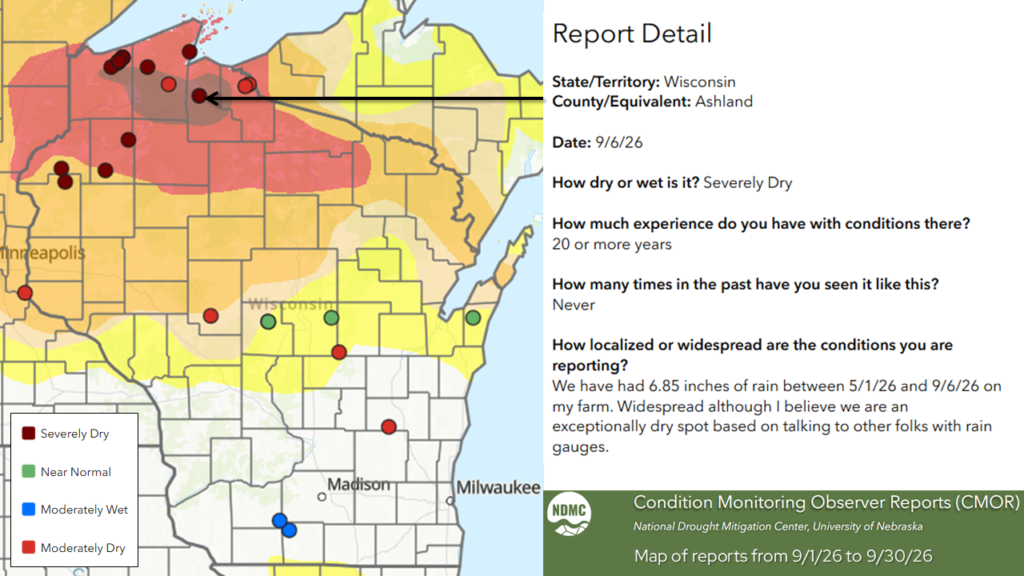
So, how can you report drought information for your location?
- Submit Condition Monitoring Observer Reports (CMOR): an online, citizen-science reporting system to report drought-related conditions and impacts within the U.S. and its territories. View an interactive map of reports.
- Become a CoCoRaHS observer: report daily precipitation measurements that can be used by USDM authors to assess precipitation deficits.
- Email the USDM authors: droughtmonitor@unl.edu
- Reach out to the Wisconsin State Climatology Office: let us know what you are observing in your neck of the woods.
Additional drought resources
- More about the USDM: What is the USDM?
- Past and current USDM maps
- Wisconsin State Climatology Office Drought Page
- UW Extension Agricultural Drought Articles
- Managing Risk of Field and Equipment Fires in the Midwest
- National Integrated Drought Information System (NIDIS): Learn about drought basics and sign up for drought update emails
- NDMC Factsheets
This is a product of the Wisconsin State Climatology Office. For questions and comments, please contact us by email (stclim@aos.wisc.edu) or by phone (608-263-2374).
*In their advisory roles, neither the State Climatology Office nor any other organization in the state determines the drought status for any location in Wisconsin. Rather, the final decision on the weekly drought status for every county across the state and nation rests entirely with the weekly designated USDM editor, a professional meteorologist or climatologist who is associated with the National Drought Mitigation Center, the National Oceanic and Atmospheric Administration, or the U.S. Department of Agriculture.