August delivered quite the finale to the summer season, with sharp contrasts from hot days to cool nights, heavy rainfall to worsening drought, and impacts ranging from early corn harvest to harmful algal blooms.
- A hot end to a warmer-than-normal summer
- Drought intensified in the north
- Wisconsin crops and lakes facing serious impacts
Summer’s Last Hurrah
Temperatures followed a fairly typical late-summer pattern for much of August, with a few notable shifts. The first two-thirds of the month brought mostly seasonable weather, with highs generally in the upper 70s and 80s and lows in the 50s and 60s.
The northern part of the state got a taste of fall, with temperatures occasionally dipping into the 40s and even 30s overnight. The coldest temperature of the month was 33 degrees in Rice Lake (Barron County) on August 20 and in Knight (Iron County) on August 24.
While these chilly nights aren’t unusual for late August in northern Wisconsin, the chill arrived a little earlier than usual in the southern counties. On August 24, southern Wisconsin saw early-morning lows in the 40s.
However, summer made a full return to end the month. On the final day of the season, heat and humidity surged across Wisconsin, with 80-degree highs statewide and 90s stretching from west-central to east-central Wisconsin.
The month’s hottest temperature — 91 degrees — was recorded in multiple locations on August 31: La Crosse (La Crosse County), Sparta-Fort McCoy (Monroe County), Wisconsin Rapids (Wood County), and Necedah (Juneau County).
Six additional locations recorded 90 degrees on the 31st. It was the only day all month when Wisconsin saw temperatures reach the 90s, even though August typically features numerous hot days.
The warmth also came with plenty of moisture. Dew points climbed into the 70s statewide, even reaching a remarkable 81 degrees at the Black Creek Wisconet station to the west of Green Bay.
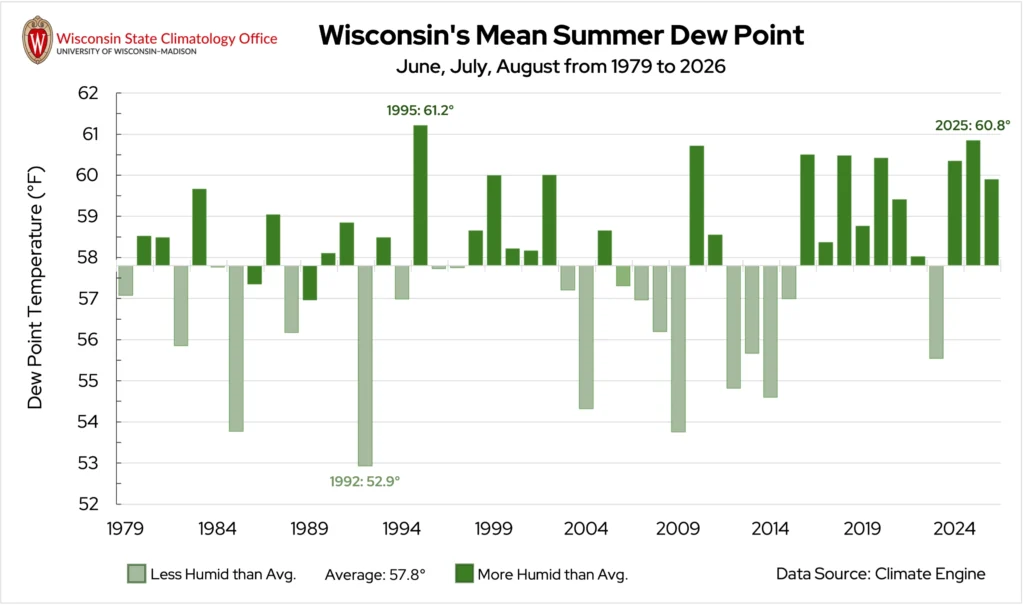
Despite a steamy finish to the month, Wisconsin was not overly humid this August, with a statewide average dew point of 59.3 degrees, just 0.6 degrees above average.
Regionally, though, the southern half of the state and along Lake Michigan tended to have higher daily maximum dew point temperatures throughout August compared to the northwestern quarter of the state.
This pattern may have been influenced, at least in part, by the ongoing drought conditions across portions of north-central and northwestern Wisconsin, where drier soils meant less moisture was available to return to the atmosphere through evaporation and plant transpiration.
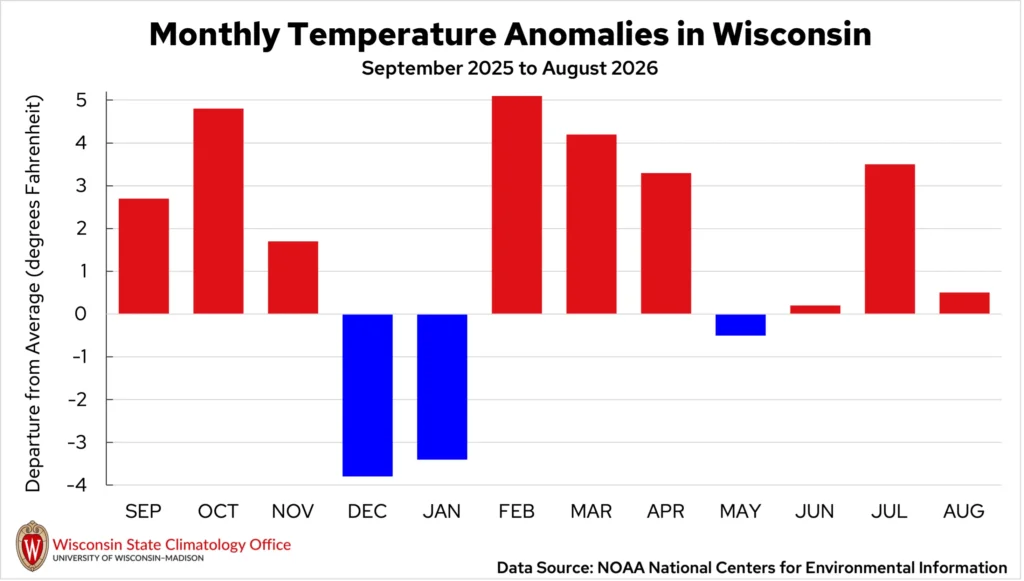
Overall, the state averaged 67.7 degrees in August, only 0.5 degrees above normal (Figure 1).
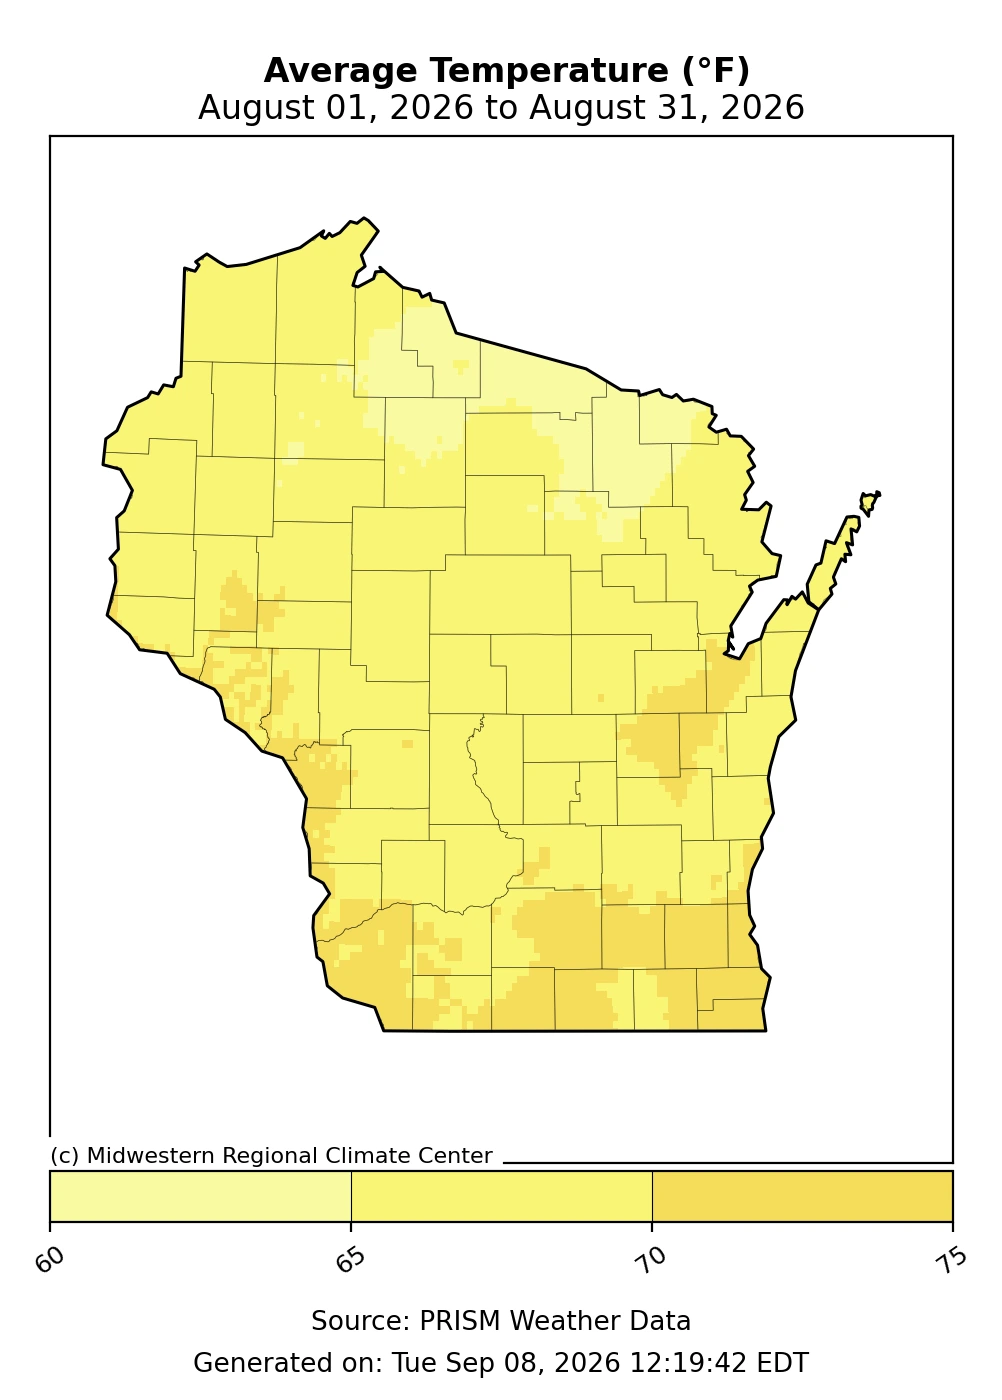
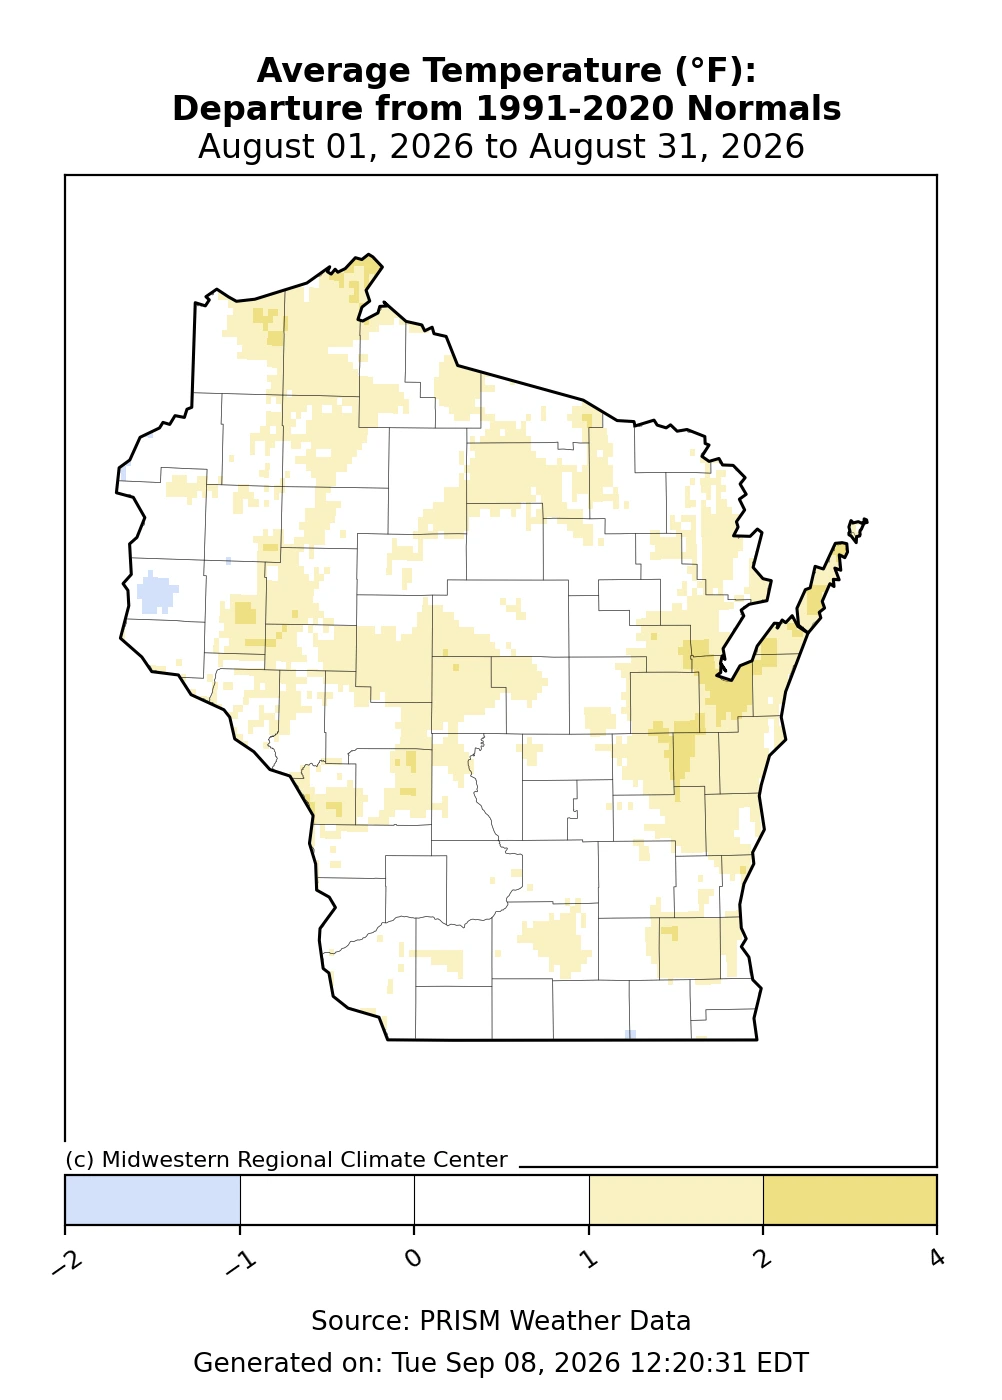
This month’s near-normal statewide average masked some interesting regional differences. Amplified daytime heating and nighttime cooling often accompany drought, and parts of the state’s drought-stricken regions showed this pattern.
Daytime temperatures were warmer than normal across much of central and northern Wisconsin, with areas averaging two to four degrees above normal. In contrast, several counties in southern Wisconsin averaged one to two degrees below normal.
Overnight temperatures, however, told a different story: much of central and southern Wisconsin averaged one to four degrees warmer than normal, while far northwestern Wisconsin was one to four degrees cooler than normal.
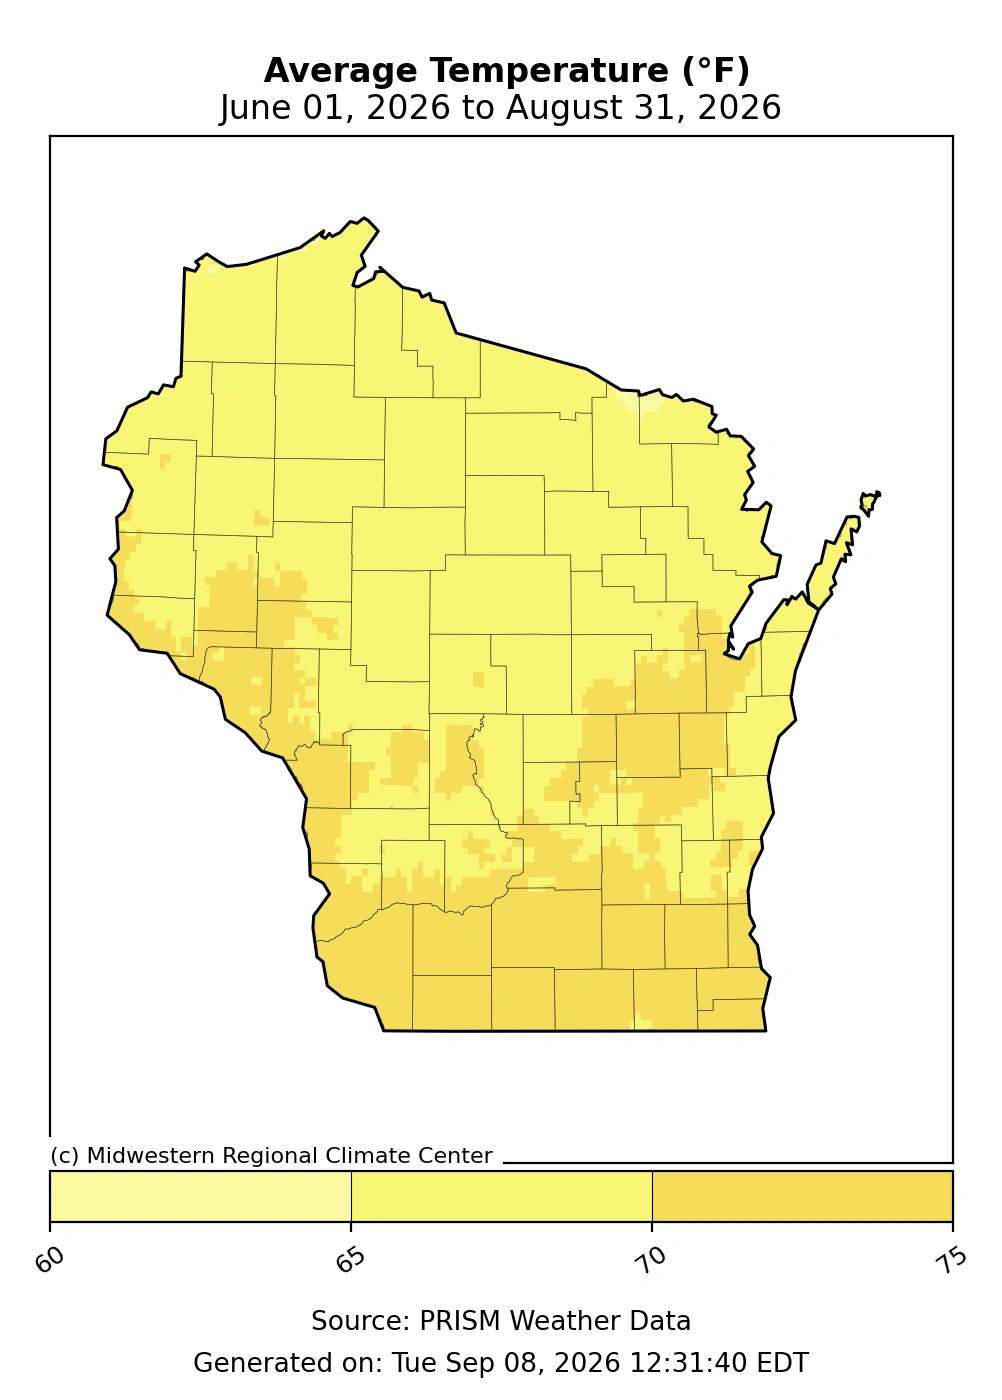
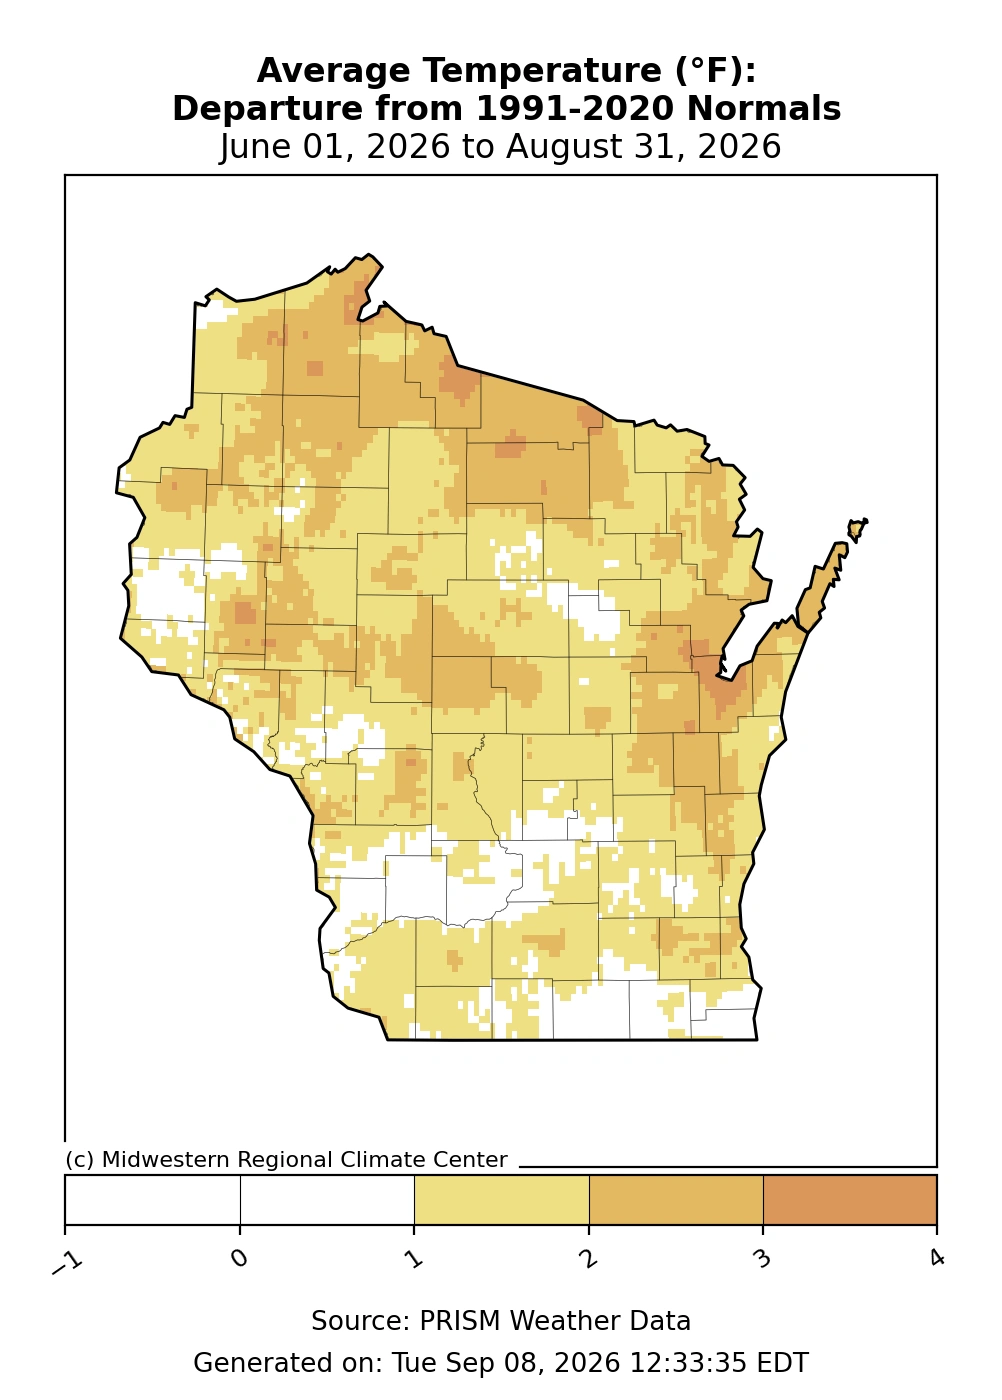
As a whole, August rounded out a warmer-than-normal summer for Wisconsin, with all three months finishing above average (Figures 2 and 3). The statewide average was 68.5 degrees, 1.3 degrees above normal. 2026 was Wisconsin’s seventh consecutive warmer-than-average summer.
The summer’s warmth was accompanied by plenty of muggy weather, making it Wisconsin’s 10th-most-humid summer on record based on average dew point temperature (Figure 4).
While June and August were both close to normal, July was the standout, averaging 3.5 degrees above normal and providing this summer’s most memorable heat when the mercury soared to 104 degrees.
Despite only reaching 100 degrees a handful of times so far this year, Wisconsin continues to record “hot” days and “warm” nights — some locations more than others (Table 1). As a state, the number of 90-degree or hotter days so far this year is right near normal, and the number of 70-degree or warmer nights is slightly below normal.
That said, keep in mind we are anticipating a warmer-than-normal fall, which could mean a continuation of hot days and warm nights.
| Location | # of 90-degree days in 2026 (thru August) | 1991-2020 normal # of 90-degree days per year (entire year) | # of 70-degree nights in 2026 (thru August) | 1991-2020 normal # of 70-degree nights per year (entire year) |
|---|---|---|---|---|
| La Crosse | 13 | 17 | 12 | 12 |
| Eau Claire | 11 | 10 | 2 | 4 |
| Madison | 10 | 9 | 7 | 8 |
| Milwaukee | 8 | 9 | 12 | 13 |
| Wausau | 7 | 5 | 3 | 2 |
| Green Bay | 5 | 6 | 2 | 2 |
| Six-City Average | 9 | 9 | 6 | 7 |
The Dry Get Drier, the Wet Get Wetter
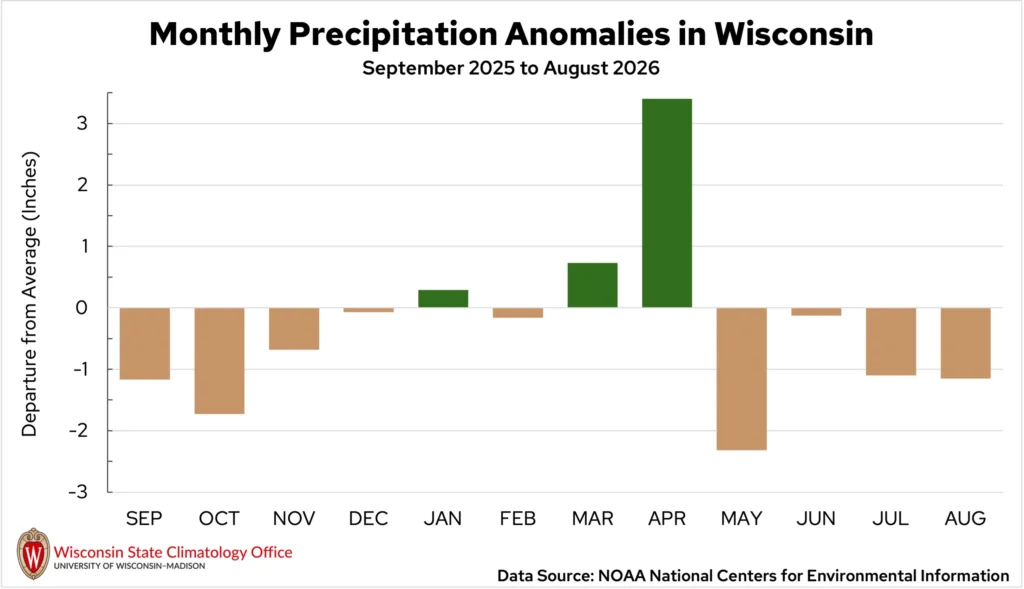
August presented promising weather systems that dropped inches of rain at a time, but unfortunately, totals remained slim in the locations that needed it most. Overall, the state averaged 2.75 inches of precipitation for the month, 1.15 inches drier than average (Figure 5).
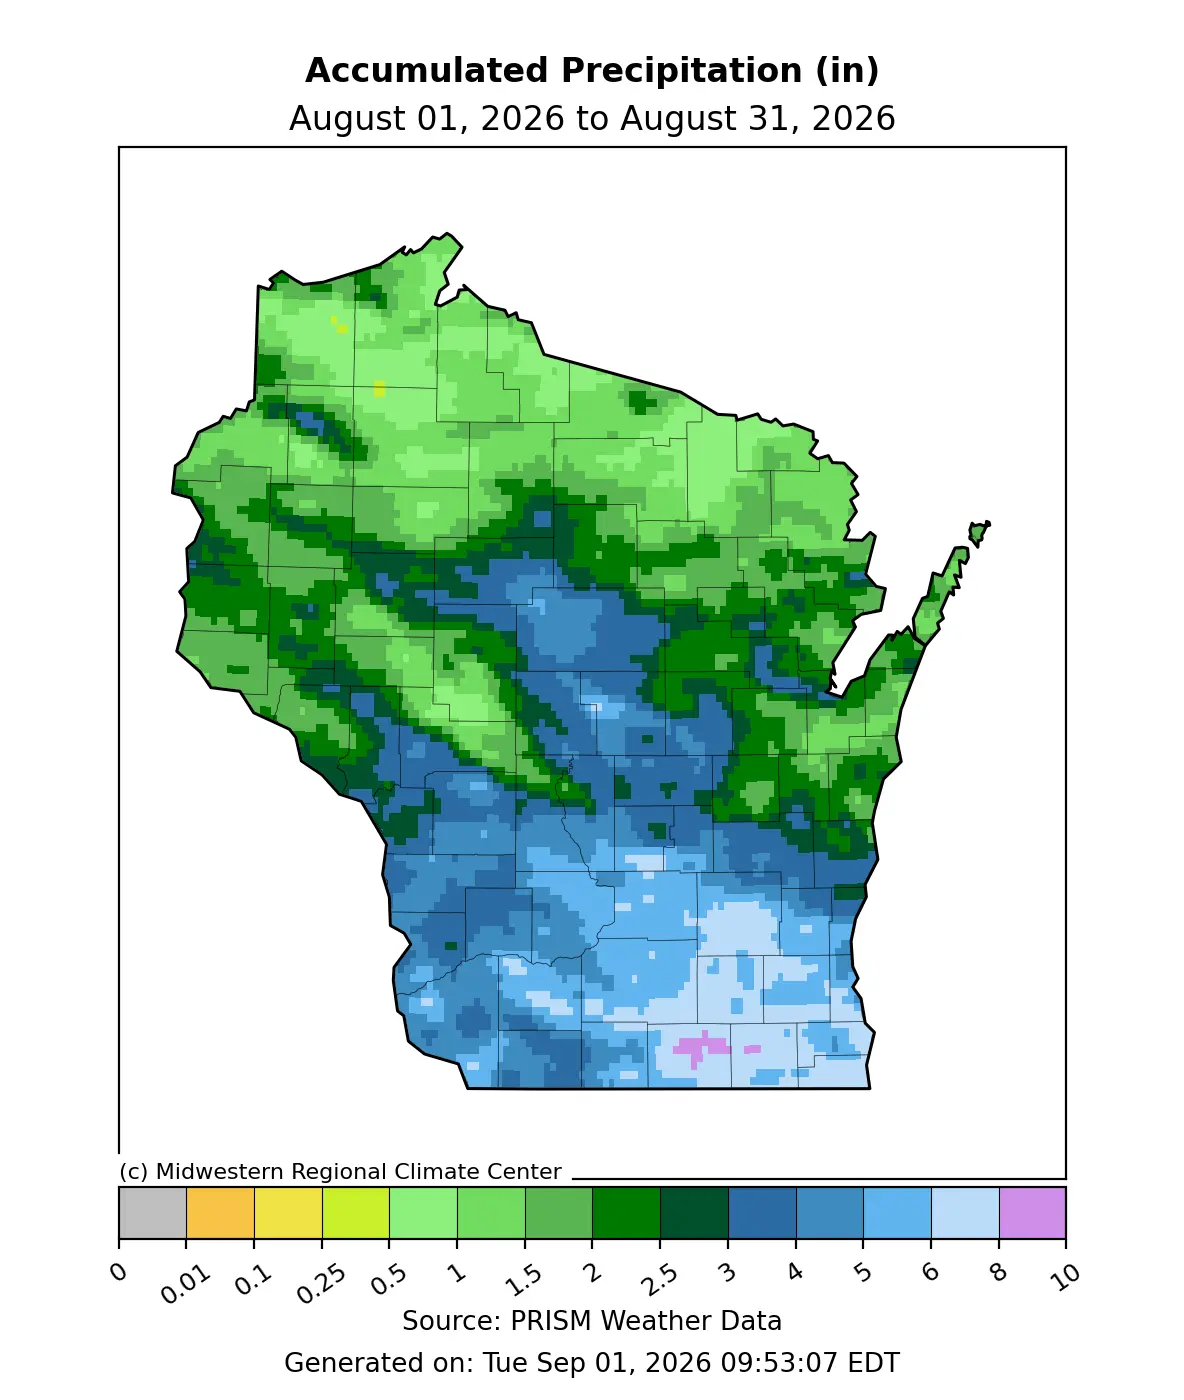
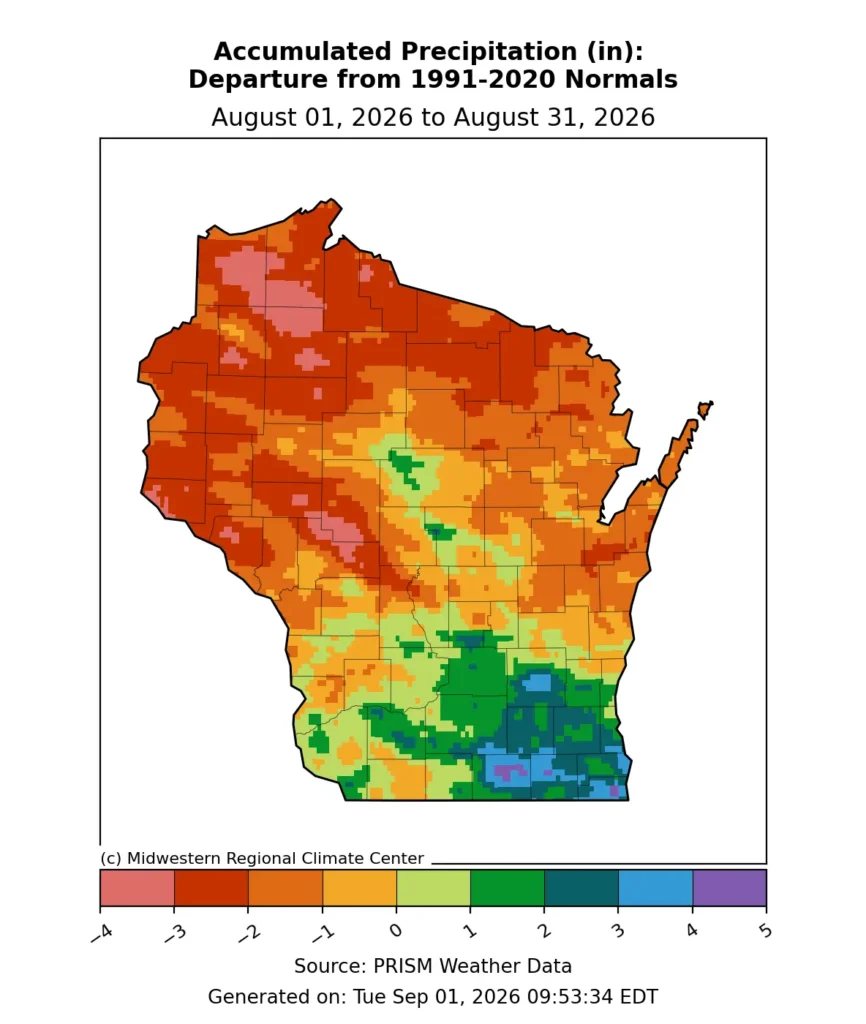
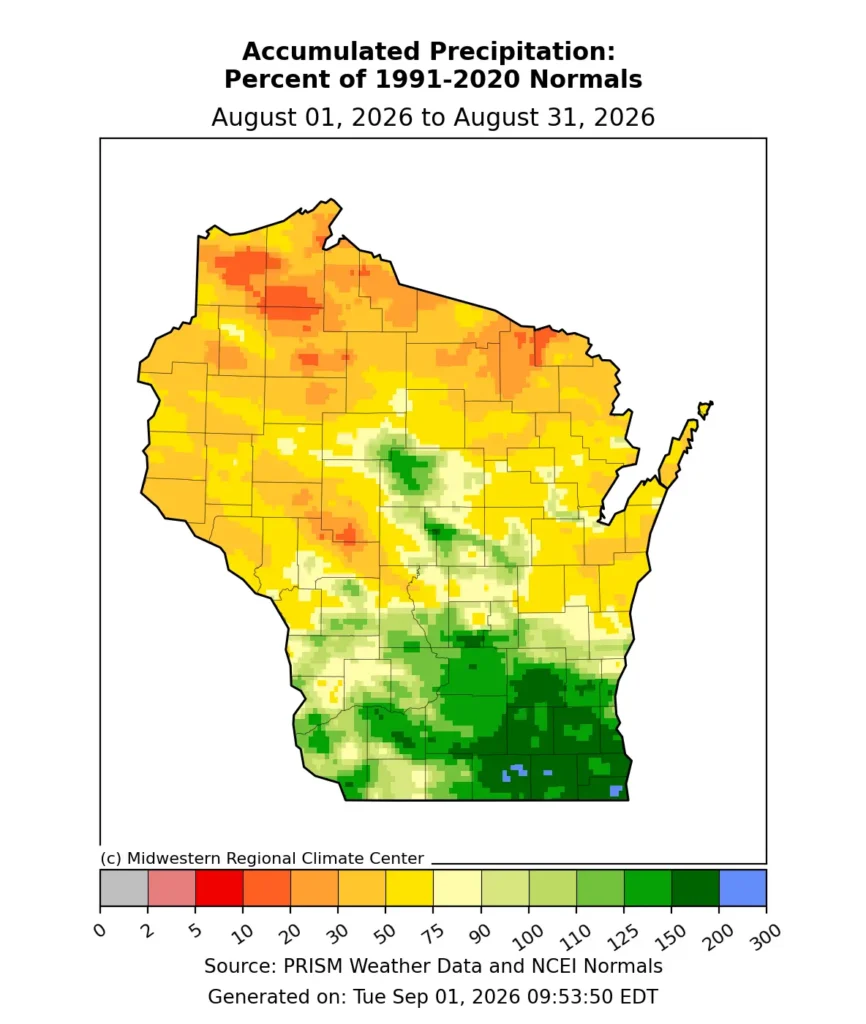
However, opposite corners of the state saw very different conditions. The northwest corner averaged only 1.51 inches of rain, the region’s fifth driest August since 1895. Meanwhile, the southeast region averaged 5.80 inches, its 12th wettest since 1895.
Following the extreme dryness of July, southern Wisconsin benefited from heavy rain on the first of August. Many southeast locations boasted over two inches of precipitation, with the Wisconet station in Porter (Rock County) measuring four inches.
On August 9, a cold front brought a swath of heavy rain to central and southern Wisconsin. Rainfall rates of two inches per hour caused minor street flooding in parts of Walworth and Racine counties. A reporter in Elkhorn (Walworth County) measured 3.8 inches of rain in just an hour.
Southern Wisconsin was in luck again on August 18, as thunderstorms poured half an inch to an inch of rain on the region. Isolated downpours targeted the area again on August 21, dumping an inch of rain within 20 minutes at the Dane County Regional Airport. The same system brought small amounts of rain to northern Wisconsin, with reports of 0.25 to 0.5 inches in Lincoln and Oneida counties.
Through it all, northwestern Wisconsin was left parched. The Ashland Kennedy Memorial Airport measured 0.96 inches of rain for the month, the location’s driest August since it began reporting in 1999. Minocqua (Oneida County) reported 0.74 inches, the city’s second driest August since 1905.
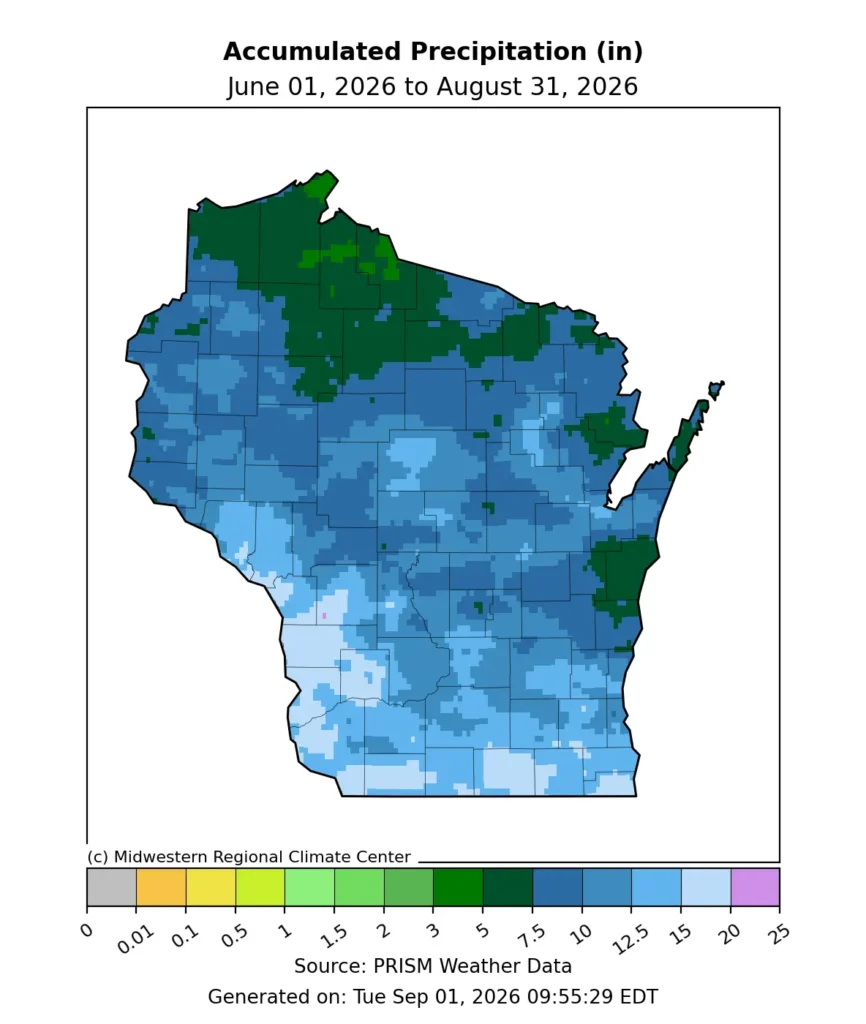
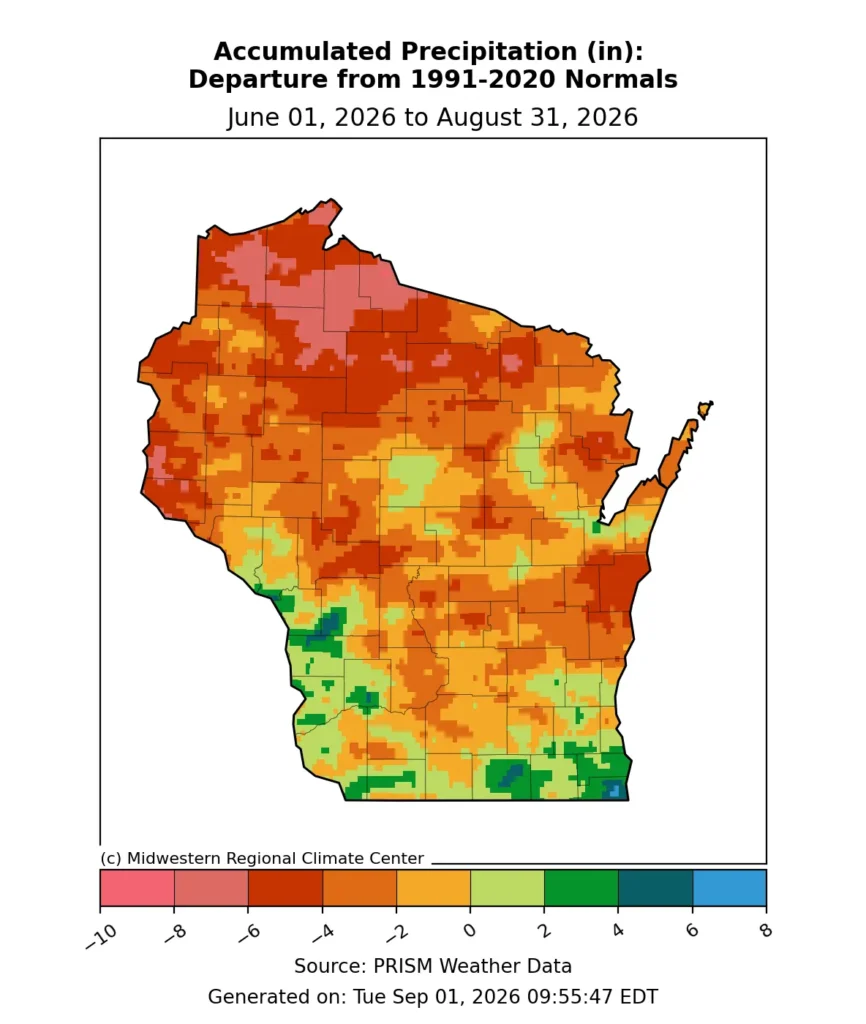
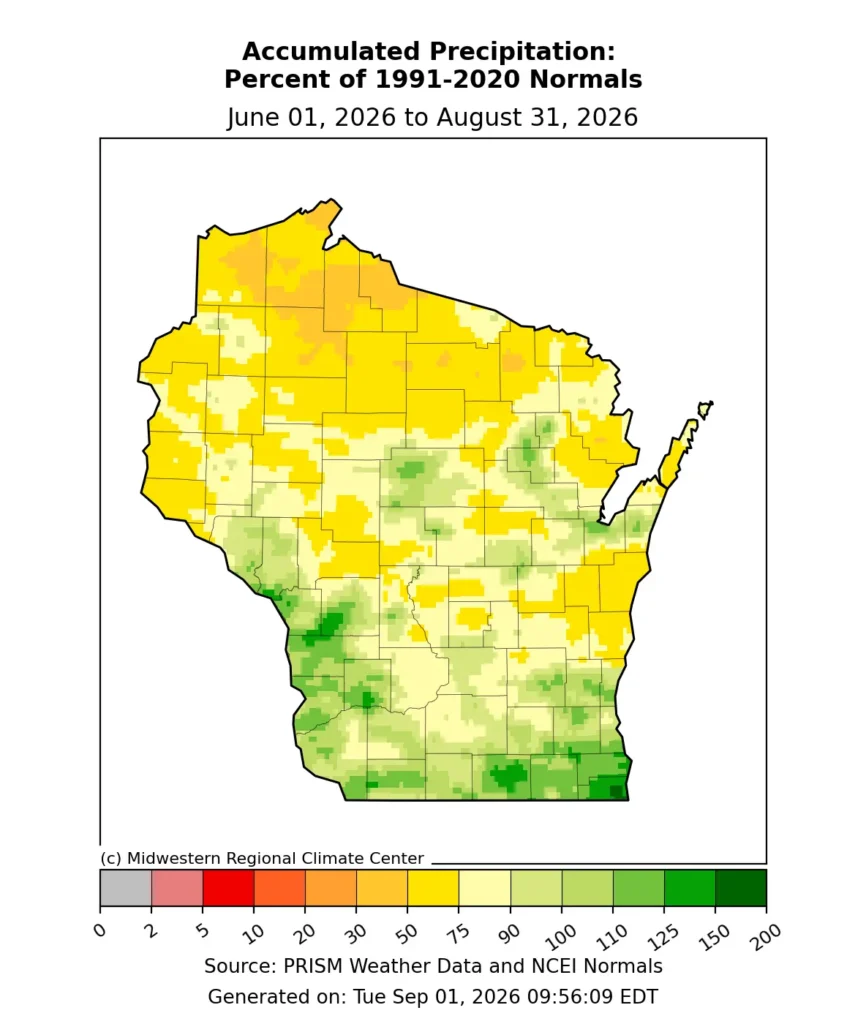
Dryness plagued much of the Badger State throughout the three summer months, particularly from mid-July through August (Figure 6). Only a few portions of the western and southern regions saw above-normal precipitation through the season, while the northern counties were consistently the driest.
It was the sixth driest summer in Rhinelander (Oneida County) since 1908, with just 7.50 inches of precipitation. Wausau saw its 13th driest season since 1940 with 9.23 inches. In Iron County, 5.27 inches made for Hurley’s driest summer since the city’s records began in 1987. Statewide, the average summer precipitation was 10.30 inches, 1.45 inches drier than average (Figure 7).
Isolated Severe Weather
August’s dryness helped limit the amount of severe weather in the state. A cluster of thunderstorms in southeast Wisconsin on August 9 produced hail as large as ping-pong balls (1.5 inches in diameter) in Walworth County, and a downburst caused isolated damage to trees and a home in Marquette County. The downburst winds were estimated at 70 to 80 miles per hour.
On August 11, three homes caught fire in Iowa County after being struck by lightning as thunderstorms moved across the region.
Thunderstorms developed along a cold front as it swept through central and eastern Wisconsin on August 18. As storms pushed through Washington, Waukesha, and Milwaukee counties, 60 to 80 miles per hour downbursts created widespread tree damage. A brief tornado occurred in far southern Washington County — the sole tornado to occur in Wisconsin in August (Table 2).
| Location | Date | Enhanced Fujita (EF) Rating | Estimated Maximum Winds | Damage Reported |
| Colgate (Washington Co.) | August 18 | EF0 | 80 MPH | Some structural damage and multiple uprooted trees |
On August 28, during one of the few thunderstorms in northern Wisconsin in August, a young boy and his mother were struck by lightning while camping in Bayfield County and suffered serious injuries.
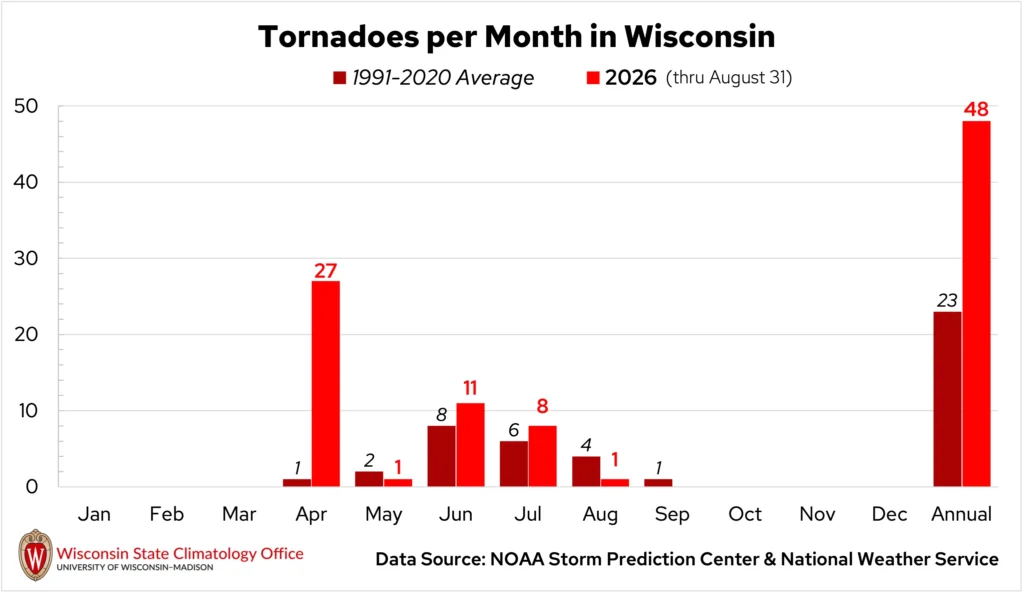
Severe weather was a major feature in Wisconsin’s 2026 summer weather. The National Weather Service issued 411 severe thunderstorm and tornado warnings for the state, the fourth most for a summer season since 1986. June was the most active, with 199 warnings — over 100 more than normal for the month.
A total of 20 tornadoes occurred between June 1 and August 31, two more than the seasonal average from 1991 to 2020 (Figure 8). Wisconsin’s 2026 tornado count stands at 48, following the one August tornado and new video evidence of a small tornado that occurred in Marathon County on July 20. This makes 2026 the second-most tornadic year in Wisconsin since 1950. The most tornadic year was in 2005, when 62 tornadoes occurred.
Drought Intensifies
Escalating drought was unfortunately the story of the summer in Wisconsin. Following the state’s fourth driest May on record, June began on a dry note. Near-average precipitation through June helped alleviate abnormally dry conditions by early July (Figure 9).
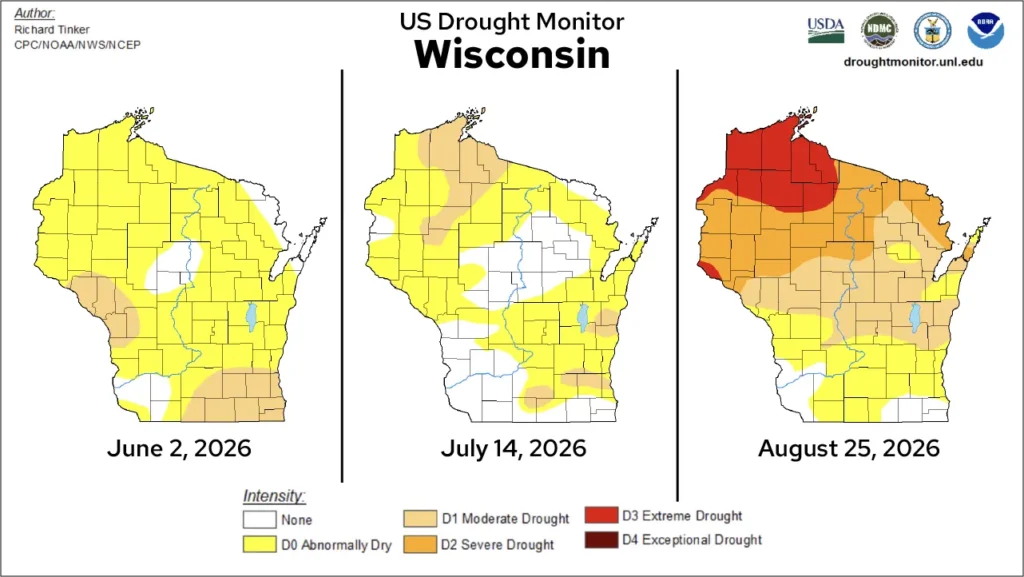
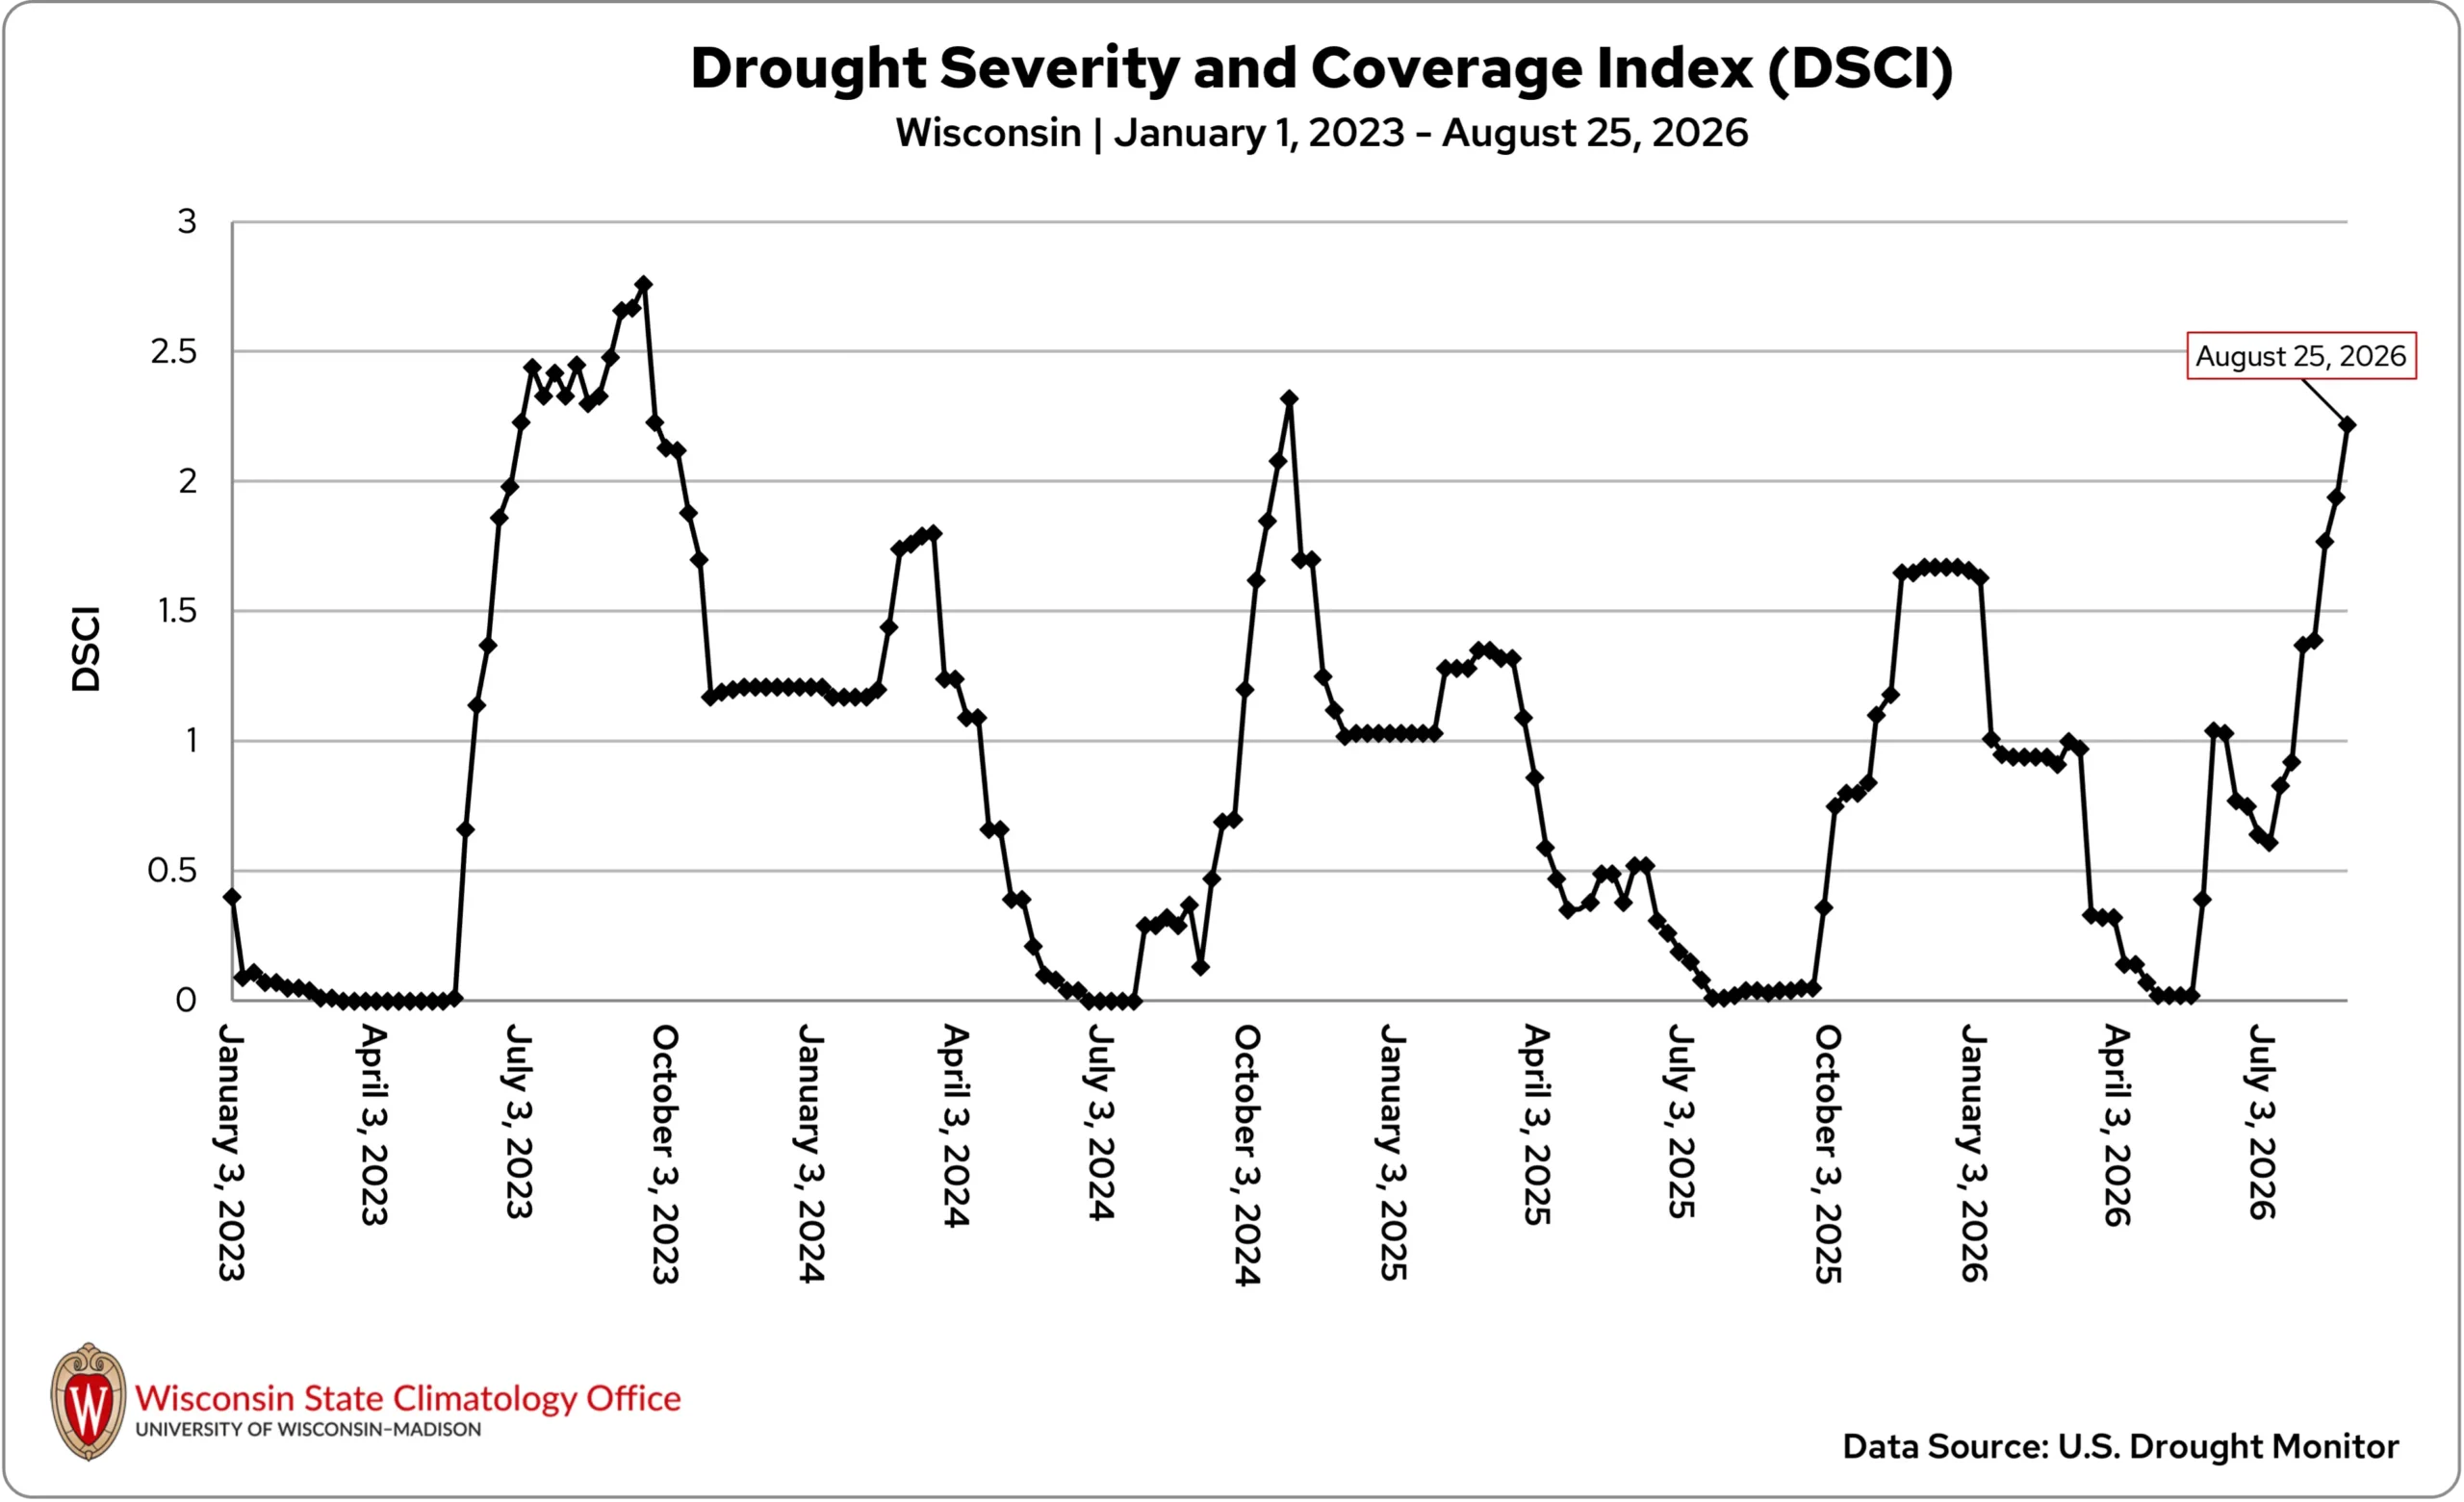
The relief was temporary, though, as prolonged dry spells through July caused conditions to escalate quickly. Late July’s severe drought (D2) in northern Wisconsin soon turned into extreme drought by mid-August — the first D3 in the state since January 2024, following the historic drought of 2023. The state’s Drought Coverage and Severity Index (DSCI) reached its highest since October 2024, and third-highest in the last three years (Figure 10).
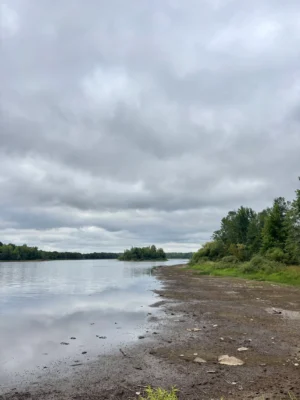
The extreme dryness of the summer will likely have lasting impacts into the fall season. The Wisconsin Department of Natural Resources (DNR) has noted unprecedented low flows in the state’s rivers, especially on the Wisconsin and Chippewa River systems. Many lakes and reservoirs in northern Wisconsin are inches to feet lower than usual (Image 1). Some hydropower facilities were even forced to reduce or turn off power generation.
In the Condition Monitoring Observer Reports system, some residents noted local creeks and streams were completely dry, deep cracks in the soil, and significant impacts to agriculture. The DNR expressed concerns over increased fire risks in the fall season, especially as farmers operate equipment in dry fields. The timing and vibrancy of fall colors will likely be impacted in parts of the state, as drought-stressed trees attempt to conserve energy.
A Challenging Summer for Farmers
For Wisconsin’s farmers, summer 2026 was a season of stark contrasts.
Row crops, like corn and soybeans, across much of the state got off to a promising start early in the growing season, but weeks of heat and increasingly scarce rainfall since July left parts of northern and northwestern Wisconsin struggling for moisture.
In August, areas in central and southern Wisconsin received just enough rain to give crops and pastures a much-needed boost, but much of the northern half of the state remained hot and dry. Some of northern Wisconsin’s corn crop failed to fully develop ears, and ears began to droop or even fall to the ground prematurely, likely resulting in substantial yield losses. By mid-August, some corn fields were already being chopped or harvested early to prevent losing any more of the crop to the continuing drought.
In central and northern Wisconsin, farmers noted their soybeans were wilting under the hot, dry conditions. Still, some had hope for their soybeans, though lower yields are likely where rainfall was limited during the reproductive stages — roughly late June through late August — when soybeans experience much of their growth.
In areas that received timely moisture during soybean reproductive stages, like southern Wisconsin, growers are more hopeful for higher yields.
Beyond row crops, drought reduced hay and pasture production across northern Wisconsin, forcing livestock producers to supplement feed. A few dairy operations in northern Wisconsin also faced water shortages and had to truck in water. This combination of heat, drought, and reduced access to food and water sources created additional stress for both livestock and their owners.
Fruit growers dealt with a mix of challenges, including sunburn, rots, and insects. Cranberry growers had to turn on sprinklers during a few near-freezing mornings in late August to protect their crop from frost damage.
However, as the apple-picking season approaches, growers are reporting an overall good crop, though yields may be lower following the weather whiplash with spring frost, hail in July, and late-summer drought.
On a brighter note, the record-setting rainfall in April followed by a lack of rain in late summer benefited wild rice, leaving tribal communities in northern Wisconsin hopeful for an abundant harvest after a series of subpar years.
Summer Heat Reaches Wisconsin’s Lakes
Not only were water levels down, but harmful algal blooms were an increasing concern across Wisconsin’s waters this summer as a result of warm, sunny, and calm conditions.
By August 19, the Wisconsin DNR had received 217 reports of algal blooms so far this year, about 60 more than at the same time last year. Of those, 153 were confirmed cyanobacteria.
The Wisconsin Department of Health Services had also investigated 30 illnesses potentially associated with blue-green algae, including two dog deaths. Most illnesses were connected to clusters on Lake Du Bay in Marathon and Portage counties and Booth Lake in Walworth County, where water samples confirmed the presence of microcystin, a toxin produced in some cyanobacteria.
Climate Ed-ucation
Wisconsin is no stranger to severe thunderstorms, but some long-lived storm clusters can deliver hurricane-strength winds that produce widespread, devastating damage.
Dive into the physics of how derechos form and how often Wisconsin is likely to be impacted by them in this month’s Climate Ed-ucation blog.
Climate Stats by Division
Color Key
-
Dark blue: Record coolest
-
Royal blue: Bottom ⅒
-
Light blue: Bottom ⅓
-
White: Normal
-
Light orange: Top ⅓
-
Orange: Top ⅒
-
Red: Record warmest
-
Dark brown: Record driest
-
Light brown: Bottom ⅒
-
Beige: Bottom ⅓
-
White: Normal
-
Light green: Top ⅓
-
Green: Top ⅒
-
Dark green: Record wettest
| Temperature (degrees Fahrenheit)
August 2026 |
Liquid-Equivalent Precip. (Inches)
August 2026 |
Liquid-Equivalent Precip. (Inches)
Nov. 1, 2025 – August 31, 2026 |
||||
|---|---|---|---|---|---|---|
| Division | Avg | Dept | Avg | Dept | Avg | Dept |
| Northwest | 66.1 :Normal | 0.2:Normal | 1.51: Bottom ⅒ | -2.46: Bottom ⅒ | 21.20: Bottom ⅓ | -4.61: Bottom ⅓ |
| North Central | 65.7 :Top ⅓ | 0.8 :Top ⅓ | 2.05: Bottom ⅒ | -1.67: Bottom ⅒ | 24.61: Normal | -1.74: Normal |
| Northeast | 65.8: Top ⅓ | 0.3:Top ⅓ | 1.71: Bottom ⅒ | -1.70: Bottom ⅒ | 26.84: Top ⅓ | 1.51: Top ⅓ |
| West Central | 69.2: Top ⅓ | 0.8:Top ⅓ | 2.30 : Bottom ⅓ | -2.09: Bottom ⅓ | 25.12: Normal | -3.24: Normal |
| Central | 69.0: Top ⅓ | 0.9:Top ⅓ | 3.57: Normal | -0.43: Normal | 28.38: Top ⅓ | 0.70: Top ⅓ |
| East Central | 68.8: Top ⅓ | 0.7:Top ⅓ | 2.14: Bottom ⅓ | -1.35: Bottom ⅓ | 27.12: Top ⅓ | 0.52: Top ⅓ |
| Southwest | 69.4: Normal | 0.0:Normal | 3.89: Normal | -0.27: Normal | 31.14: Top ⅓ | 0.20: Top ⅓ |
| South Central | 69.9: Normal | 0.4:Normal | 5.37:Top ⅓ | 1.23: Top ⅓ | 29.02: Top ⅓ | -1.25: Top ⅓ |
| Southeast | 70.2: Normal | 0.6:Normal | 5.80: Top ⅓ | 2.00: Top ⅓ | 31.80 Top ⅓ | 2.71 Top ⅓ |
| State | 67.7: Normal | 0.5:Normal | 2.75: Bottom ⅓ | -1.15 Bottom ⅓ | 26.25 Normal | -1.21 Normal |
Monthly, seasonal, and annual temperature and precipitation values and rankings published in this report are from NOAA’s National Centers for Environmental Information at the time of posting this climate summary. Values and rankings can change after publishing our climate summaries. To check the most recent values and rankings, visit NOAA’s National Centers for Environmental Information Climate at a Glance Tool.
This report is a product of the Wisconsin State Climatology Office. For questions and comments, please contact us by email (stclim@aos.wisc.edu) or phone (608-263-2374).